. 2022 Apr;87(4):1731-1741.
doi: 10.1002/mrm.29072. Epub 2021 Nov 9.

Phase-independent thermometry by Z-spectrum MR imaging

Affiliations

Phase-independent thermometry by Z-spectrum MR imaging

Alessandro M Scotti et al. Magn Reson Med. 2022 Apr.

Abstract

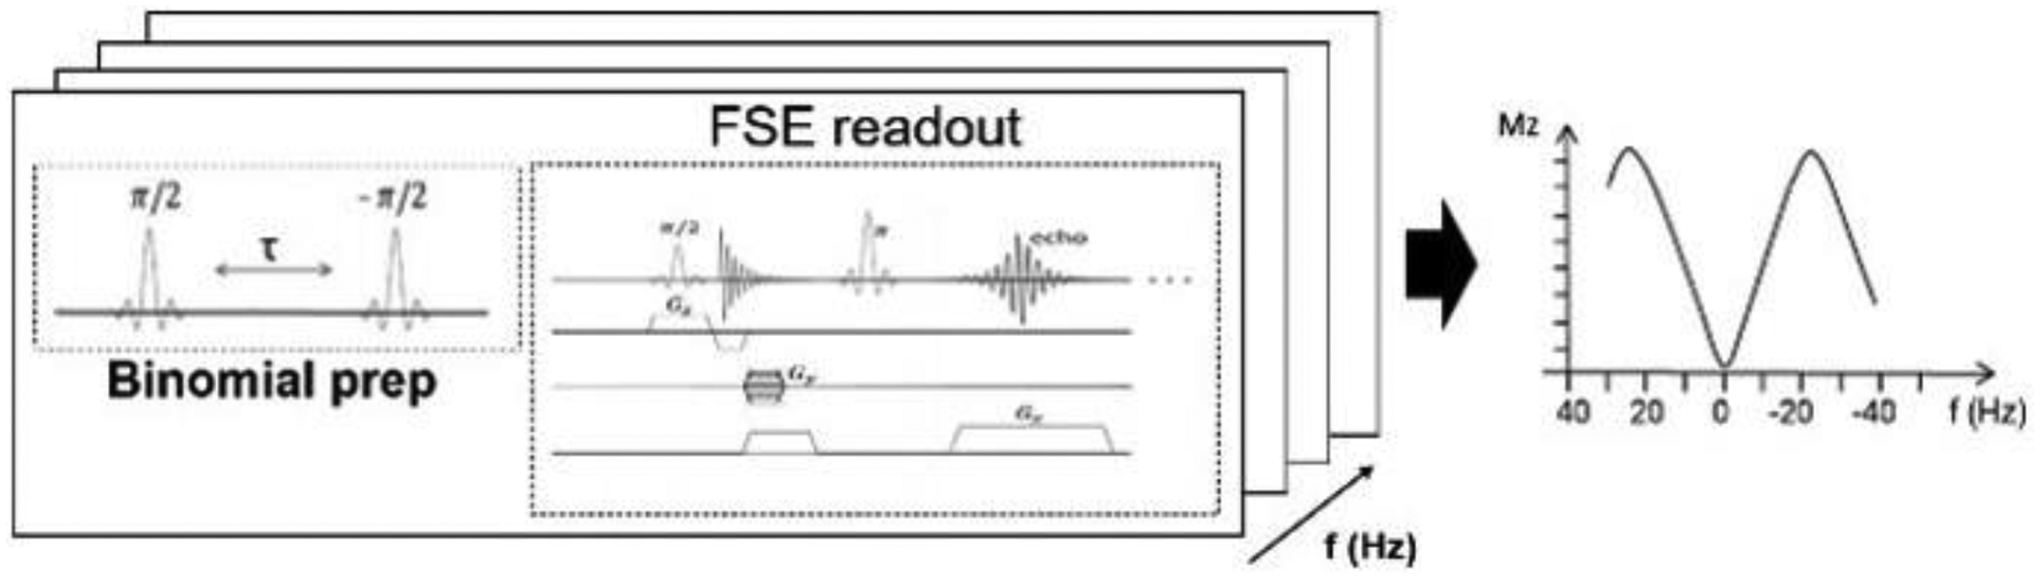
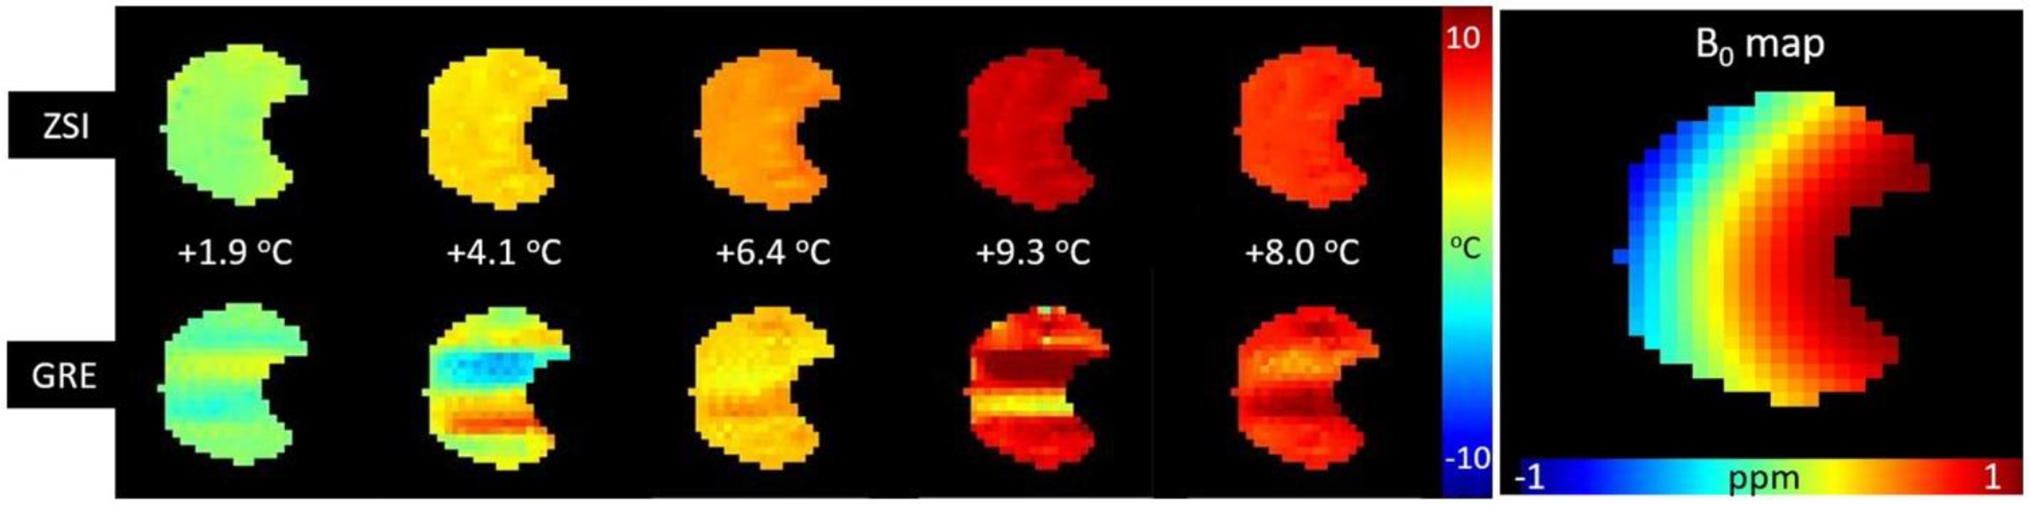
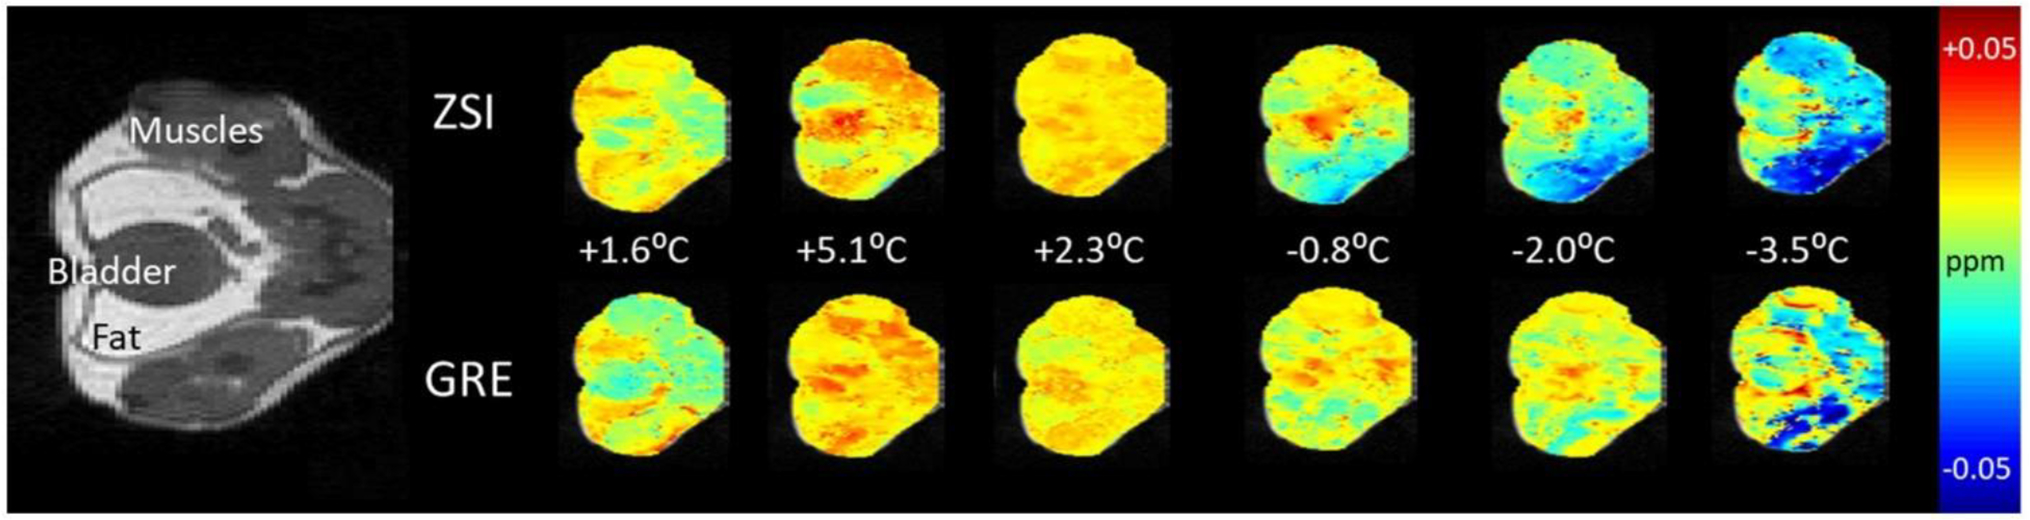
Purpose: Z-spectrum imaging, defined as the consecutive collection of images after saturating over a range of frequency offsets, has been recently proposed as a method to measure the fat-water fraction by the simultaneous detection of fat and water resonances. By incorporating a binomial pulse irradiated at each offset before the readout, the spectral selectivity of the sequence can be further amplified, making it possible to monitor the subtle proton resonance frequency shift that follows a change in temperature.

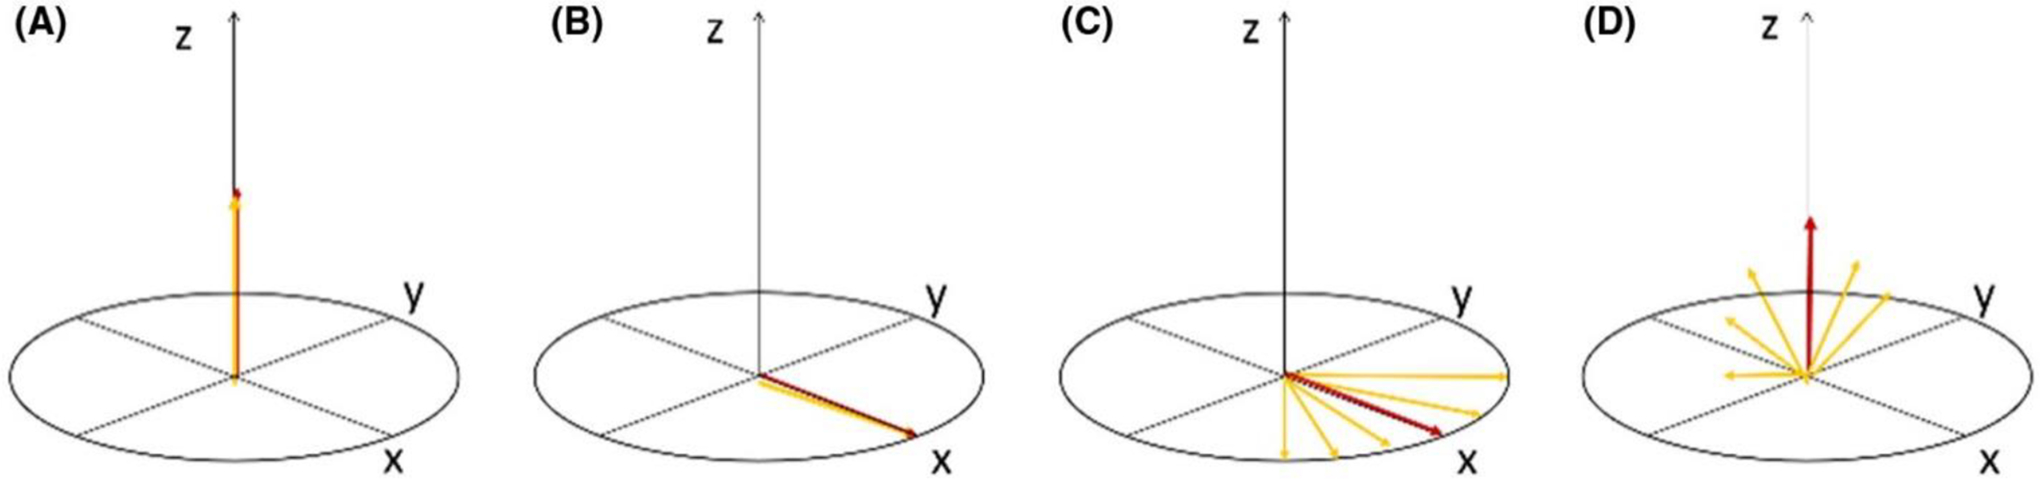
Methods: We tested the hypothesis in aqueous and cream phantoms and in healthy mice, all under thermal challenge. The binomial module consisted of 2 sinc-shaped pulses of opposite phase separated by a delay. Such a delay served to spread out off-resonance spins, with the resulting excitation profile being a periodic function of the delay and the chemical shift.

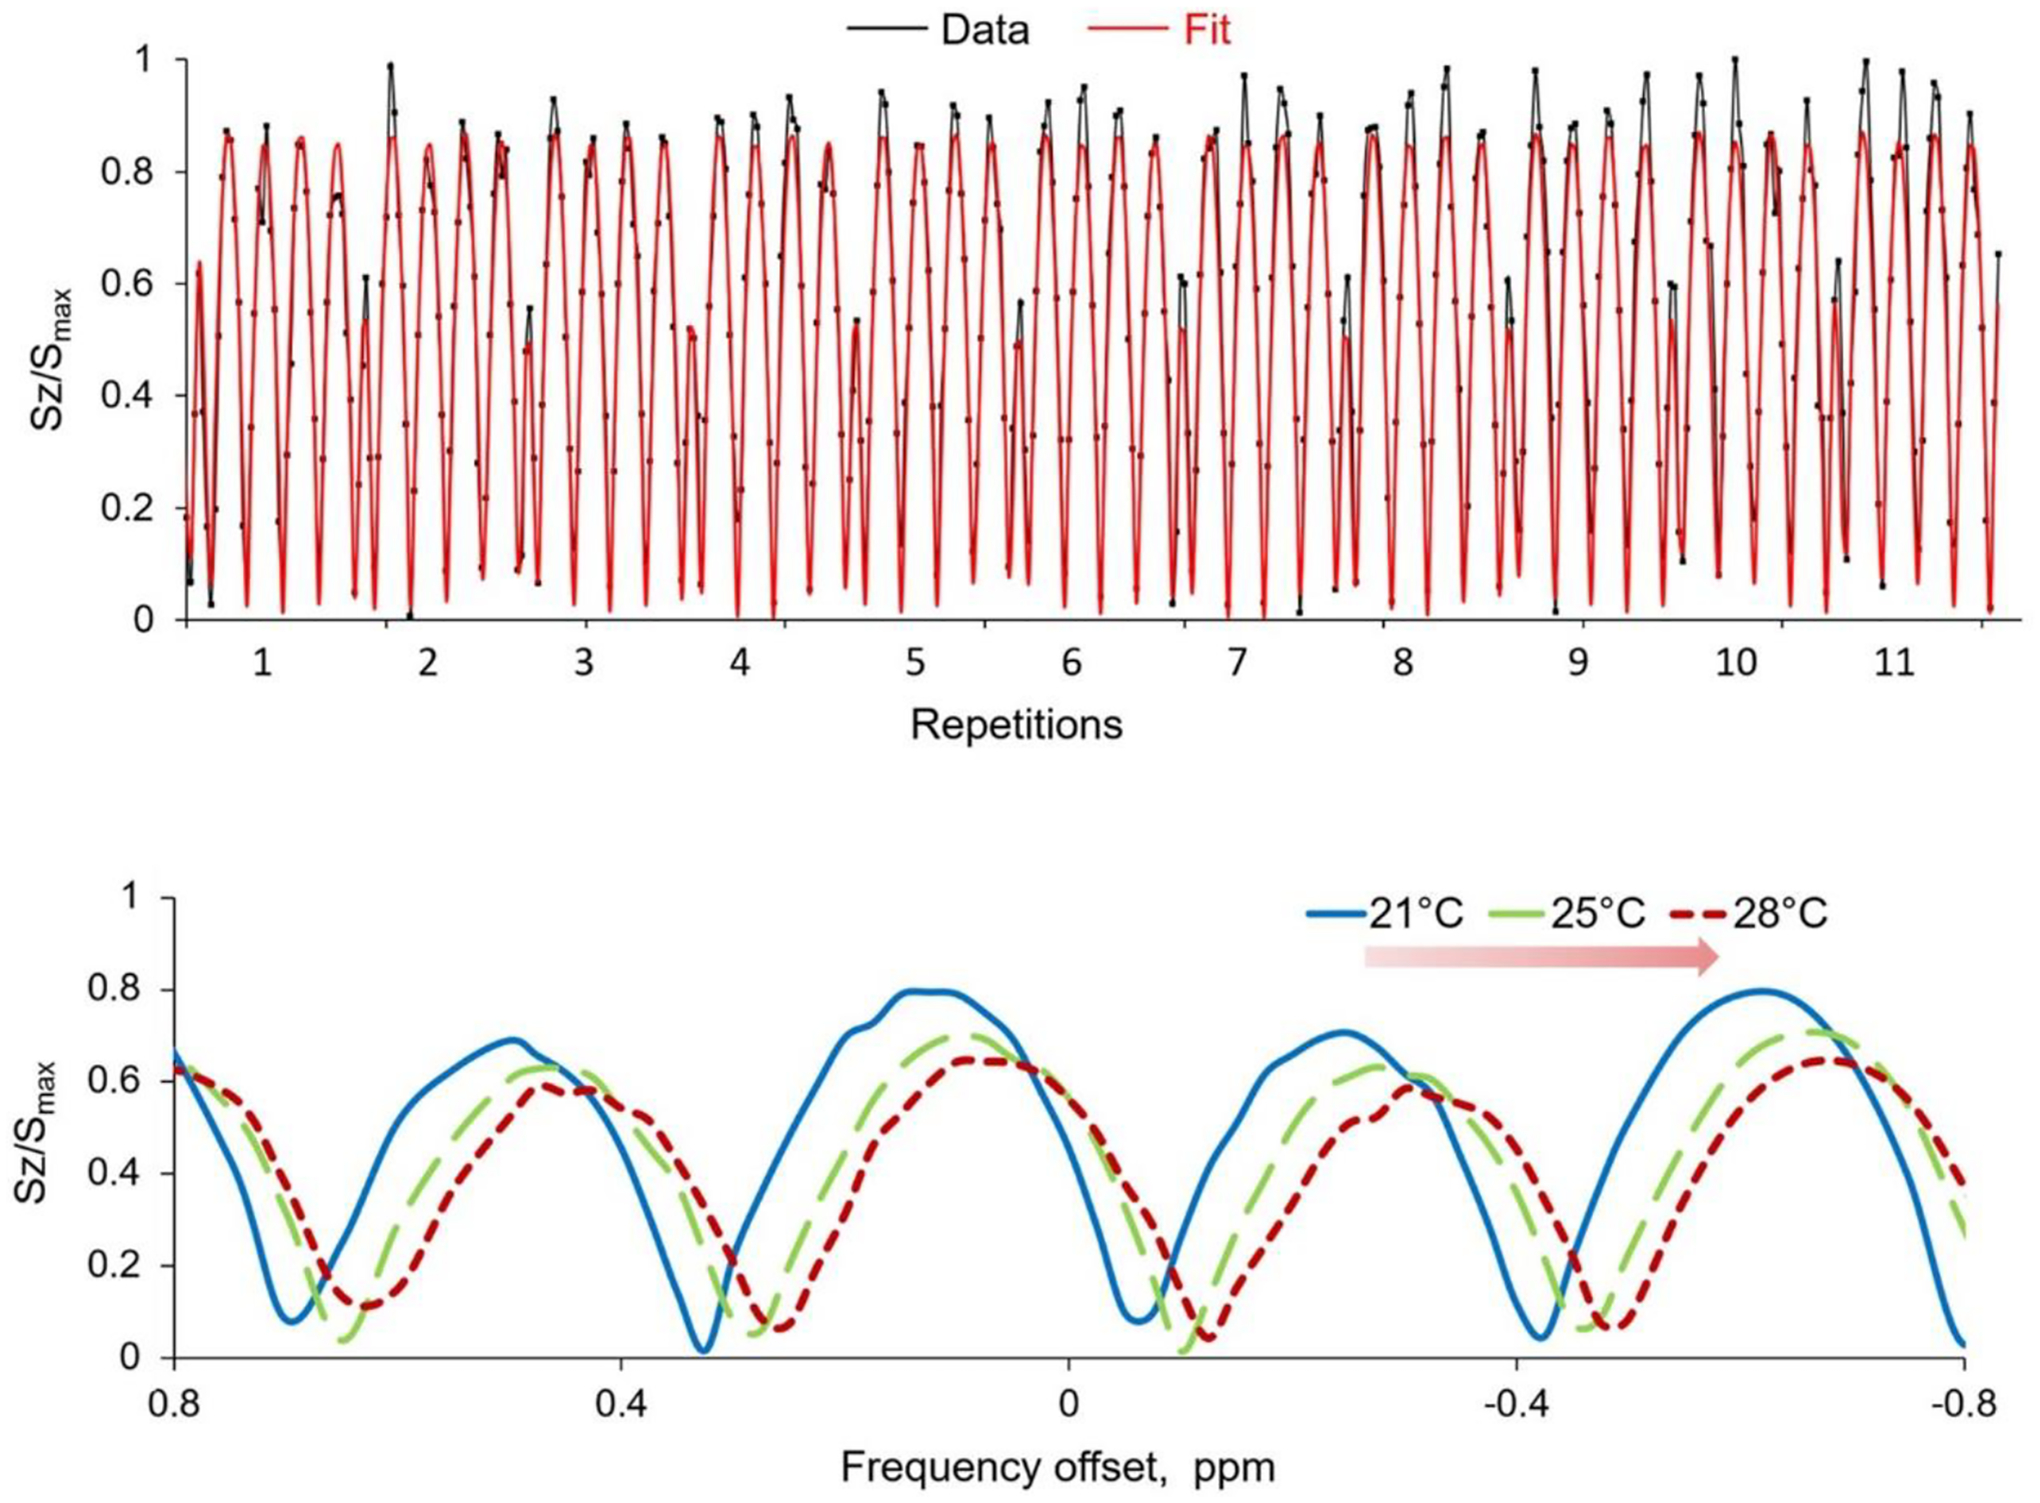
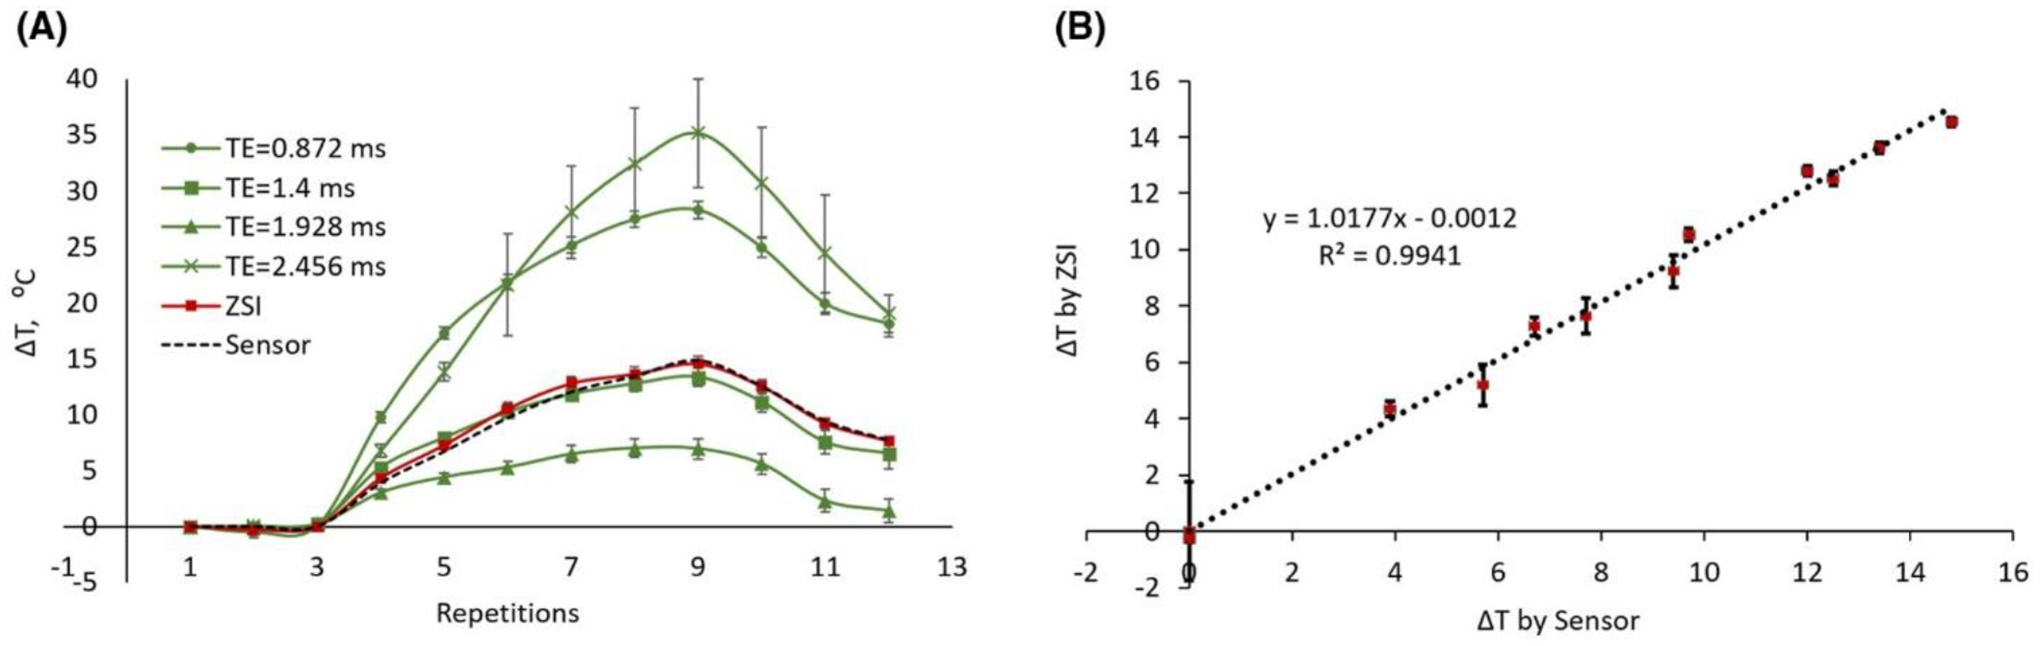
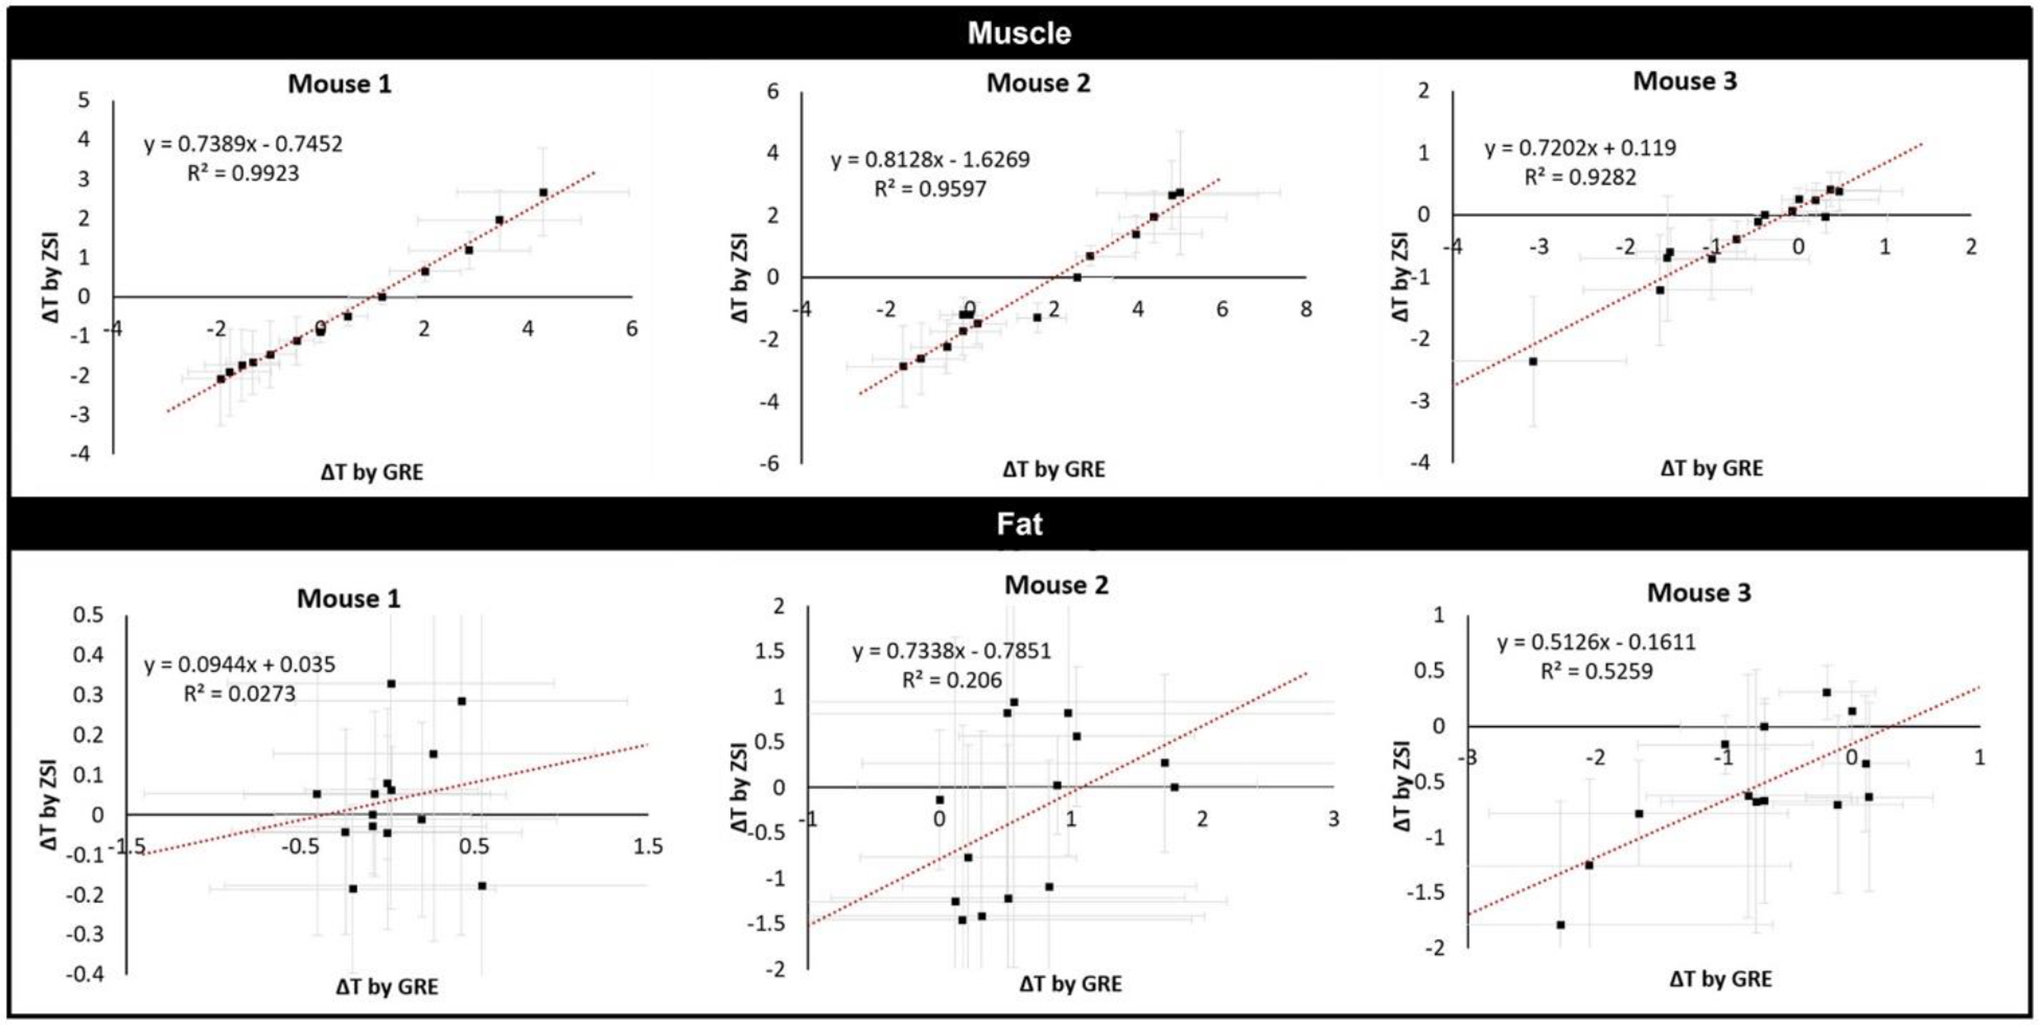
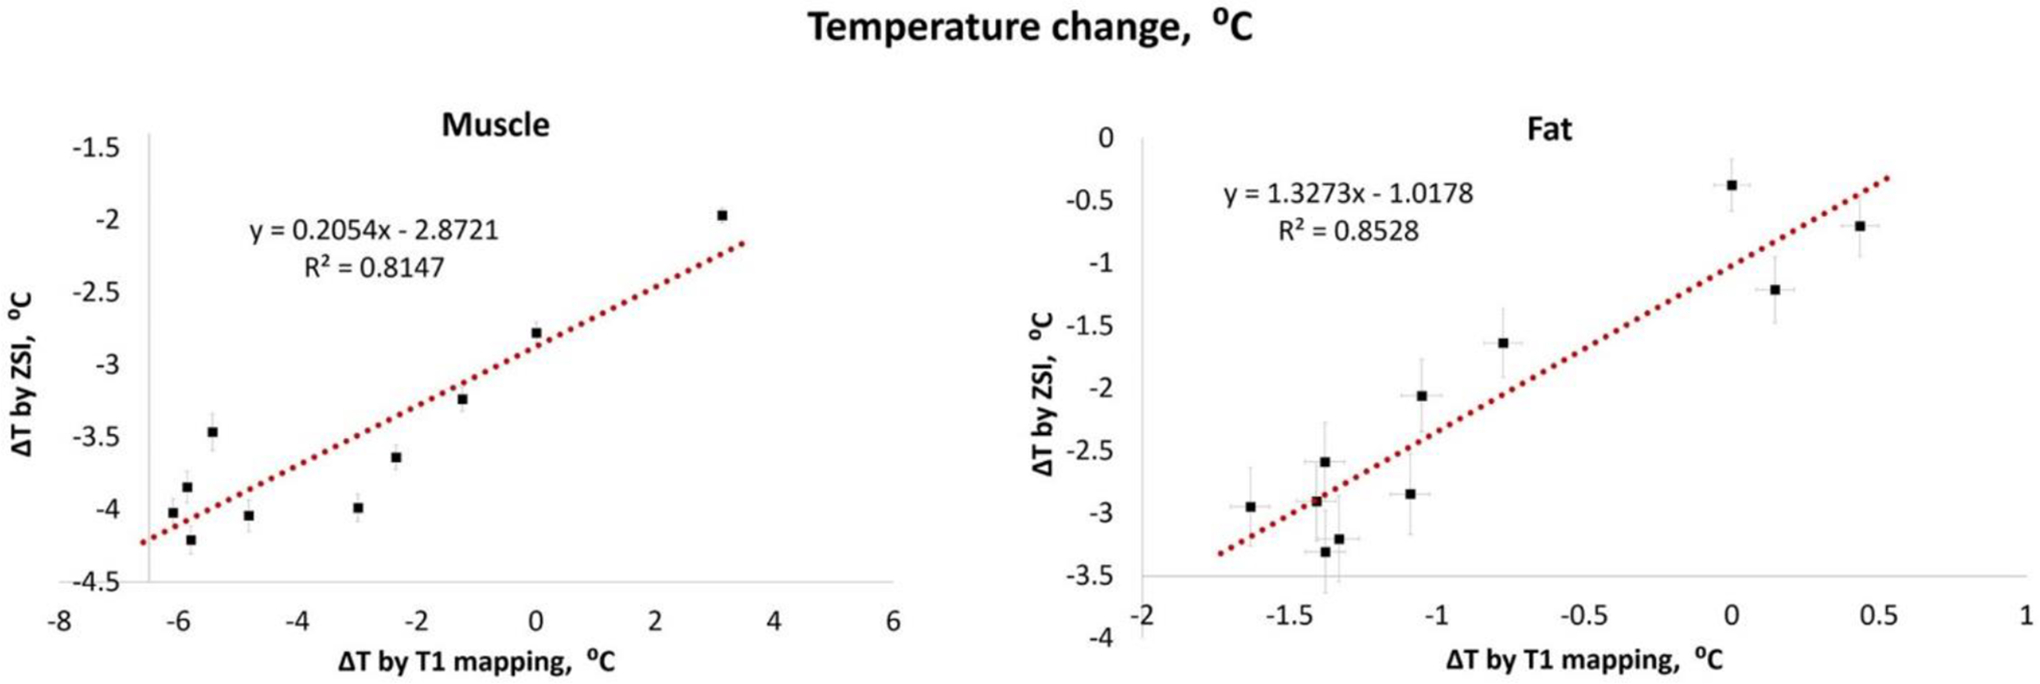
Results: During heating experiments, the water resonance shifted downfield, and by fitting the curve to a sine function it was possible to quantify the change in temperature. Results from Z-spectrum imaging correlated linearly with data from conventional MRI techniques like T1 mapping and phase differences from spoiled GRE.

Conclusion: Because the measurement is performed solely on magnitude images, the technique is independent of phase artifacts and is therefore applicable in mixed tissues (e.g., fat). We showed that Z-spectrum imaging can deliver reliable temperature change measurement in both muscular and fatty tissues.

Keywords: Z-spectrum; binomial pulse; fat; thermometry.


Figures

Figure 1.
Figure 1.
Scheme of the magnetization vector traveling during the binomial pulse. (A) At equilibrium, all spins are aligned along z. (B) After the first pulse along y-axis, the spins are tilted along the x-axis. (C) After the delay τ, the off-resonance spins fan out, depending on the frequency difference with respect to the central on-resonance frequency, which is stable. (D) The second pulse along –y, tilts back the spins on the yz plane. The more the magnetization is off-resonance, the more has fan out and produces less signal. The final pattern near the resonance is a sine function of chemical shift.
Figure 2.
Figure 2.
Diagram of the ZSI sequence with binomial pulse preparation. Two sinc pulses with opposite polarity and separated by a delay encode the phase accrue into the magnitude signal subsequently detected with a fast spin echo readout. The sequence is repeated at several offsets, resulting in a sinusoidal excitation profile, shown on the right of the figure.
Figure 3.
Figure 3.
Representative Z-spectra and fitting curves. Upper row: Z-spectra from a PBS phantom concatenated over several repetitions and normalized to the maximum value Smax. The signal (blue line) oscillates sinusoidally and is well fitted by a sine function (red line). Lower row: signal modulation over frequency offsets at different temperatures. The proton resonance frequency shifts downfield at increasing temperature, observed through the binomial-ZSI in PBS phantom heated by flowing hot air
Figure 4.
Figure 4.
Temperature changes in cream phantoms. (A) The measurement by ZSI (red line) followed the ground truth measurement by the thermal electrode directly inserted in the phantom (black dotted line). Phase differences from GRE data resulted in varying trends depending on the TE (green lines), with accurate results only when fat and water were in phase (squares). (B) The temperature from ZSI in the cream phantom correlated well with the sensor probe measurement.
Figure 5.
Figure 5.
Comparison of ZSI and GRE temperature measurements in cream under non-ideal field conditions. The distribution of temperature across the imaged slice as measured by ZSI is homogeneous, even when large B0 variations (2 ppm range) are present. The presence of the metallic tip of the sensor probe (masked out from image) also might contribute to the susceptibility artifacts degrading the GRE maps.
Figure 6.
Figure 6.
PRFS maps from healthy mouse. Comparison of proton resonance frequency shift measured by ZSI and phase difference from GRE sequences for an exemplary mouse undergoing thermal challenge. The body temperature measured by the rectal probe is indicated for each time point.
Figure 7.
Figure 7.
Correlations between GRE and ZSI. The temperature changes measured by the binomial ZSI and the phase difference from GREs correlated linearly in all studied mice in the muscle areas (top). Fat areas failed to return the same good correlations between techniques (bottom).
Figure 8.
Figure 8.
Comparison between ZSI and T1 mapping. The temperature changes derived from the binomial ZSI and T1 mapping linearly correlated in both muscle and fat regions of interest.

References

    1. Winter L, Oberacker E, Paul K, et al. Magnetic resonance thermometry: methodology, pitfalls and practical solutions. Int J Hyperthermia. 2016;32:63–75. - PubMed
    1. Grissom WA, Kerr AB, Holbrook AB, Pauly JM, Butts- Pauly K. Maximum linear- phase spectral-spatial radiofrequency pulses for fat-suppressed proton resonance frequency-shift MR thermometry. Magn Reson Med. 2009;62:1242–1250. - PMC - PubMed
    1. Yuan J, Mei CS, Madore B, McDannold NJ, Panych LP. Fast fat- suppressed reduced field-ofview temperature mapping using 2DRF excitation pulses. J Magn Reson. 2011;210:38–43. - PMC - PubMed
    1. Hofstetter LW, Yeo DT, Dixon WT, Kempf JG, Davis CE, Foo TK. Fat- referenced MR thermometry in the breast and prostate using IDEAL. J Magn Reson Imaging. 2012;36:722–732. - PubMed
    1. Diakite M, Odéen H, Todd N, Payne A, Parker DL. Toward real- time temperature monitoring in fat and aqueous tissue during magnetic resonance-guided high- intensity focused ultrasound using a three-dimensional proton resonance frequency T1 method. Magn Reson Med. 2014;72:178–187. - PMC - PubMed