

Ventricular Changes in Patients with Acute COVID-19 Infection: Follow-up of the World Alliance Societies of Echocardiography (WASE-COVID) Study
- PMID: 34752928
- PMCID: PMC8572036
- DOI: 10.1016/j.echo.2021.10.015
Ventricular Changes in Patients with Acute COVID-19 Infection: Follow-up of the World Alliance Societies of Echocardiography (WASE-COVID) Study
Abstract
Background: COVID-19 infection is known to cause a wide array of clinical chronic sequelae, but little is known regarding the long-term cardiac complications. We aim to report echocardiographic follow-up findings and describe the changes in left (LV) and right ventricular (RV) function that occur following acute infection.
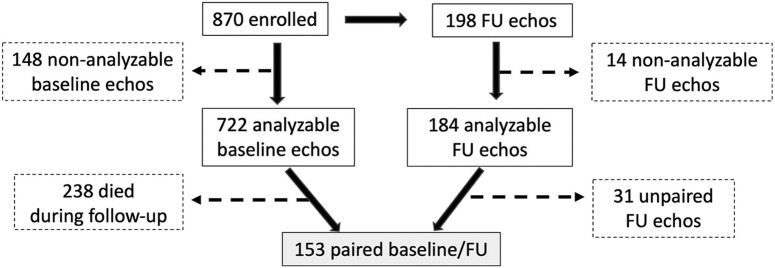
Methods: Patients enrolled in the World Alliance Societies of Echocardiography-COVID study with acute COVID-19 infection were asked to return for a follow-up transthoracic echocardiogram. Overall, 198 returned at a mean of 129 days of follow-up, of which 153 had paired baseline and follow-up images that were analyzable, including LV volumes, ejection fraction (LVEF), and longitudinal strain (LVLS). Right-sided echocardiographic parameters included RV global longitudinal strain, RV free wall strain, and RV basal diameter. Paired echocardiographic parameters at baseline and follow-up were compared for the entire cohort and for subgroups based on the baseline LV and RV function.
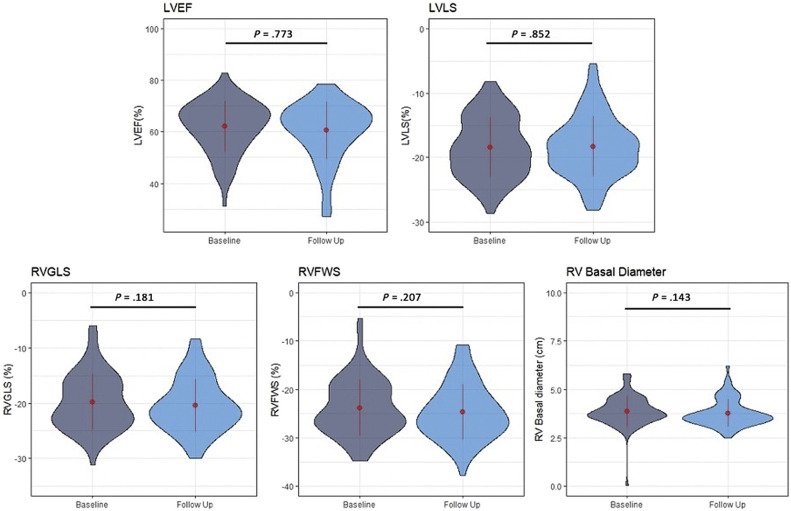
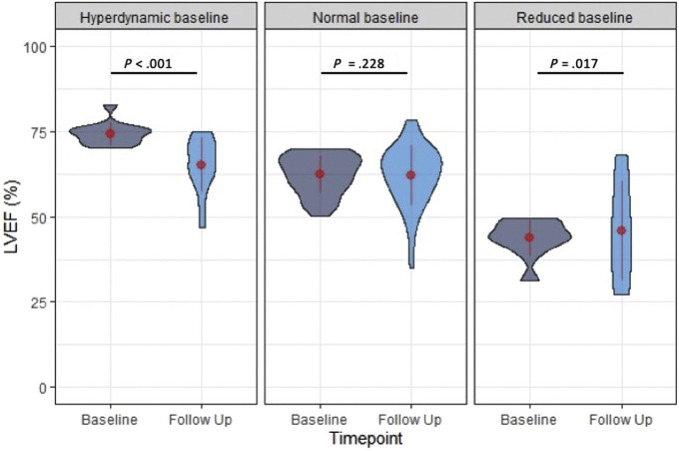
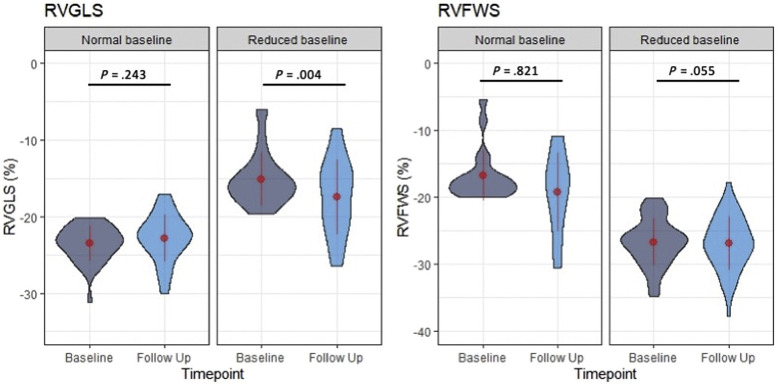
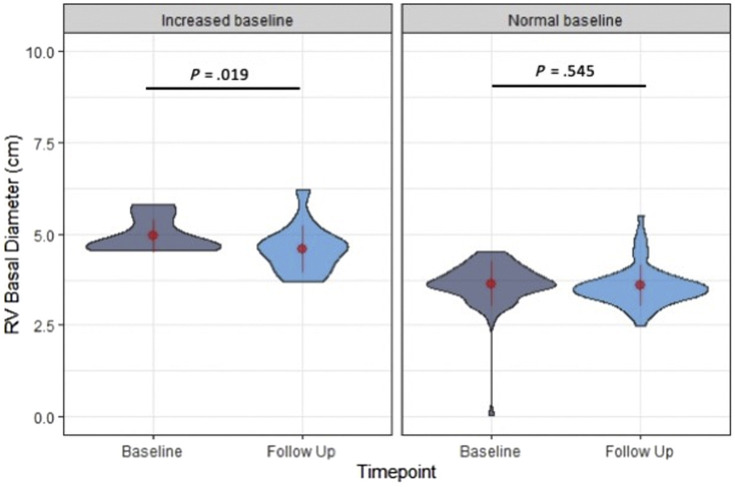
Results: For the entire cohort, echocardiographic markers of LV and RV function at follow-up were not significantly different from baseline (all P > .05). Patients with hyperdynamic LVEF at baseline (>70%), had a significant reduction of LVEF at follow-up (74.3% ± 3.1% vs 64.4% ± 8.1%, P < .001), while patients with reduced LVEF at baseline (<50%) had a significant increase (42.5% ± 5.9% vs 49.3% ± 13.4%, P = .02), and those with normal LVEF had no change. Patients with normal LVLS (<-18%) at baseline had a significant reduction of LVLS at follow-up (-21.6% ± 2.6% vs -20.3% ± 4.0%, P = .006), while patients with impaired LVLS at baseline had a significant improvement at follow-up (-14.5% ± 2.9% vs -16.7% ± 5.2%, P < .001). Patients with abnormal RV global longitudinal strain (>-20%) at baseline had significant improvement at follow-up (-15.2% ± 3.4% vs -17.4% ± 4.9%, P = .004). Patients with abnormal RV basal diameter (>4.5 cm) at baseline had significant improvement at follow-up (4.9 ± 0.7 cm vs 4.6 ± 0.6 cm, P = .019).
Conclusions: Overall, there were no significant changes over time in the LV and RV function of patients recovering from COVID-19 infection. However, differences were observed according to baseline LV and RV function, which may reflect recovery from the acute myocardial injury occurring in the acutely ill. Left ventricular and RV function tends to improve in those with impaired baseline function, while it tends to decrease in those with hyperdynamic LV or normal RV function.
Keywords: COVID-19; Echocardiography; Left ventricular function; Right ventricular function; WASE.
Copyright © 2021 American Society of Echocardiography. Published by Elsevier Inc. All rights reserved.
Figures

References
-
- Karagodin I., Carvalho Singulane C., Woodward G.M., Xie M., Tucay E.S., Tude Rodrigues A.C., et al. Echocardiographic correlates of in-hospital death in patients with acute COVID-19 infection: the World Alliance Societies of Echocardiography (WASE-COVID) study. J Am Soc Echocardiogr. 2021;34:819–830. - PMC - PubMed
-
- Lang R.M., Badano L.P., Mor-Avi V., Afilalo J., Armstrong A., Ernande L., et al. Recommendations for cardiac chamber quantification by echocardiography in adults: an update from the American Society of Echocardiography and the European Association of Cardiovascular Imaging. J Am Soc Echocardiogr. 2015;28:1–39.e14. - PubMed
-
- European Medicine Agency Guideline on missing data in confirmatory clinical trials. 2011:1-12. https://www.ema.europa.eu/en/missing-data-confirmatory-clinical-trials Available at:
Publication types
MeSH terms
Grants and funding
LinkOut - more resources
Full Text Sources
Medical
