. 2021 Nov 16;118(46):e2104721118.
doi: 10.1073/pnas.2104721118.

Preferential and persistent impact of acute HIV-1 infection on CD4+ iNKT cells in colonic mucosa

Affiliations

Preferential and persistent impact of acute HIV-1 infection on CD4+ iNKT cells in colonic mucosa

Dominic Paquin-Proulx et al. Proc Natl Acad Sci U S A. .

Abstract

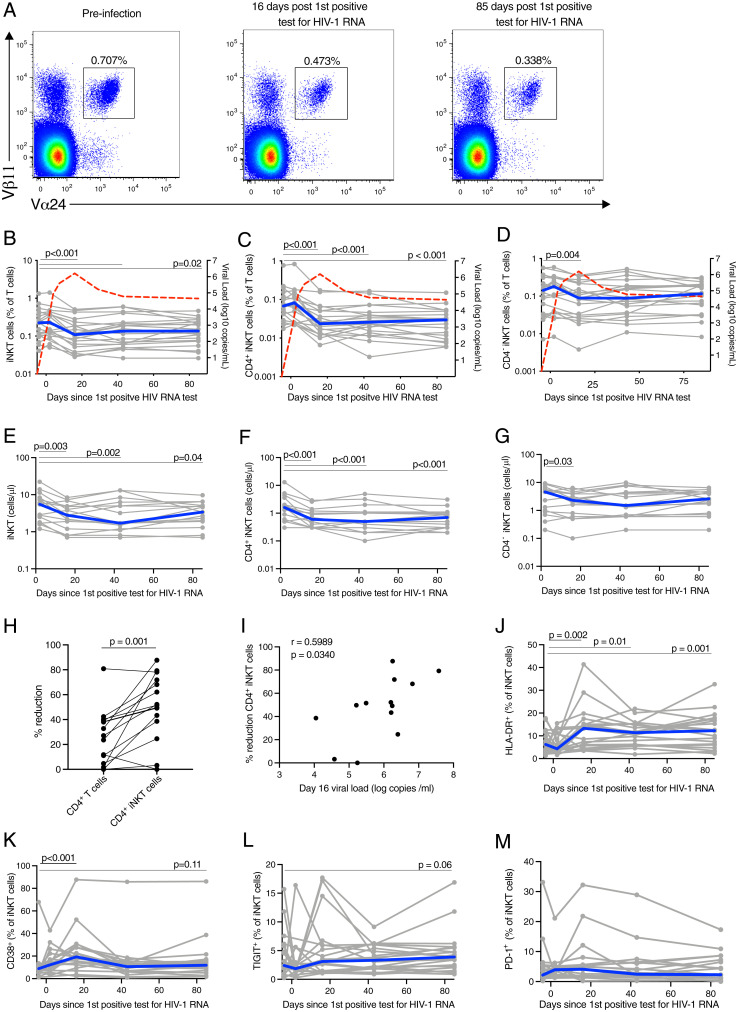
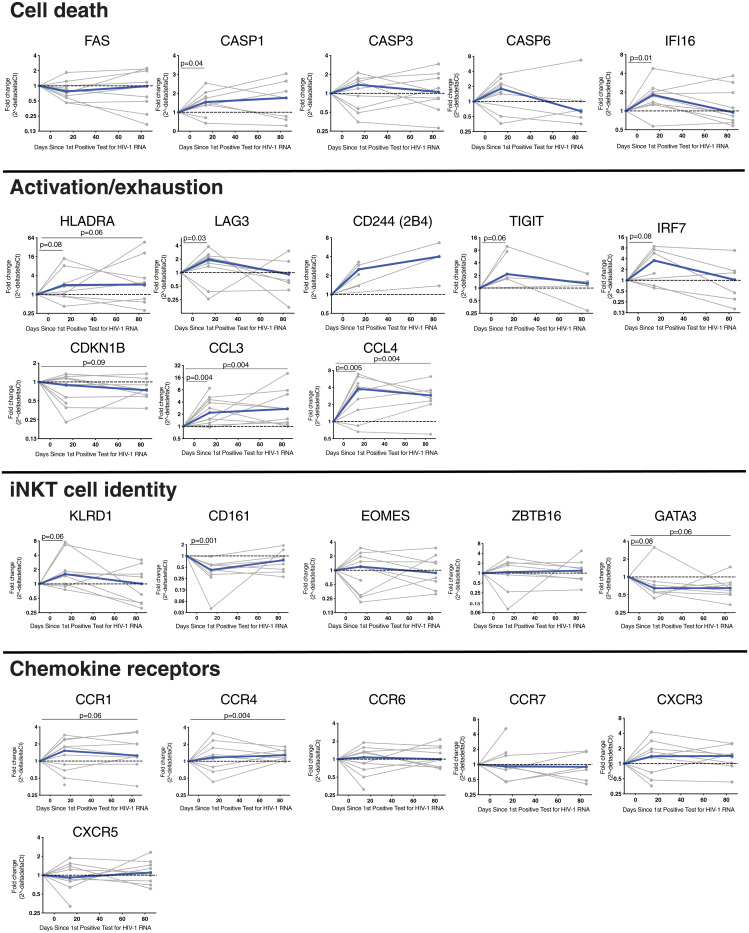
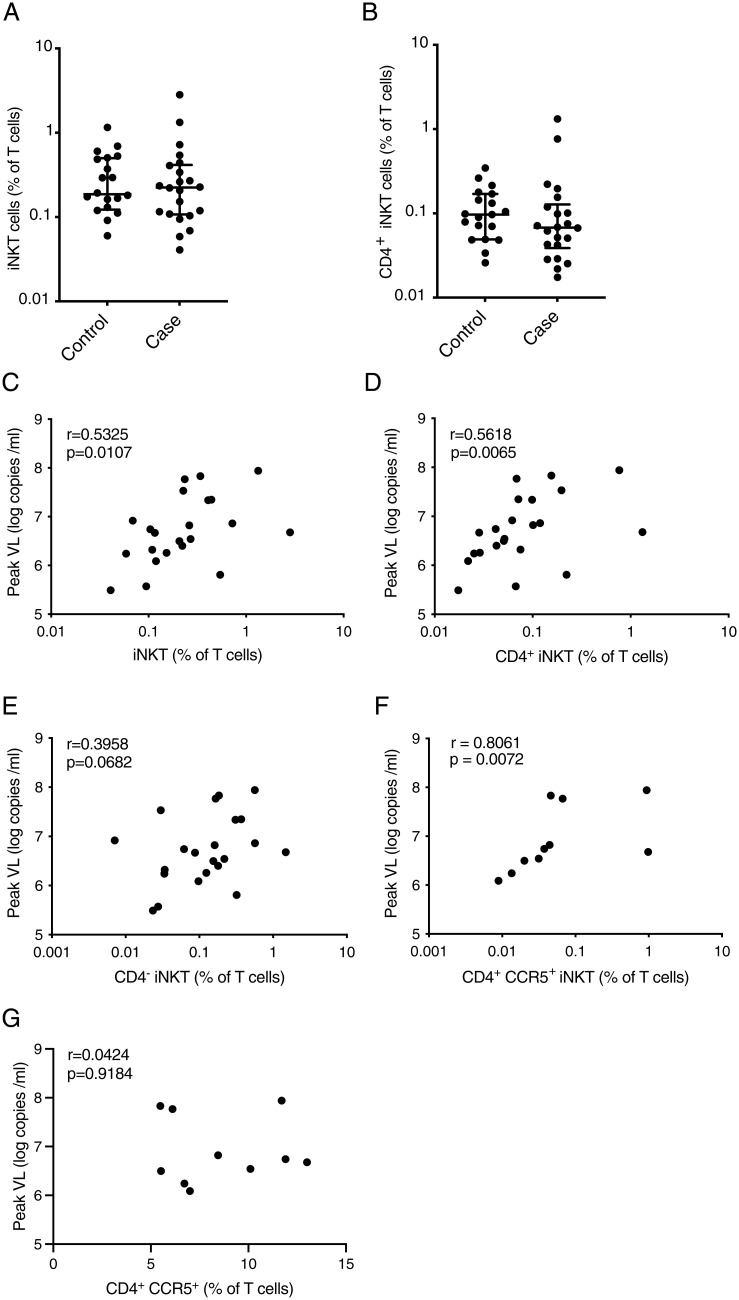
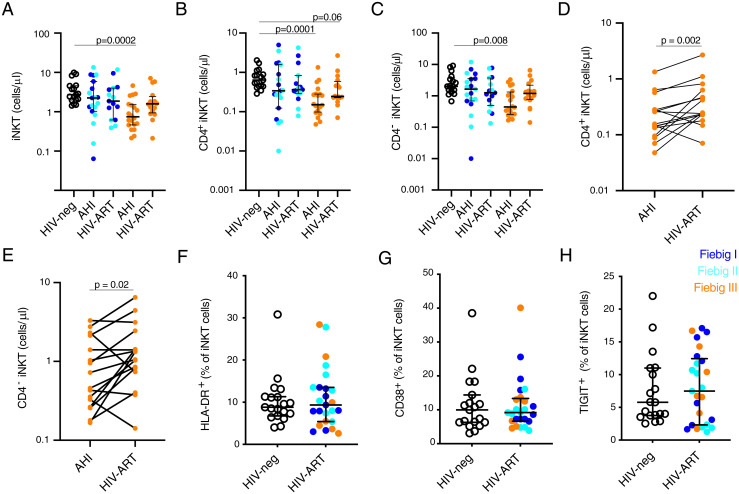
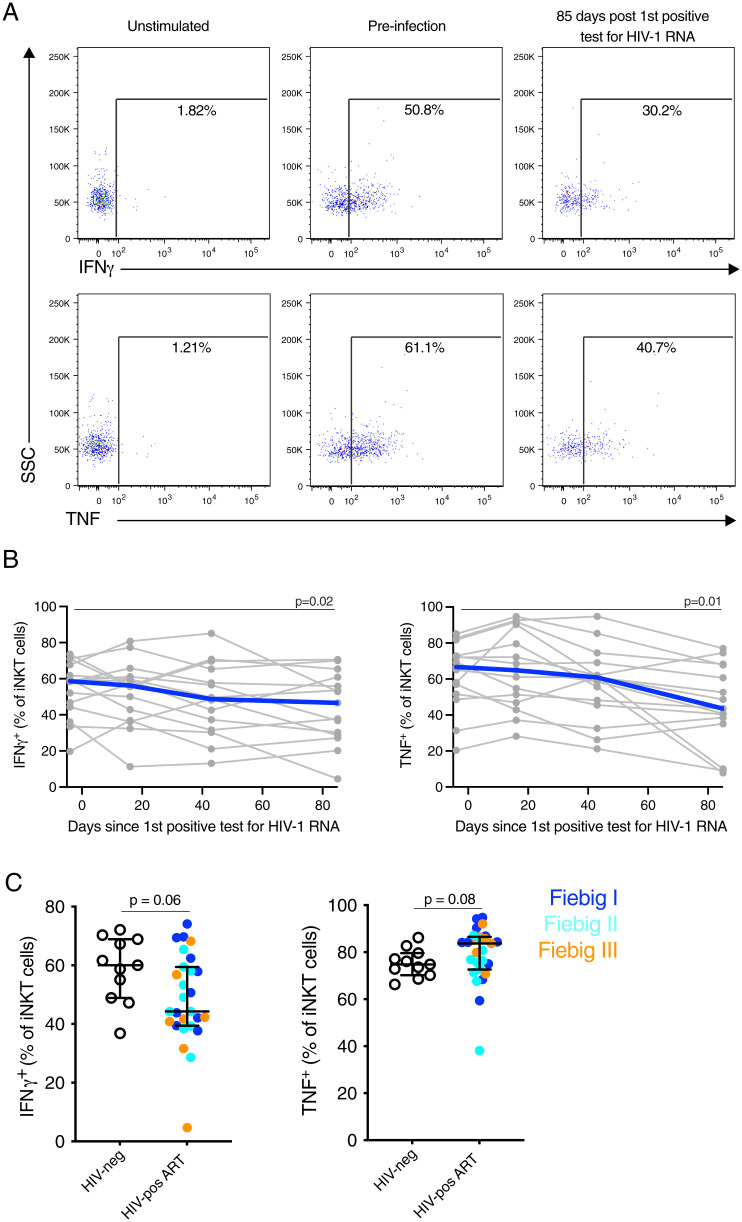
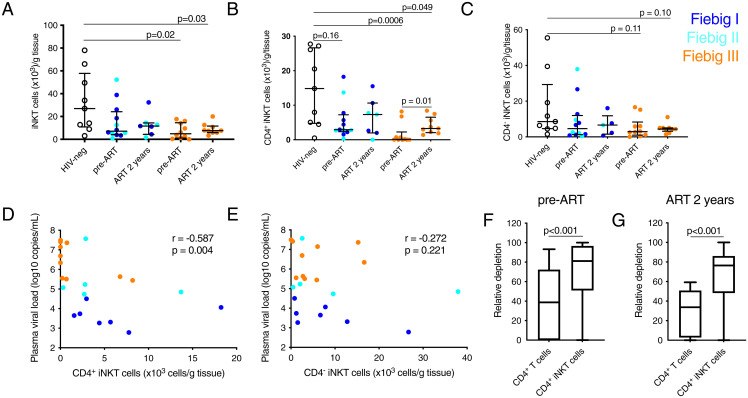
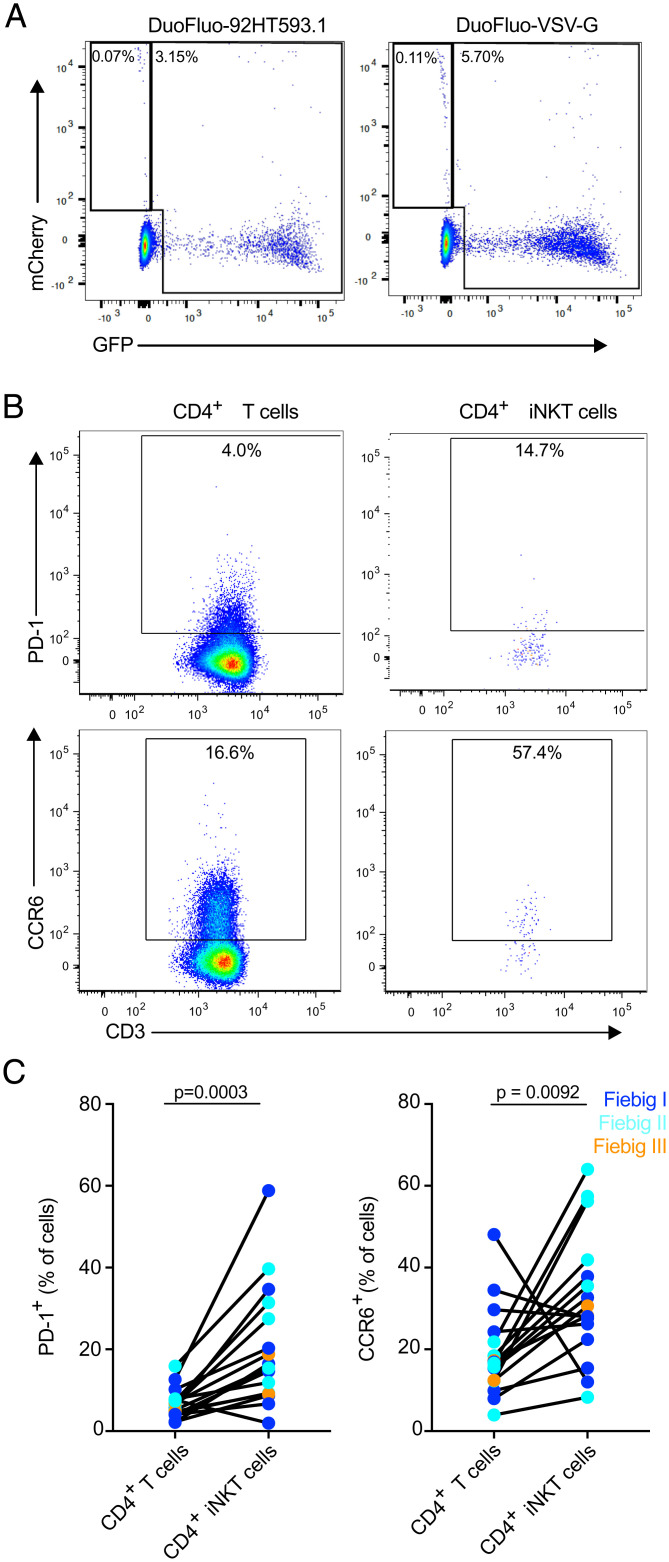
Acute HIV-1 infection (AHI) results in the widespread depletion of CD4+ T cells in peripheral blood and gut mucosal tissue. However, the impact on the predominantly CD4+ immunoregulatory invariant natural killer T (iNKT) cells during AHI remains unknown. Here, iNKT cells from peripheral blood and colonic mucosa were investigated during treated and untreated AHI. iNKT cells in blood were activated and rapidly depleted in untreated AHI. At the time of peak HIV-1 viral load, these cells showed the elevated expression of cell death-associated transcripts compared to preinfection. Residual peripheral iNKT cells suffered a diminished responsiveness to in vitro stimulation early into chronic infection. Additionally, HIV-1 DNA, as well as spliced and unspliced viral RNA, were detected in iNKT cells isolated from blood, indicating the active infection of these cells in vivo. The loss of iNKT cells occurred from Fiebig stage III in the colonic mucosa, and these cells were not restored to normal levels after initiation of ART during AHI. CD4+ iNKT cells were depleted faster and more profoundly than conventional CD4+ T cells, and the preferential infection of CD4+ iNKT cells over conventional CD4+ T cells was confirmed by in vitro infection experiments. In vitro data also provided evidence of latent infection in iNKT cells. Strikingly, preinfection levels of peripheral blood CD4+ iNKT cells correlated directly with the peak HIV-1 load. These findings support a model in which iNKT cells are early targets for HIV-1 infection, driving their rapid loss from circulation and colonic mucosa.

Keywords: ART; HIV-1; gut; iNKT cells; immune activation.


Conflict of interest statement

Competing interest statement: J.A. previously received honoraria from Merck, ViiV Healthcare, Roche, AbbVie, and Gilead for her participation in advisory meetings.

Figures

Fig. 1.
Fig. 1.
Peripheral blood CD4+ iNKT are reduced early in untreated AHI. (A) Representative flow plots showing the frequency of peripheral blood iNKT in acute, untreated HIV-1 infection. Frequency of peripheral blood iNKT (B), CD4+ iNKT (C), and CD4 iNKT (D) cells in acute, untreated HIV-1 infection. Individual subjects are shown in gray and the median in blue. The red line represents the median VL. Absolute cell count of peripheral blood iNKT (E), CD4+ iNKT (F), and CD4 iNKT (G) cells in acute, untreated HIV-1 infection. (H) Percentage of absolute cell count reduction for conventional CD4+ T cells and CD4+ iNKT cells. (I) Association between the VL at day 16 after the first HIV RNA–positive test and the percentage of CD4+ iNKT cell reduction. Expression of HLA-DR (J), CD38 (K), TIGIT (L), and PD-1 (M) by peripheral blood iNKT cells in acute, untreated HIV-1 infection. Time points sampled are indicated by the circles. n = 20 for all plots, except for E, F, G, and H in which n = 15 and I in which n =13.
Fig. 2.
Fig. 2.
Change in iNKT cell gene expression during AHI. Bulk iNKT cells from 10 subjects from preinfection, peak VL (corresponding to 16 d after the first positive HIV-1 RNA–positive test), and early chronic infection (corresponding to 85 d after the first positive HIV-1 RNA–positive test) were sorted. RNA was extracted, and complementary DNA was generated using target-specific primers. Gene expression was quantified by qPCR and compared to preinfection levels. Individual subjects are shown in gray and the median in blue. Time points sampled are indicated by the circles.
Fig. 3.
Fig. 3.
Preinfection levels of CD4+ iNKT cells are associated with the peak VL. Frequency of peripheral blood iNKT (A) and CD4+ iNKT cells (B) for individuals enrolled in RV217 that did not become HIV infected (n = 20) or became HIV infected (n = 22). The lines and whiskers represent the median and interquartile range, respectively. Associations between peripheral blood iNKT (C), CD4+ iNKT (D), and CD4 iNKT cells (E) preinfection frequencies and peak VL (n = 22). Associations between peripheral blood CD4+ CCR5+ iNKT cells (n = 10) (F) or conventional CD4+ CCR5+ T cells (n = 10) (G) frequency and peak VL.
Fig. 4.
Fig. 4.
Initiation of ART in AHI prevents the loss of peripheral blood CD4+ iNKT cells. Absolute cell count of peripheral blood iNKT (A), CD4+ iNKT (B), CD4 iNKT (C) cells in HIV-uninfected subjects (HIV-neg black, n = 17), Fiebig I (dark blue), Fiebig II (light blue), and Fiebig III (orange) HIV-infected individuals before (HIV acute, n = 39) and after 24 mo of ART (n = 31). Paired pre- and post-ART absolute CD4+ (D) and CD4 (E) iNKT cell count in study participants that initiated ART in Fiebig stage III (n = 16). Expression of HLA-DR (F), CD38 (G), and TIGIT (H) by peripheral blood iNKT cells in subjects that initiated ART in AHI (HIV uninfected n =19, Fiebig 1 n = 9, Fiebig II n = 9, and Fiebig III n = 7) 6 mo after ART. The lines and whiskers represent the median and interquartile range, respectively.
Fig. 5.
Fig. 5.
Initiation of ART in AHI prevents the reduction of cytokine production by iNKT cells. PBMCs were stimulated with PMA and Ionomycin for 6 h, and the production of IFN-γ and TNF by iNKT cell was evaluated by flow cytometry. (A) Representative flow plots showing production of IFNγ and TNF by iNKT cells pre- and 85 d post-first positive HIV-1 RNA positive test (early chronic) in untreated subjects. (B) IFN-γ (Left) and TNF (Right) production by iNKT cells before and in early chronic HIV-1 infection in untreated subjects (n = 15). Individual subjects are shown in gray and the median in blue. Time points sampled are indicated by the circles. (C) IFN-γ (Left) and TNF (Right) production by iNKT cells in subjects that initiated ART in AHI (HIV uninfected n = 11 [HIV-neg], Fiebig 1 n = 10, Fiebig II n = 10, and Fiebig III n = 7 [HIV-pos]) 6 mo after ART.
Fig. 6.
Fig. 6.
Colonic CD4+ iNKT cells are preferentially depleted in AHI and show limited recovery after ART. Absolute number of colonic iNKT cells (A), CD4+ iNKT cells (B), and CD4 iNKT cells (C) in HIV-uninfected subjects (HIV-neg black, n = 9), Fiebig I (dark blue) Fiebig II (light blue), and Fiebig III (orange) HIV-infected individuals before ART (n = 22) and after 2 y of ART (n = 16). The lines and whiskers represent the median and interquartile range, respectively. Associations between plasma VL and absolute numbers of colonic CD4+ (D) and CD4 (E) iNKT cells. The relative depletion of CD4+ T cells and CD4+ iNKT cells before ART (F) and after 2 y of ART (G) were calculated by comparing values for each HIV-infected individual to the median value for the HIV-uninfected group. The whiskers represent the minimum to maximum and the box represent the 25% percentile, median, and 75% percentile.
Fig. 7.
Fig. 7.
CD4+ iNKT cells express markers associated with the HIV reservoir. (A) Representative flow plots showing GFP and mCherry expression by iNKT cells 5 d postinfection with HIV-1 DuoFluo. Results are representative of three healthy donors. (B) Representative flow plots showing the expression of PD-1 and of CCR6 by peripheral blood and colonic CD4+ T cells and CD4+ iNKT cells. (C) Expression of markers enriched on latently infected cells, PD-1 (Left) and CCR6 (Right), by peripheral blood CD4+ T cells and CD4+ iNKT cells from ART-treated, HIV-infected individuals (n = 16).

References

    1. Van Rhijn I., Moody D. B., Donor unrestricted T cells: A shared human T cell response. J. Immunol. 195, 1927–1932 (2015). - PMC - PubMed
    1. Brennan P. J., Brigl M., Brenner M. B., Invariant natural killer T cells: An innate activation scheme linked to diverse effector functions. Nat. Rev. Immunol. 13, 101–117 (2013). - PubMed
    1. Van Kaer L., Parekh V. V., Wu L., Invariant natural killer T cells as sensors and managers of inflammation. Trends Immunol. 34, 50–58 (2013). - PMC - PubMed
    1. Cohen N. R., Garg S., Brenner M. B., Antigen presentation by CD1 lipids, T cells, and NKT cells in microbial immunity. Adv. Immunol. 102, 1–94 (2009). - PubMed
    1. Gumperz J. E., Miyake S., Yamamura T., Brenner M. B., Functionally distinct subsets of CD1d-restricted natural killer T cells revealed by CD1d tetramer staining. J. Exp. Med. 195, 625–636 (2002). - PMC - PubMed

Publication types