

Air-conditioning and the adaptation cooling deficit in emerging economies
- PMID: 34753905
- PMCID: PMC8578436
- DOI: 10.1038/s41467-021-26592-2
Air-conditioning and the adaptation cooling deficit in emerging economies
Erratum in
-
Author Correction: Air-conditioning and the adaptation cooling deficit in emerging economies.Nat Commun. 2022 Apr 7;13(1):1978. doi: 10.1038/s41467-022-29692-9. Nat Commun. 2022. PMID: 35393458 Free PMC article. No abstract available.
Abstract
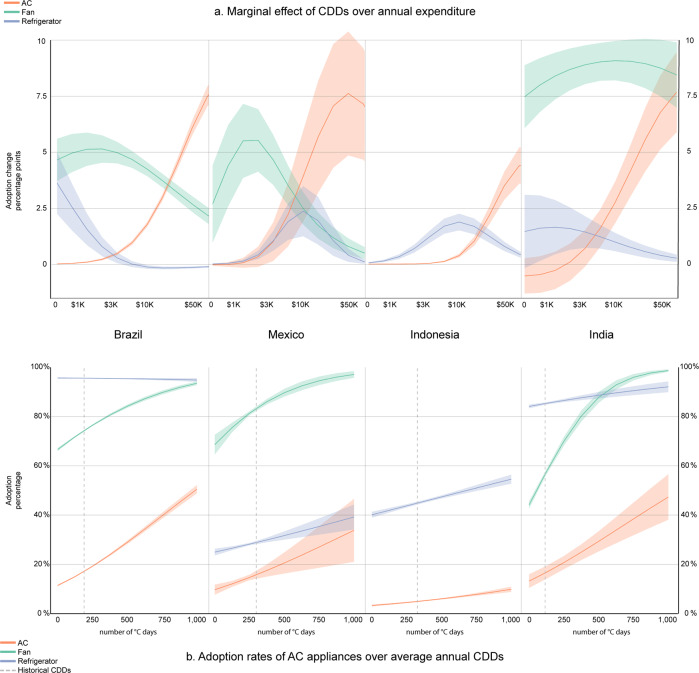
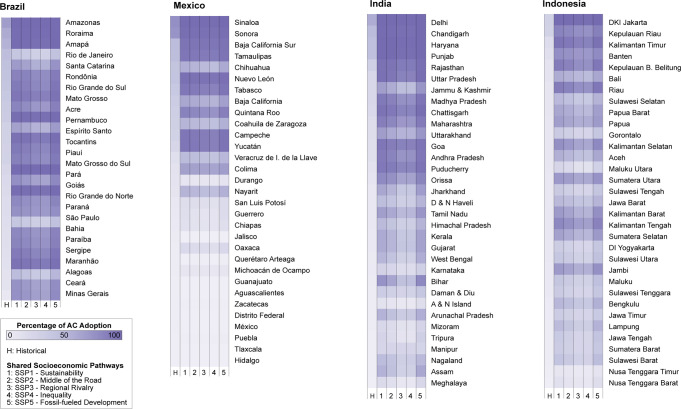
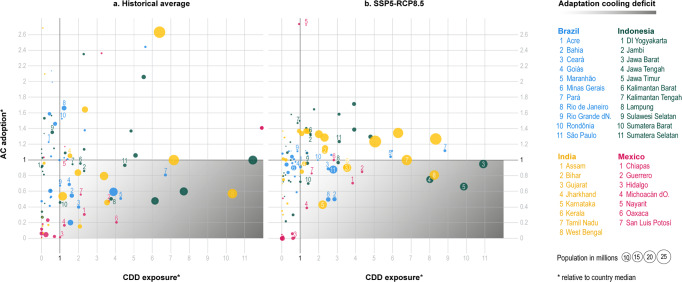
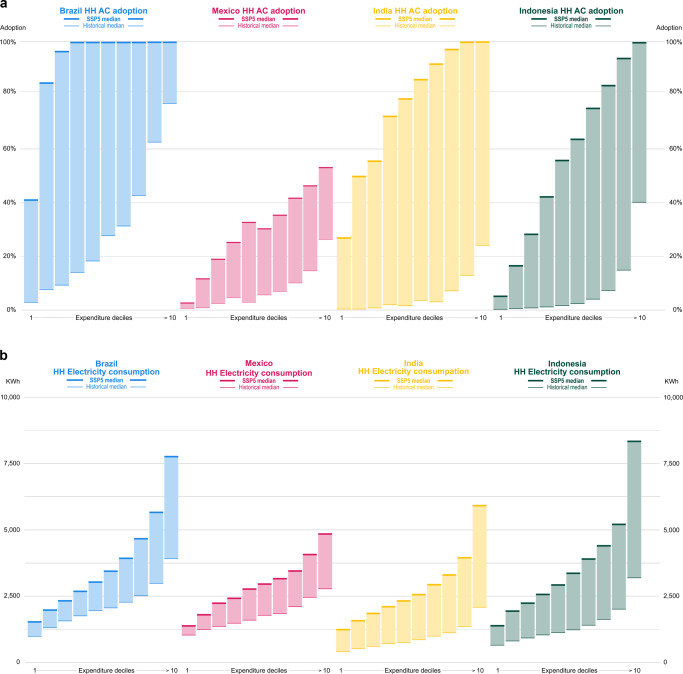
Increasing temperatures will make space cooling a necessity for maintain comfort and protecting human health, and rising income levels will allow more people to purchase and run air conditioners. Here we show that, in Brazil, India, Indonesia, and Mexico income and humidity-adjusted temperature are common determinants for adopting air-conditioning, but their relative contribution varies in relation to household characteristics. Adoption rates are higher among households living in higher quality dwellings in urban areas, and among those with higher levels of education. Air-conditioning is unevenly distributed across income levels, making evident the existence of a disparity in access to cooling devices. Although the adoption of air-conditioning could increase between twofold and sixteen-fold by 2040, from 64 to 100 million families with access to electricity will not be able to adequately satisfy their demand for thermal comfort. The need to sustain electricity expenditure in response to higher temperatures can also create unequal opportunities to adapt.
© 2021. The Author(s).
Conflict of interest statement
The authors declare no competing interests.
Figures

References
-
- Li, D., Yuan, J. & Kopp, R. Escalating global exposure to compound heat-humidity extremes with warming. Environ. Res. Lett. 15, 064003 (2020).
-
- Barreca A, Clay K, Deschenes O, Greenstone M, Shapiro JS. Adapting to climate change: the remarkable decline in the US temperature-mortality relationship over the Twentieth Century. J. Polit. Econ. 2016;124:105–159. doi: 10.1086/684582. - DOI
-
- Sivak M. Potential energy demand for cooling in the 50 largest metropolitan areas of the world: Implications for developing countries. Energy Policy. 2009;37:1382–1384. doi: 10.1016/j.enpol.2008.11.031. - DOI
-
- Khosla, R., Agarwal, A., Sircar, N. & Chatterjee, D. The what, why, and how of changing cooling energy consumption in India’ s urban households. Enviorn Res. Lett.16, 044035 (2021).
-
- Akpinar-ferrand E, Singh A. Modeling increased demand of energy for air conditioners and consequent CO 2 emissions to minimize health risks due to climate change in India. Environ. Sci. Policy. 2010;13:702–712. doi: 10.1016/j.envsci.2010.09.009. - DOI
Publication types
LinkOut - more resources
Full Text Sources
