. 2021 Nov 9;12(11):1068.
doi: 10.1038/s41419-021-04363-7.

Extracellular vesicles from hypoxia-preconditioned microglia promote angiogenesis and repress apoptosis in stroke mice via the TGF-β/Smad2/3 pathway

Affiliations

Extracellular vesicles from hypoxia-preconditioned microglia promote angiogenesis and repress apoptosis in stroke mice via the TGF-β/Smad2/3 pathway

Lin Zhang et al. Cell Death Dis. .

Abstract

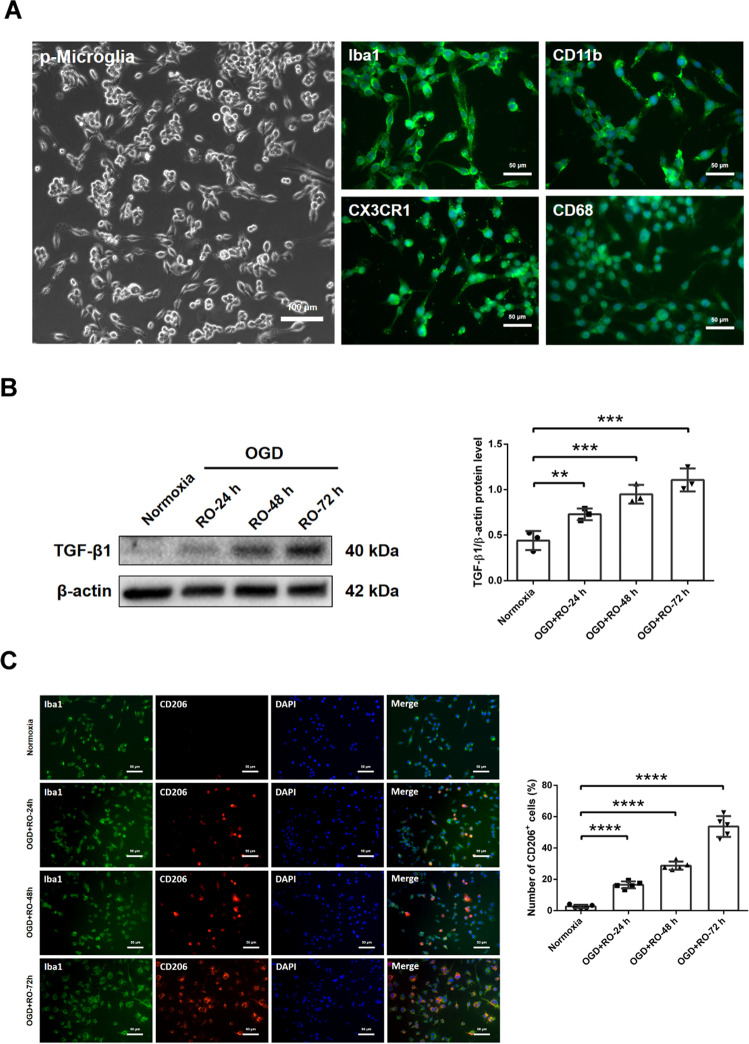
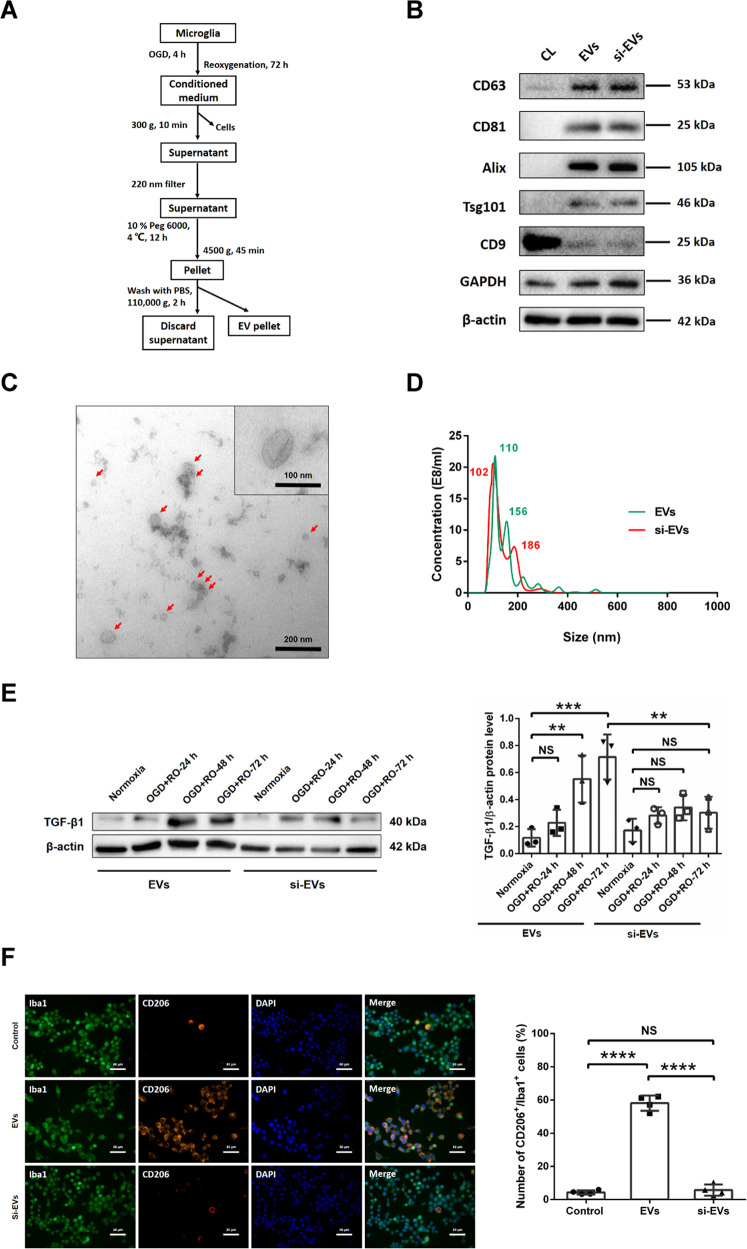
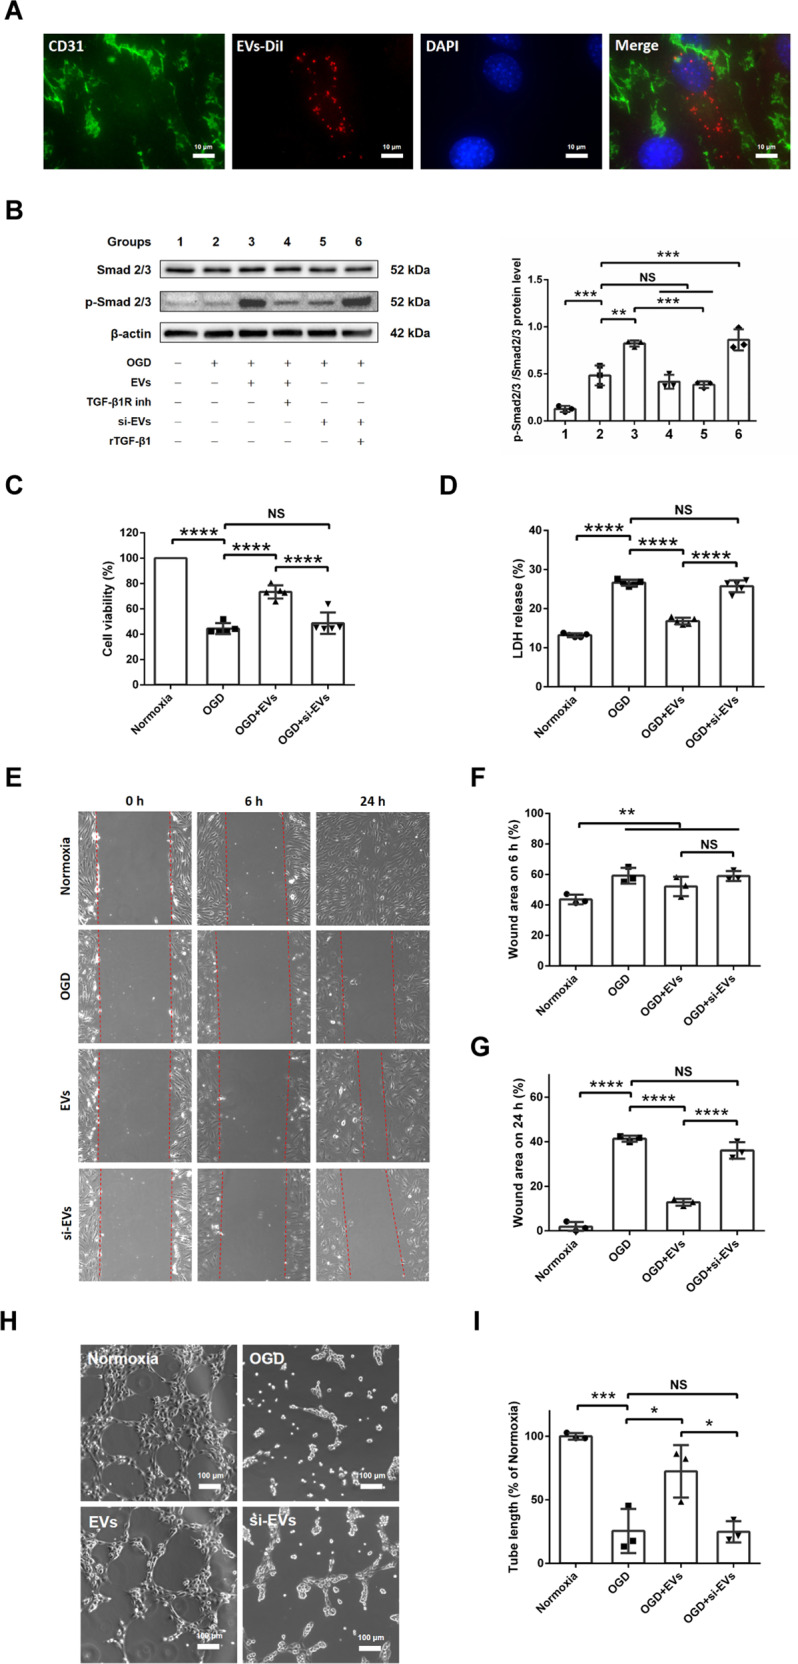
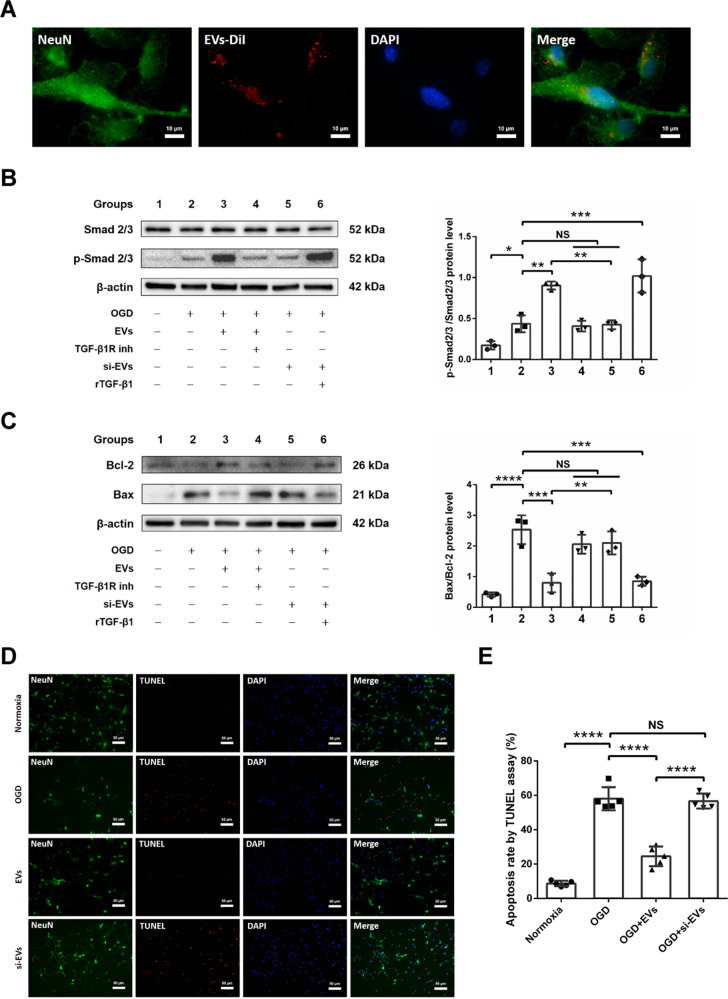
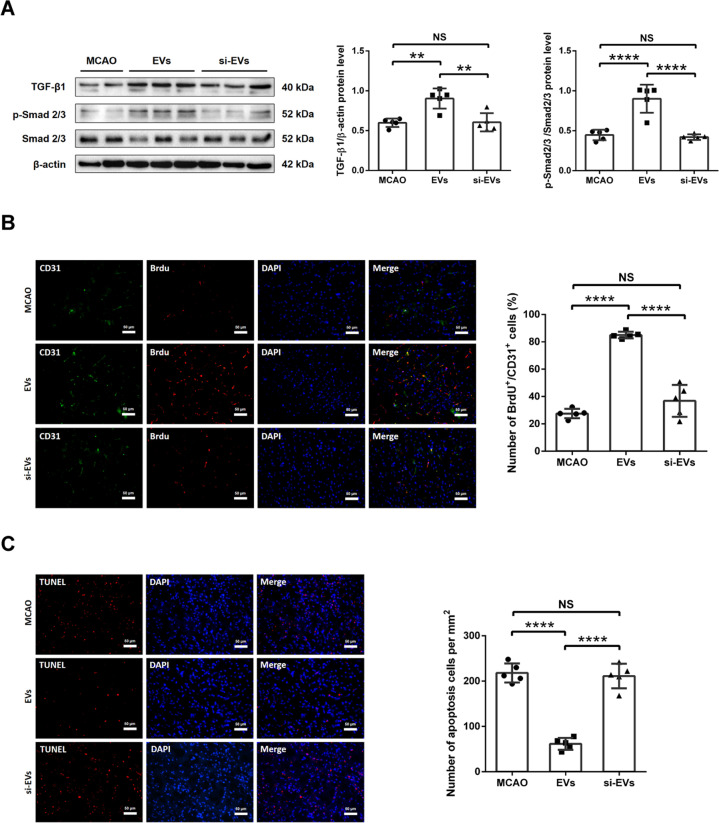
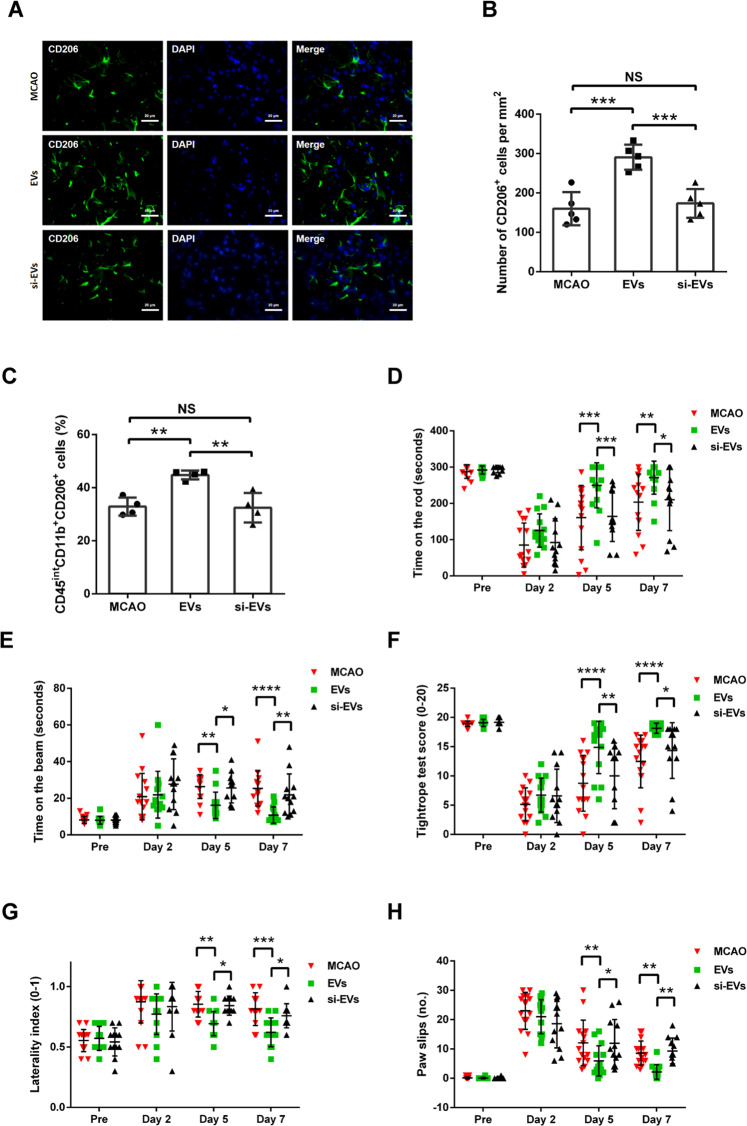
Systemic transplantation of oxygen-glucose deprivation (OGD)-preconditioned primary microglia enhances neurological recovery in rodent stroke models, albeit the underlying mechanisms have not been sufficiently addressed. Herein, we analyzed whether or not extracellular vesicles (EVs) derived from such microglia are the biological mediators of these observations and which signaling pathways are involved in the process. Exposing bEnd.3 endothelial cells (ECs) and primary cortical neurons to OGD, the impact of EVs from OGD-preconditioned microglia on angiogenesis and neuronal apoptosis by the tube formation assay and TUNEL staining was assessed. Under these conditions, EV treatment stimulated both angiogenesis and tube formation in ECs and repressed neuronal cell injury. Characterizing microglia EVs by means of Western blot analysis and other techniques revealed these EVs to be rich in TGF-β1. The latter turned out to be a key compound for the therapeutic potential of microglia EVs, affecting the Smad2/3 pathway in both ECs and neurons. EV infusion in stroke mice confirmed the aforementioned in vitro results, demonstrating an activation of the TGF-β/Smad2/3 signaling pathway within the ischemic brain. Furthermore, enriched TGF-β1 in EVs secreted from OGD-preconditioned microglia stimulated M2 polarization of residing microglia within the ischemic cerebral environment, which may contribute to a regulation of an early inflammatory response in postischemic hemispheres. These observations are not only interesting from the mechanistic point of view but have an immediate therapeutic implication as well, since stroke mice treated with such EVs displayed a better functional recovery in the behavioral test analyses. Hence, the present findings suggest a new way of action of EVs derived from OGD-preconditioned microglia by regulating the TGF-β/Smad2/3 pathway in order to promote tissue regeneration and neurological recovery in stroke mice.


Conflict of interest statement

The authors declare no competing interests.

Figures

Fig. 1
Fig. 1. In vitro oxygen−glucose deprivation (OGD) induces upregulation of TGF-β1 and stimulates M2 polarization in primary microglia cells.
A Phase-contrast images of primary microglia cells under bright-field microscopy and immunofluorescence stainings against the markers Iba1, CD11b, CX3CR1, and CD68 are shown. B Quantitative measurement of TGF-β1 protein expression in primary microglia exposed to 4 h of OGD followed by different reoxygenation (RO) periods (24, 48, and 72 h) using Western blot analysis normalized with the housekeeping protein β-actin. Microglia cultivated under standard cell culture conditions (Normoxia) served as control (n = 3). C Quantitative immunofluorescence staining of Iba1 (green) in primary microglia cells co-localized with CD206 (red), representing M2 polarization of microglia kept under standard cell culture condition or exposed to 4 h of OGD followed by different RO periods (24, 48, and 72 h) (n = 5). Data are expressed as mean ± SD, **p < 0.01, ***p < 0.001, ****p < 0.0001. OGD oxygen−glucose deprivation, RO reoxygenation.
Fig. 2
Fig. 2. Isolation and characterization of extracellular vesicles (EVs) from OGD-preconditioned microglia and TGF-β1 knockdown microglia.
A In the schematic diagram, EVs were enriched from the conditioned medium of OGD-preconditioned microglia or TGF-β1 knockdown microglia by the polyethylene glycol (PEG) method. B Western blot analysis of EVs against the exosomal markers CD63, CD81, Alix, Tsg101 and CD9 with GAPDH and β-actin serving as loading controls. Western blots were performed on total cell lysates (CL), EV lysates from OGD-preconditioned microglia (EVs) and TGF-β1 siRNA-transfected microglia (si-EVs). C Representative transmission electron microscopy (TEM) analysis from EVs enriched by the PEG method. The magnification of cup-shaped EVs is shown on the top right corner. D Nanoparticle tracking analysis (NTA) from enriched EVs and si-EVs groups depicting size distribution patterns with peaks at 110 nm (EVs) and 102 nm (si-EVs), respectively. E Quantitative analysis of TGF-β1 expression in EVs derived from non-hypoxic microglia or from OGD-preconditioned microglia with different reoxygenation (RO) periods (24, 48, and 72 h) (EV groups), and in EVs derived from TGF-β1 siRNA-transfected microglia with non-hypoxic precondition or with the aforementioned different hypoxic conditions using Western blot analysis normalized with the housekeeping protein β-actin (n = 3). F Quantitative analysis of M2 phenotype microglia (CD206+/Iba1+) rate by immunofluorescence staining in three groups: PBS vehicle control, aforementioned EV treatment paradigm and si-EV treatment (EVs or si-EVs derived from OGD-preconditioned microglia with 72 h RO). EV incubation promoted M2 polarization of microglia compared with control and si-EV groups (n = 4). Data are expressed as mean ± SD. NS no significance, **p < 0.01, ***p < 0.001, ****p < 0.0001. EVs extracellular vesicles, OGD oxygen−glucose deprivation, RO reoxygenation.
Fig. 3
Fig. 3. EVs derived from OGD-preconditioned microglia promote cell viability, migration, and angiogenesis in hypoxic bEnd.3 cells via the TGF-β/Smad2/3 pathway.
A EVs labeled with DiI (red) were taken up into the cytoplasm of CD31+ (green) bEnd.3 endothelial cells. B Quantitative analysis of Smad2/3 and p-Smad2/3 expression associated with the TGF-β/Smad2/3 pathway using Western blot analysis normalized with the housekeeping protein β-actin (n = 3) in the six groups: group 1 (treatment with drug solvent under normoxic condition), group 2 (OGD/RO treatment with drug solvent), group 3 (1 μg/ml EV incubation during OGD/RO, EVs derived from OGD-preconditioned microglia), group 4 (2 µM TGF-β1 receptor inhibitor treatment in group 3), group 5 (1 μg/ml si-EV incubation during OGD/RO, si-EVs derived from OGD-preconditioned plus TGF-β1 siRNA-transfected microglia), and group 6 (10 ng/ml recombinant TGF-β1 treatment in group 5). C Cell viability was analyzed in endothelial cells exposed to 16 h of OGD followed by 24 h of RO using the MTT assay in the four groups: normoxia, OGD control, EV treatment and si-EV treatment during OGD/RO (n = 5). Cells incubated in the normoxia control group were defined as 100% cell survival. D OGD-induced cell toxicity was further assessed in the lactate dehydrogenase (LDH) release assay (n = 5). E Representative photos under bright-field microscopy analyzing cell migration after 0, 6 and 24 h after scratch injury in the aforementioned experimental groups. F, G Quantitative analysis of the scratch assay from (E) at 6 h (F) and at 24 h (G) after the scratch (n = 3). H Representative photos of the tube formation assay at 6 h after seeding the endothelial cells on the matrigel. I Quantitative analysis of tube branch length indicating promoted angiogenesis in hypoxic endothelial cells after the various treatment paradigms (n = 3). Data are expressed as mean ± SD. NS no significance, *p < 0.05, **p < 0.01, ***p < 0.001 and ****p < 0.0001. EVs extracellular vesicles, OGD oxygen−glucose deprivation, RO reoxygenation, LDH lactate dehydrogenase.
Fig. 4
Fig. 4. EVs repress neuronal apoptosis in hypoxic cortical neurons via the TGF-β/Smad2/3 pathway.
A EVs labeled with DiI (red) were taken up into the cytoplasm of NeuN+ (green) primary cortical neurons. B Quantitative analysis of Smad2/3 and p-Smad2/3 expression associated with the TGF-β/Smad2/3 pathway using Western blot analysis normalized with the housekeeping protein β-actin (n = 3) in the six groups: group 1 (treatment with drug solvent under normoxic condition), group 2 (OGD/RO treatment with drug solvent), group 3 (1 μg/ml EV incubation during OGD/RO, EVs derived from OGD-preconditioned microglia), group 4 (2 µM TGF-β1 receptor inhibitor treatment in group 3), group 5 (1 μg/ml si-EV incubation during OGD/RO, si-EVs derived from OGD-preconditioned plus TGF-β1 siRNA-transfected microglia), and group 6 (10 ng/ml recombinant TGF-β1 treatment in group 5). C Quantitative analysis of anti-apoptotic protein Bcl-2 and pro-apoptotic protein Bax expression using Western blot analysis normalized with the housekeeping protein β-actin in the same six groups (n = 3). D, E Quantitative analysis of apoptotic cell (red) rate in primary cortical neurons (NeuN, green) by TUNEL staining (red) in the four groups: normoxia, OGD control, EV treatment and si-EV treatment during OGD and RO (n = 5). Data are expressed as mean ± SD. *p  <  0.05, **p < 0.01, ***p < 0.001, and ****p < 0.0001. EVs extracellular vesicles, OGD oxygen−glucose deprivation, RO reoxygenation, Bcl-2 B-cell lymphoma 2 protein, Bax Bcl-2-associated X protein.
Fig. 5
Fig. 5. EV administration induces angiogenesis and diminishes neuronal apoptosis in the mouse middle cerebral artery occlusion (MCAO) stroke model.
After exposing to 60 min of MCAO, mice were treated with PBS (MCAO control) or intravenously treated with EV administration at the beginning of the reperfusion and at 6 h later with another EV administration. A Quantitative analysis of TGF-β1, p-Smad2/3 and Smad2/3 expression in MCAO mice, MCAO mice treated with EVs and MCAO mice treated with si-EVs by Western blot analysis of the ischemic hemisphere. Western blot was normalized with the housekeeping protein β-actin (n = 5). B Quantitative analysis of proliferating cell (BrdU, red) rate in endothelial cells (CD31, green) of the ischemic striatum at post-MCAO day 7 by immunofluorescence staining in the aforementioned groups. EV administration increases the number of proliferating endothelial cells (BrdU+/CD31+) in the ischemic striatum compared with the si-EV group (n = 5). C Quantitative analysis of apoptotic cell (red) per mm2 in the ischemic striatum at post-MCAO day 7 by TUNEL staining in the same groups (n = 5). Data are expressed as mean ± SD. **p < 0.01, ***p < 0.001, and ****p < 0.0001. EVs extracellular vesicles, MCAO middle cerebral artery occlusion, PBS phosphate-buffered saline, BrdU 5-bromo-2ʹ-deoxyuridine, TUNEL terminal deoxynucleotidyl transferase dUTP nick end labeling.
Fig. 6
Fig. 6. Delivery of TGF-β1-enriched EVs augments M2 polarization of microglia and mitigates postischemic motor coordination impairment in stroke mice.
A, B Quantitative analysis of M2 polarization of microglia cells (CD206, green) in the ischemic striatum at post-MCAO day 7 by immunofluorescence staining in the three groups: MCAO control, MCAO with EV treatment, and MCAO with si-EV treatment. EV infusion increases M2 polarization rates of resident microglial cells in the ischemic striatum compared with the si-EVs group (n = 5). C At post-MCAO day 7, flow cytometry of ischemic hemispheres showing a significant increase of M2 microglial cells (CD45intCD11b+CD206+) in the EV treatment group compared to the MCAO control and the MCAO si-EV treatment group (n = 4). Delivery of EVs reduces postischemic motor coordination impairment. Motor coordination was evaluated using the rotarod test (D), balance beam test (E), tightrope test (F), corner turn test (G), and paw slips recording (H) 1 day before stroke (pre) as well as 2, 5 and 7 days after stroke. All animals were accordingly trained before the induction of stroke in order to ensure proper test performance (n = 5). Data are expressed as mean ± SD. NS no significance, *p < 0.05, **p < 0.01, and ***p < 0.001. EVs extracellular vesicles, MCAO middle cerebral artery occlusion.

References

    1. Lipton P. Ischemic cell death in brain neurons. Physiol Rev. 1999;79:1431–568. - PubMed
    1. Gan Y, Liu Q, Wu W, Yin JX, Bai XF, Shen R, et al. Ischemic neurons recruit natural killer cells that accelerate brain infarction. Proc Natl Acad Sci USA. 2014;111:2704–9. - PMC - PubMed
    1. Shi K, Tian DC, Li ZG, Ducruet AF, Lawton MT, Shi FD. Global brain inflammation in stroke. Lancet Neurol. 2019;18:1058–66. - PubMed
    1. De Meyer SF, Denorme F, Langhauser F, Geuss E, Fluri F, Kleinschnitz C. Thromboinflammation in stroke brain damage. Stroke. 2016;47:1165–72. - PubMed
    1. Qin C, Zhou LQ, Ma XT, Hu ZW, Yang S, Chen M, et al. Dual functions of microglia in ischemic stroke. Neurosci Bull. 2019;35:921–33. - PMC - PubMed

Publication types

Substances