. 2021 Nov 9;11(1):21946.
doi: 10.1038/s41598-021-01505-x.

Gene-corrected p.A30P SNCA patient-derived isogenic neurons rescue neuronal branching and function

Affiliations

Gene-corrected p.A30P SNCA patient-derived isogenic neurons rescue neuronal branching and function

Peter A Barbuti et al. Sci Rep. .

Abstract

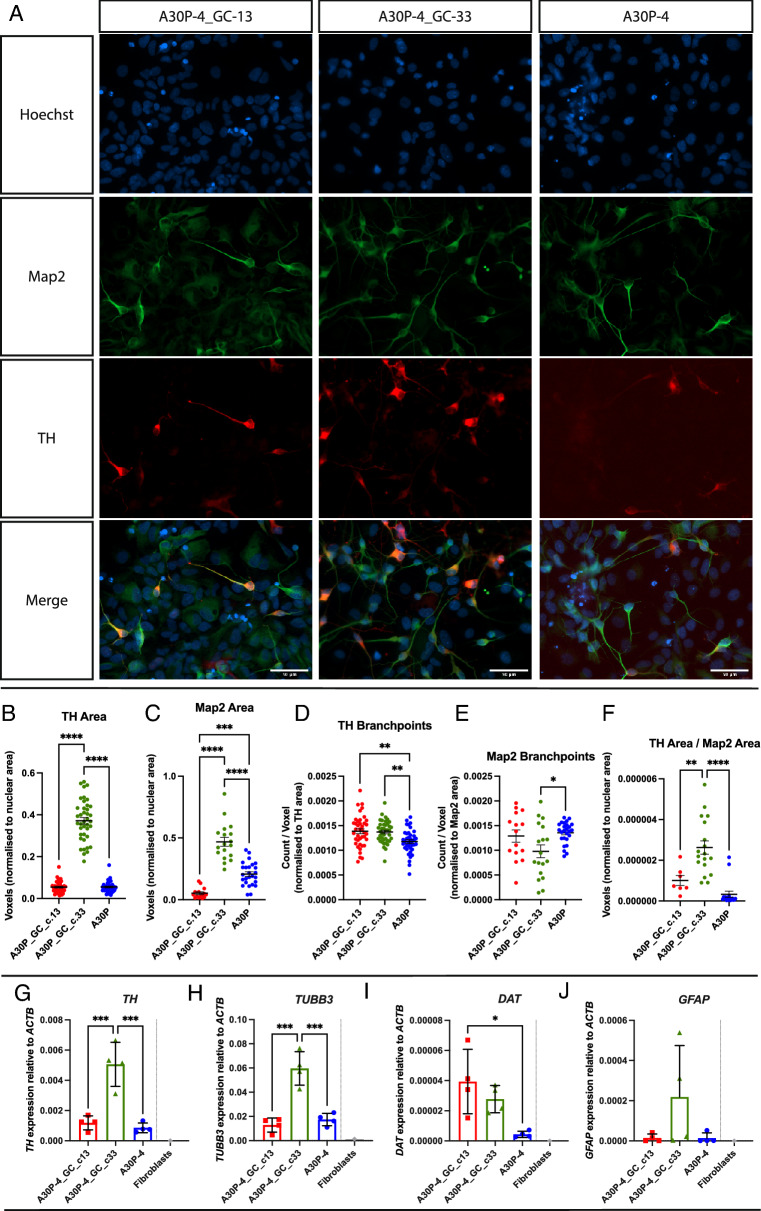
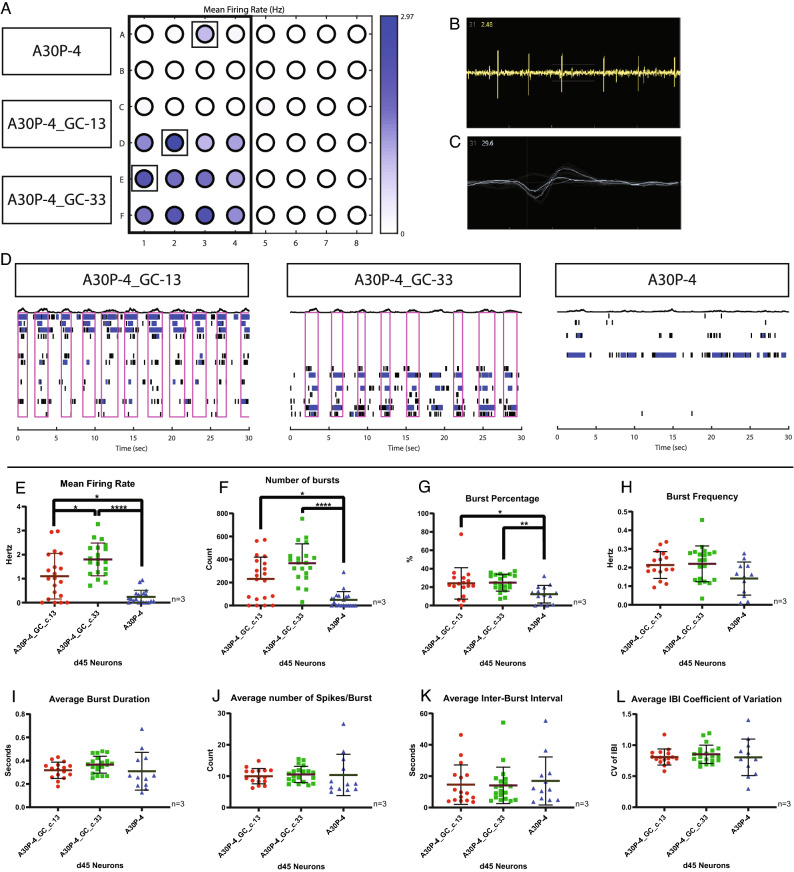
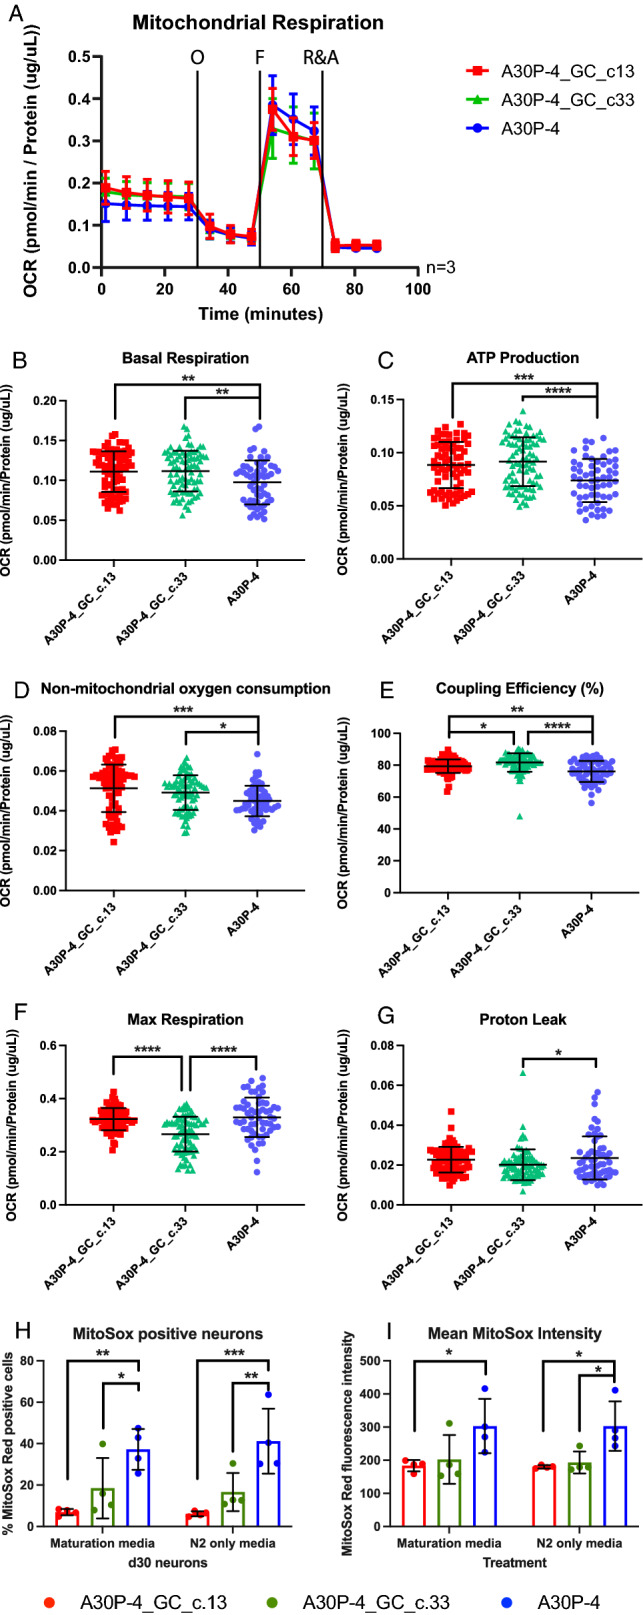
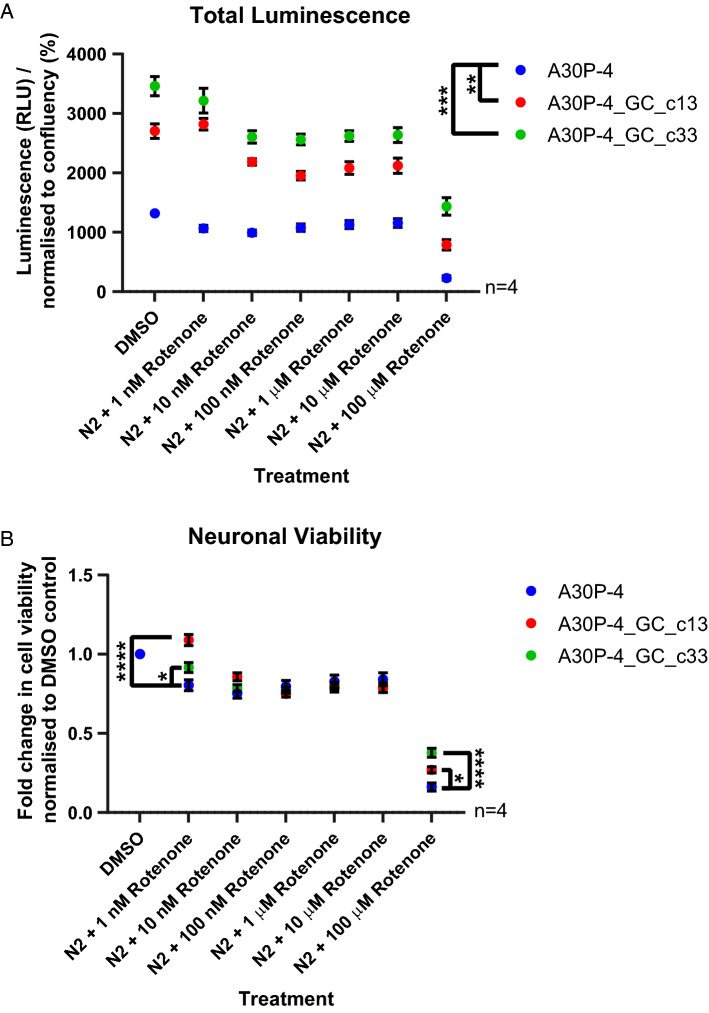
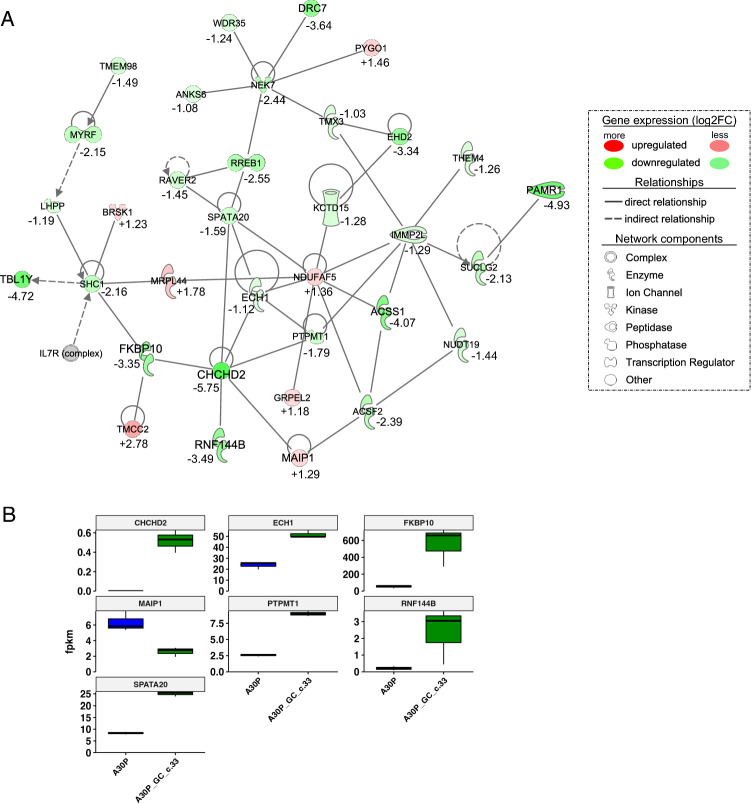
Parkinson's disease (PD) is characterised by the degeneration of A9 dopaminergic neurons and the pathological accumulation of alpha-synuclein. The p.A30P SNCA mutation generates the pathogenic form of the alpha-synuclein protein causing an autosomal-dominant form of PD. There are limited studies assessing pathogenic SNCA mutations in patient-derived isogenic cell models. Here we provide a functional assessment of dopaminergic neurons derived from a patient harbouring the p.A30P SNCA mutation. Using two clonal gene-corrected isogenic cell lines we identified image-based phenotypes showing impaired neuritic processes. The pathological neurons displayed impaired neuronal activity, reduced mitochondrial respiration, an energy deficit, vulnerability to rotenone, and transcriptional alterations in lipid metabolism. Our data describes for the first time the mutation-only effect of the p.A30P SNCA mutation on neuronal function, supporting the use of isogenic cell lines in identifying image-based pathological phenotypes that can serve as an entry point for future disease-modifying compound screenings and drug discovery strategies.


Conflict of interest statement

The authors declare no competing interests.

Figures

Figure 1
Figure 1
Morphometric analysis of TH network in d30 neurons. (A) Representative image of a maximum intensity projection of a Z-stack fluorescently labelled with Map2 and TH antibodies. Images taken using a ×25 objective, scale bar is 50 μM. Identification and quantification of parameters: (B) TH Area, (C) Map2 Area, (D) TH Branchpoints, (E) Map2 Branchpoints and (F) TH Area/Map2 Area were determined. Four biological replicates were used for the analysis with a minimum of six Z-stacks analysed by replicate. The graphs displayed in columns show data points that refer to the average data per Z-stack. Relative quantification in the patient-derived neurons of: (G) TH, (H) TUBB3, (I) GFAP and (J) DAT. Each data point refers to 4 independent biological replicates. For all statistical analyses, an ordinary one-way ANOVA was performed with Tukey’s post-hoc multiple comparison test. Graphs (BF) were plotted as mean ± SEM; graphs (GJ) were plotted as mean ± SD. *p < 0.05, ** p < 0.01, ***p < 0.001 ****p < 0.0001.
Figure 2
Figure 2
Multi-electrode array neuronal recording of d55 neurons. (A) Representative image showing the plate layout of recorded neurons with a heat map displaying the mean firing rate. (B) Representative example of a Waveform profile, (C) Representative example of a Spike plot, (D) Representative image of a raster plot profile, taken from the well highlighted in (A). Spike and burst metric parameters identified from the MEA recording: (E) Mean Firing Rate, (F) Number of Bursts, (G) Burst Percentage, (H) Burst Frequency, (I) Average Burst Duration, (J) Number of Spikes/Burst, (K) Average Inter-Burst Interval, and (L) Average Inter-Burst Interval (IBI) Co-efficient of Variation. Three biological replicates were used in the analysis with a minimum of six technical replicates per recording. The graphs displayed in columns show individual values that refer to the average data of each well, with each well composed of 16 electrodes. For all statistical analyses, a non-parametric Kruskal–Wallis test was performed using the Dunn’s post hoc multiple comparison test. All graphs were plotted as mean ± SD. *p < 0.05, **p < 0.01, ****p < 0.0001.
Figure 3
Figure 3
Mitochondrial dysfunction in neurons carrying the p.A30P SNCA mutation. (A) Bioenergetic profile showing oxygen consumption rate (OCR) of patient-derived neurons following a mitochondrial stress test under basal conditions and following the treatments of the ATP synthase inhibitor oligomycin (O, 1 µM), the oxidative phosphorylation uncoupler FCCP (F, 500 nM), and the electron transport chain inhibitors rotenone (Complex I) and antimycin A (Complex III) (R&A, 10 µM). The cumulative OCR profile is shown in ventral midbrain neurons differentiated for 30 days (n = 3). The rates of (B) Basal Respiration, (C) ATP production, (D) Non-mitochondrial respiration, (E) Coupling efficiency, (F) Maximum Respiration and (G) Proton Leak are shown. Each data point refers to individual values taken from a minimum of 12 replicates from 3 independent biological replicates. Mitochondrial reactive oxygen species measured by flow cytometry of (H) MitoSOX Red positive cells and (I) MitoSOX Red mean fluorescence intensity in typical “maturation” culture medium or with N2 media (without B27, trophic factors and antioxidants) for 4 h (n = 4). Each data point refers to 4 independent biological replicates. For all statistical analyses, an ordinary one-way ANOVA was performed using the Tukey post-hoc multiple comparison test. All graphs were plotted as mean ± SD. *p < 0.05, ** p < 0.01, ***p < 0.001 ****p < 0.0001.
Figure 4
Figure 4
Neuronal viability after rotenone treatment. (A) Total luminescence profile of the patient-derived neurons using the CellTiter-Glo Luminescent Cell Viability Assay with increasing concentrations of rotenone treatment performed over 16 h. The neurons were differentiated for 40 days, a minimum of eight technical replicates were used per analysis with four biological replicates performed. For statistical analysis, an ordinary one-way ANOVA was performed using the Tukey post-hoc multiple comparison test. (B) Fold change in cell viability of patient-derived neurons normalised to DMSO control. A two-way ANOVA was used with a Turkey’s post-hoc multiple-comparison test. All graphs were plotted as mean ± SEM. *p < 0.05, **p < 0.01, ***p < 0.001 ****p < 0.0001.
Figure 5
Figure 5
Functional analysis of gene expression networks performed by Ingenuity Pathway Analysis (IPA). (A) Changes in genes associated with lipid metabolism. Genes in green are upregulated, and in red downregulated in respect to the patient neurons compared to the gene-corrected isogenic control (B) Gene expression levels based on RNA-seq of the genes associated with lipid metabolism.

References

    1. Dorsey ER, Sherer T, Okun MS, Bloem BR. The emerging evidence of the Parkinson pandemic. J. Parkinsons. Dis. 2018;8:S3–S8. doi: 10.3233/JPD-181474. - DOI - PMC - PubMed
    1. Dorsey ER, et al. Global, regional, and national burden of Parkinson’s disease, 1990–2016: A systematic analysis for the Global Burden of Disease Study 2016. Lancet Neurol. 2018;17:939–953. doi: 10.1016/S1474-4422(18)30295-3. - DOI - PMC - PubMed
    1. Bolam JP, Pissadaki EK. Living on the edge with too many mouths to feed: Why dopamine neurons die. Mov. Disord. 2012;27:1478–1483. doi: 10.1002/mds.25135. - DOI - PMC - PubMed
    1. Surmeier DJ, Obeso JA, Halliday GM. Selective neuronal vulnerability in Parkinson disease. Nat. Rev. Neurosci. 2017;18:101–113. doi: 10.1038/nrn.2016.178. - DOI - PMC - PubMed
    1. Diederich NJ, Surmeier DJ, Uchihara T, Grillner S, Goetz CG. Parkinson’s disease: Is it a consequence of human brain evolution? Mov. Disord. 2019;34:453–459. doi: 10.1002/mds.27628. - DOI - PMC - PubMed

Publication types