. 2021 Nov 9;4(1):1274.
doi: 10.1038/s42003-021-02774-y.

CYP11B1 variants influence skeletal maturation via alternative splicing

Affiliations

CYP11B1 variants influence skeletal maturation via alternative splicing

Olja Grgic et al. Commun Biol. .

Abstract

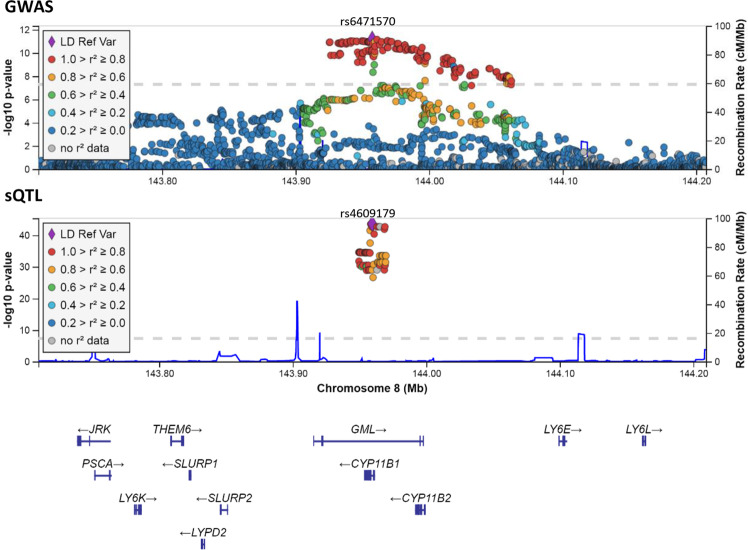
We performed genome-wide association study meta-analysis to identify genetic determinants of skeletal age (SA) deviating in multiple growth disorders. The joint meta-analysis (N = 4557) in two multiethnic cohorts of school-aged children identified one locus, CYP11B1 (expression confined to the adrenal gland), robustly associated with SA (rs6471570-A; β = 0.14; P = 6.2 × 10⁻¹²). rs6410 (a synonymous variant in the first exon of CYP11B1 in high LD with rs6471570), was prioritized for functional follow-up being second most significant and the one closest to the first intron-exon boundary. In 208 adrenal RNA-seq samples from GTEx, C-allele of rs6410 was associated with intron 3 retention (P = 8.11 × 10-40), exon 4 inclusion (P = 4.29 × 10⁻³⁴), and decreased exon 3 and 5 splicing (P = 7.85 × 10-43), replicated using RT-PCR in 15 adrenal samples. As CYP11B1 encodes 11-β-hydroxylase, involved in adrenal glucocorticoid and mineralocorticoid biosynthesis, our findings highlight the role of adrenal steroidogenesis in SA in healthy children, suggesting alternative splicing as a likely underlying mechanism.


Conflict of interest statement

The authors declare no competing interests.

Figures

Fig. 1
Fig. 1. Regional plot for the CYP11B1 locus presented for GWAS and sQTL findings.
The most significant variant in the locus is presented as a purple diamond and the flanking variants as circles in different colors according to the level of their linkage disequilibrium (LD) with the lead variant in the CEU-population 1000 genomes. X axis shows all the genes in the region between 8:143707405 and 8:144207405. Y axis presents the –log10 (P value). Source data are available in Supplementary Data 5 (sQTL locus zoom; http://locuszoom.org) or publicly available at the GEFOS website (https://www.gefos.org/) (GWAS locus zoom; http://locuszoom.org).
Fig. 2
Fig. 2. Association between rs6410 genotype and intron 3 retention.
a Splice graph highlighting a local splicing variant (LSV) from exon 3. Blue junction represents skipping of exon 4; orange junction represents inclusion of exon 4; the green line represents retention of intron 3. Location of candidate SNP rs6410 is indicated and arrows indicate approximate locations for primers used for RT-PCR. Primer sequences are provided in Supplementary Data 8. b Scatterbox plot of MAJIQ quantifications for Percent Intron Retention (PIR) for intron 3 (green in the splice graph, cartoon in the plot inset), stratified by rs6410 genotype in GTEx. Boxes extend from the upper to lower quartile values of PIR per genotype and whiskers extend 1.5 times the interquartile range above the upper quartile and below the lower quartile. The line in the boxplot represents the group’s median value and the triangle represents the arithmatic mean. Legend indicates the Bonferonni adjusted P value for genotype effect and the expected change in PIR levels between homozygous C and homozygous T individuals. Source data for GTEx PIR values are available in Supplementary Data 9. c RT-PCR validation for the association between rs6410 genotype with intron 3 retention using six samples of adrenal hyperplasia from Erasmus MC (left) and nine samples from NIH (right). Primer locations and the expected products with sizes are shown on the left of the gels. Radiolabeled DNA ladder with known fragment sizes are included in the first lane of both gels. The full, uncropped gel images are available in Supplementary Fig. 8. Barplots below the gels indicate average PIR by genotype in each cohort with error bars indicating the sample standard deviation (where applicable) and show a significant association between rs6410 genotype and intron 3 retention in the Erasmus MC (Pearson r2 = 0.85, P = 0.009) and NIH (Pearson r2 = 0.91, P = 5.48 × 10−5) cohorts. Each samples’ PIR quantifcation is also included as a black dot on the barplot. Source data are available in Supplementary Data 10.

References

    1. McCormack SE, et al. Relative skeletal maturation and population ancestry in nonobese children and adolescents. J. Bone Miner. Res. 2017;32:115–124. doi: 10.1002/jbmr.2914. - DOI - PMC - PubMed
    1. Zemel BS. Influence of complex childhood diseases on variation in growth and skeletal development. Am. J. Hum. Biol. 2017;29:1–11. doi: 10.1002/ajhb.22985. - DOI - PubMed
    1. Grgic O, et al. Skeletal maturation in relation to ethnic background in children of school age: the Generation R Study. Bone. 2020;132:115180. doi: 10.1016/j.bone.2019.115180. - DOI - PubMed
    1. Hamosh A, Scott AF, Amberger JS, Bocchini CA, McKusick VA. Online Mendelian Inheritance in Man (OMIM), a knowledgebase of human genes and genetic disorders. Nucleic Acids Res. 2005;33:514–517. doi: 10.1093/nar/gki033. - DOI - PMC - PubMed
    1. Narasimhan ML, Khattab A. Genetics of congenital adrenal hyperplasia and genotype-phenotype correlation. Fertil. Steril. 2019;111:24–29. doi: 10.1016/j.fertnstert.2018.11.007. - DOI - PubMed

Substances