. 2021 Oct 12;24(11):103252.
doi: 10.1016/j.isci.2021.103252. eCollection 2021 Nov 19.

A novel jamming phase diagram links tumor invasion to non-equilibrium phase separation

Affiliations

A novel jamming phase diagram links tumor invasion to non-equilibrium phase separation

Wenying Kang et al. iScience. .

Abstract

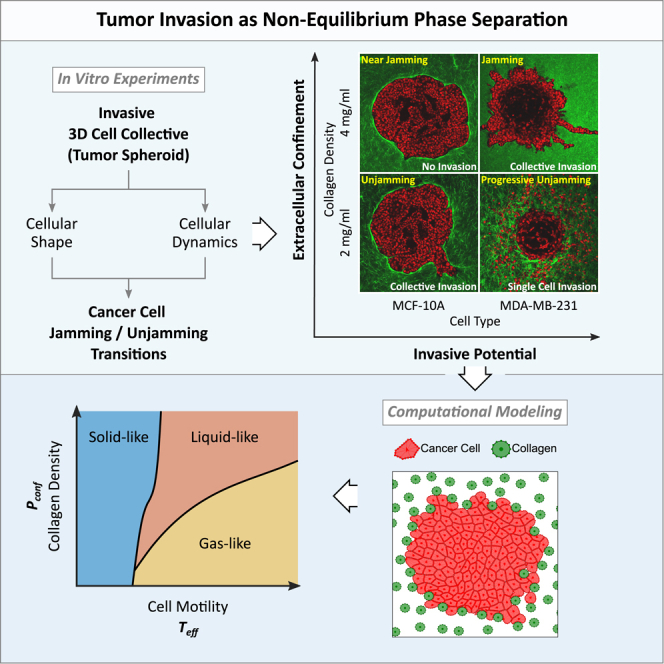
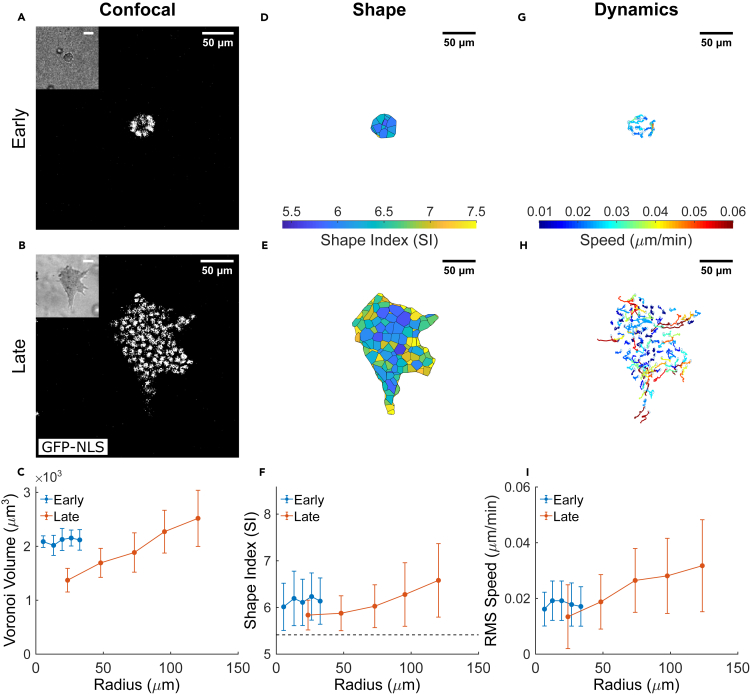
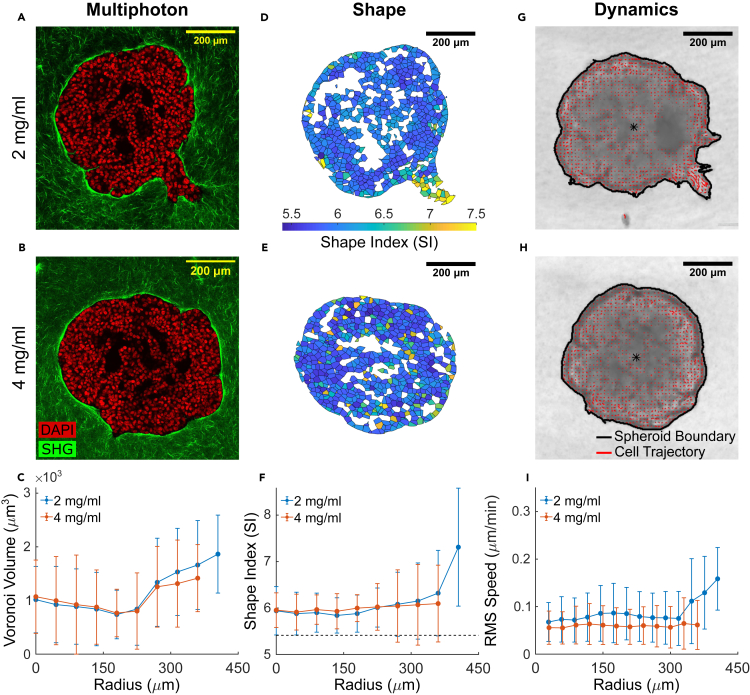
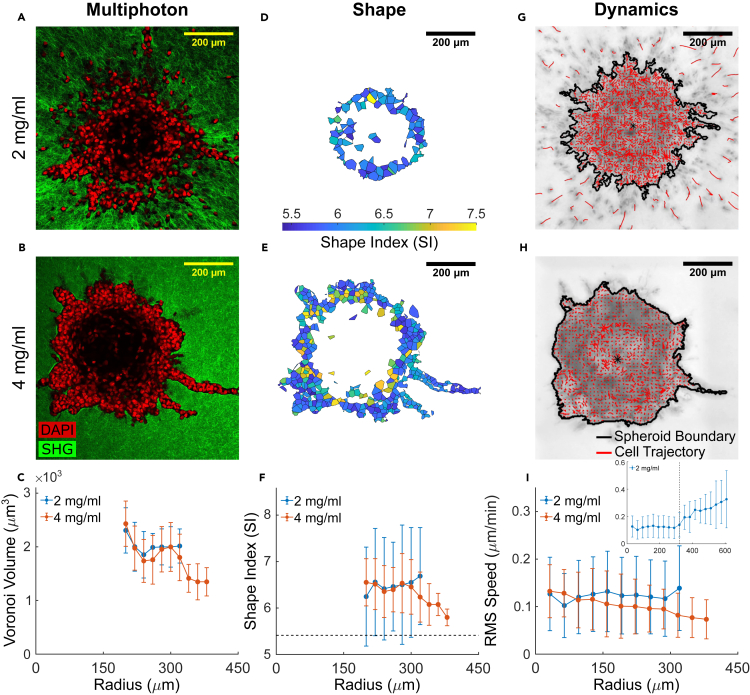
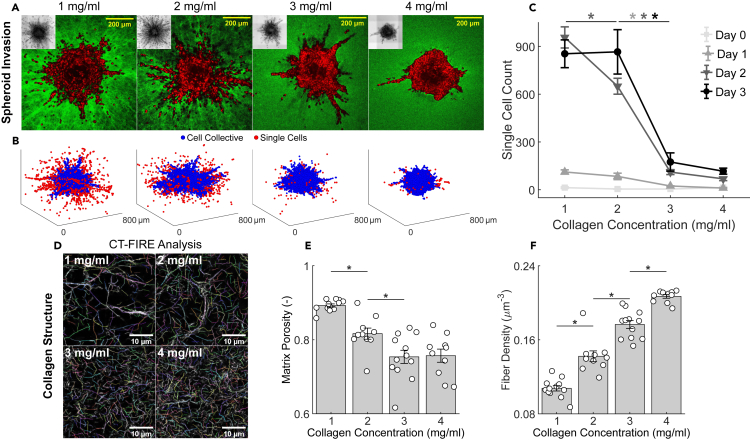
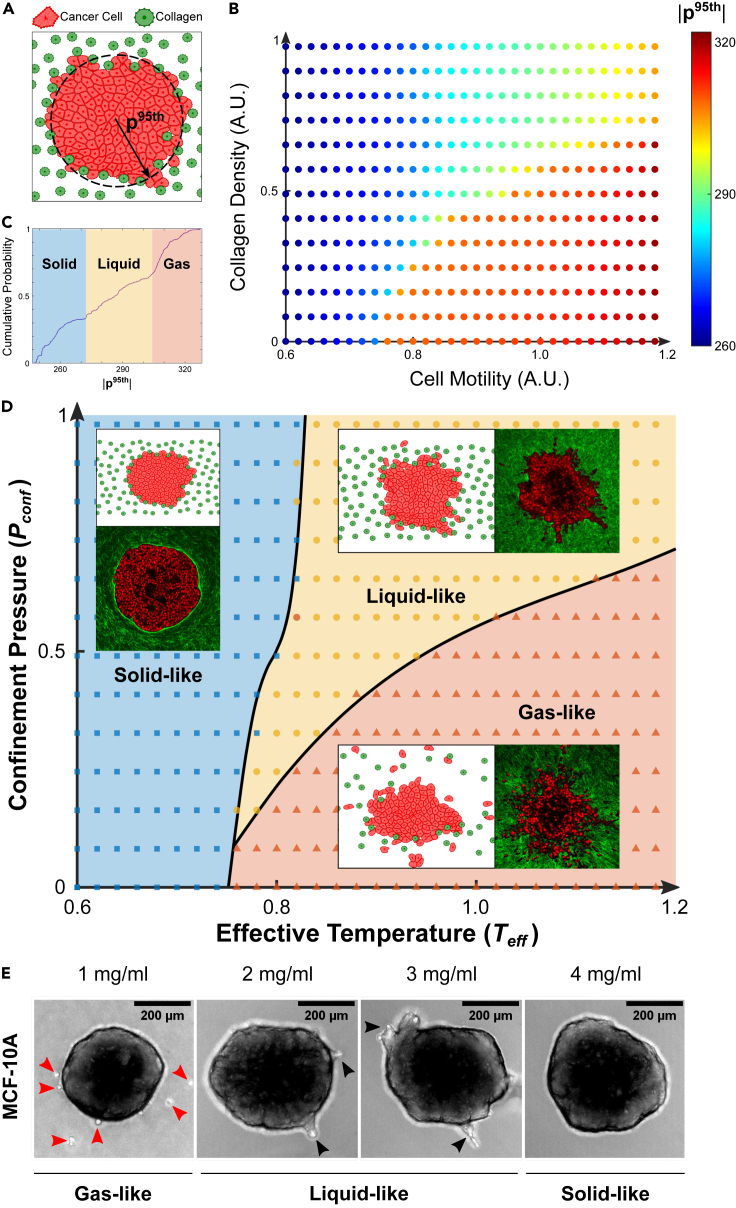
It is well established that the early malignant tumor invades surrounding extracellular matrix (ECM) in a manner that depends upon material properties of constituent cells, surrounding ECM, and their interactions. Recent studies have established the capacity of the invading tumor spheroids to evolve into coexistent solid-like, fluid-like, and gas-like phases. Using breast cancer cell lines invading into engineered ECM, here we show that the spheroid interior develops spatial and temporal heterogeneities in material phase which, depending upon cell type and matrix density, ultimately result in a variety of phase separation patterns at the invasive front. Using a computational approach, we further show that these patterns are captured by a novel jamming phase diagram. We suggest that non-equilibrium phase separation based upon jamming and unjamming transitions may provide a unifying physical picture to describe cellular migratory dynamics within, and invasion from, a tumor.

Keywords: Biophysics; Cancer; Mechanobiology.


Conflict of interest statement

The authors declare no competing interests.

Figures

None
Graphical abstract
Figure 1
Figure 1
The MCF-10A micro-spheroid exhibits a jammed solid-like core and an unjammed fluid-like periphery (A and B) Equatorial cross-sections of confocal microscopy images show cell nuclei distribution within micro-spheroids grown from GFP-NLS labeled MCF-10A cells at distinct stages of spheroid evolution: early stage (days 3–5; A) and late stage (days 7–10; B). Micro-spheroids at late stage are much larger compared to the early stage, and show clear invasive protrusions that extend into the ECM. Corresponding cross-sections of bright-field microscopy images outline the micro-spheroid boundary (inset), and are used to generate bounded Voronoi tessellation to estimate cell shape. (C) In late-stage spheroids, but not early-stage spheroids, cell volumes obtained by tessellation of nuclear centroids increase with increasing radial position. This result is consistent with previous observations in this model system and attributed to an increase in intra-tumor compressive stress (Han et al., 2020) (D and E) The corresponding cell shapes are shown as 2D cross-sections, color-coded according to their respective 3D Shape Index (SI). Cell SIs exhibit more variability in the late-, than early-stage spheroid. (F) Compared to early stage, cells in the late-stage spheroid core have smaller average SI. In the late-stage spheroid, but not early-stage, SI increased with increasing radial position within the spheroid. This is suggestive of the development of a jammed solid-like core and an unjammed fluid-like periphery. The horizontal dashed line indicates the SI threshold for solid to fluid transition, where proximity away from the threshold (SI > 5.4) suggests transition toward a more fluid-like phase (Merkel and Manning, 2018). (G and H) 2D projections of 3D nuclear trajectories tracked over 8 h reveal that within the early-stage spheroid cell migration is fairly homogeneous, whereas in the late-stage spheroid, migratory patterns become highly dynamic. Nuclear trajectories are color-coded according to average migratory speed of the cell over the observation window. (I) Compared to the homogeneous cell dynamics in the early-stage spheroid, cells in the late-stage spheroid develop a positive radial gradient in migratory dynamics. Consequently, less motile cells are located in the jammed core while more motile cells are located in the unjammed periphery. Data for radial distributions are presented as mean ± STD (n = 5 for both early and late stage spheroids).
Figure 2
Figure 2
In a manner dependent on collagen concentration, the MCF-10A macro-spheroid locally unjams and fluidizes at the periphery during collective invasion (A and B) Representative equatorial cross-sections of multiphoton images show MCF-10A macro-spheroid behavior when embedded in either 2 (low density) or 4 mg/mL (high density) collagen for 48 h, with DAPI-stained cell nuclei shown in red and collagen fibers from SHG shown in green. In low density collagen (A), the spheroid develops collective invasive protrusions, while in high density collagen (B), no invasion is observed. Cell-free voids (black) are due to matrigel used to promote spheroid formation (STAR Methods, Figure S1); cells immediately neighboring this cell-free region are excluded from subsequent structural analysis (STAR Methods, Figure S2). (C) Similar to observations from the MCF-10A micro-spheroids, Voronoi cell volumes increased from the macro-spheroid core to the periphery. In contrast to the micro-spheroids, average cell volumes from macro-spheroids cultured at both collagen densities are smaller, and suggest that cells in the macro-spheroid experience greater compressive stress (cf. Figure 1C). (D and E) The corresponding cell shapes are shown as 2D cross-sections, color-coded according to their respective 3D Shape Index (SI). Increased and more variable SIs are localized in the region of the spheroid periphery that undergoes collective invasion (D). On the other hand, SIs remain narrowly distributed, in the rest of the spheroid periphery and in the core regardless of collagen density. (F) In fact, SIs are homogeneously distributed near the threshold for solid-fluid transition (horizontal dashed line indicates solid-fluid transition point at SI = 5.4 (Merkel and Manning, 2018)). SIs increased only at the invasive protrusions suggest localized unjamming and fluidization is associated with invasion. (G and H) Representative DIC images are shown for MCF-10A macro-spheroids cultured in 2 and 4 mg/mL collagen, with cell migratory trajectories (from optical flow, STAR Methods) superimposed in red. Longer trajectories are observed at the collectively invading regions (G). The spheroid boundaries are outlined in black. The entire DIC time-lapse video capturing the dynamics of invasion over 48 h is shown in Video S1. (I) Radial distributions of average cell migratory speed quantified for the final 8-h observation window (40–48 h) conform to expectations from cell shapes. In both collagen densities, migratory speed is homogenously low in the spheroid core, and increased only at sites of localized invasive protrusions. Data for radial distributions are presented as mean ± STD (n = 3 for both 2 and 4 mg/mL spheroids).
Figure 3
Figure 3
The metastatic MDA-MB-231 spheroid exhibits an unjammed fluid-like phase and undergoes drastically different patterns of invasion depending on collagen concentration (A and B) Representative equatorial cross-sections of multiphoton images show MDA-MB-231 macro-spheroids exhibiting distinct invasion patterns when embedded in low density (2 mg/mL) versus high density (4 mg/mL) collagen for 48 h. DAPI-stained cell nuclei are shown in red and collagen fibers from SHG are shown in green. In low density collagen (A), these metastatic cells scatter from the spheroid core as individual, gas-like particles. Conversely, in high density collagen (B), single-cell dominant scattering is subdued and invasion is in the form of collective, fluid-like protrusions. We note that the center of MDA-MB-231 spheroids is devoid of cells, as confirmed by staining of histological cross-sections (Figure S6), and thus result in a hollow shell of highly motile cells rather than a nearly solid spherical structure. Only cells that remain part of the collective are included in the structural analyses (STAR Methods, Figure S2), hence the absence of data for the first 200 μm of the associated radial distributions. (C) Average Voronoi volumes suggest that MDA-MB-231 cells have larger volumes with respect to their MCF-10A counterparts (cf. Figure 2C). In 2 mg/mL collagen, cell volumes remain roughly independent of radial position. In 4 mg/mL collagen, instead, cell volumes show a decreasing radial gradient. This decrease in cell volume from the spheroid core to the invasive protrusion suggests elevated stress in invading cells from confinement by the collagen matrix. (D and E) The corresponding cell shapes are shown as 2D cross-sections, color-coded according to their respective 3D Shape Index (SI). Regardless of collagen concentration, cells from MDA-MB-231 spheroids display higher SI with respect to MCF-10A spheroids (cf. Figures 2D and 2E). (F) Radial distribution of average SI values is consistent with an unjammed fluid-like phase (horizontal dashed line indicates solid-fluid transition point at SI = 5.4 (Merkel and Manning, 2018)). In high density collagen, a radially decreasing gradient in SI suggests that cells jam while invading collectively under matrix confinement. (G and H) Representative DIC images are shown for MDA-MB-231 macro-spheroids cultured in 2 and 4 mg/mL collagen, with cell migratory trajectories (from optical flow, STAR Methods) superimposed in red. The spheroid boundaries are outlined in black. The entire DIC time-lapse video capturing the dynamics of invasion over 48 h is shown in Video S1. Cell dynamics mirrors structural signatures of cell jamming/unjamming. (I) Radial distributions of RMS speed quantified for the last 8-h observation window (40–48 h) show that cells in MDA-MB-231 macro-spheroids have homogeneously higher speeds with respect to MCF-10A spheroids (cf. Figure 2I) and are thus more fluid-like. In low density collagen, cell speed increases further as soon as cells detach from the spheroid and invade as single, gas-like particles (inset, where the radial position of the spheroid boundary is marked by a dashed vertical line). This observation supports the proposed analogy of fluid-to-gas transition. In high density collagen, RMS speed decrease radially with collective invasion, and is supportive of a fluid-to-solid transition due to confinement-induced jamming (Haeger et al., 2014). Data for radial distributions are presented as mean ± STD (n = 3 for both 2 and 4 mg/mL spheroids).
Figure 4
Figure 4
Collagen fiber density is associated with a sudden switch in MDA-MB-231 invasive phenotype (A) Representative equatorial cross-sections of multiphoton images show MDA-MB-231 spheroids after 3 days of invasion in graded collagen concentrations (1–4 mg/mL) along with the associated DIC minimum intensity projections (insets). Single-cell migration is observed primarily in 1 and 2 mg/mL while collective migration is observed primarily in 3 and 4 mg/mL. (B) Corresponding 3D rendering of cell nuclei distributions identified from automated analysis of multiphoton image stacks (STAR Methods). Nuclei are color-coded based on whether they remain within the cell collective (blue) or are detected as single cells (red). (C) Immediately after embedding in collagen (day 0), all cells are part of the multicellular collective with no invasion at any collagen density. As the spheroid evolves over time (days 1, 2 and 3), a striking gas-like phase and corresponding single cell escape progressively emerged at lower collagen concentrations (1 and 2 mg/mL) but not higher collagen concentrations (3 and 4 mg/mL). By day 3, a switch-like biphasic reduction in the number of single invading cells emerged when collagen concentration was increased from 2 to 3 mg/mL. The temporal evolution of single cell invasion as a function of collagen concentration supports the existence of criticality between 2 and 3 mg/mL, at which point the invasive phenotype switches abruptly from single to collective invasion. Single cell counting data are shown from days 0–1–2–3 and collagen concentrations of 1–2–3–4 mg/mL, n = 3 per group, except for day 0–1 mg/mL(n = 2) and day 2–2 mg/mL (n = 9). The significance of differences due to collagen concentration and time were quantified using a one-way ANOVA and post-hoc pairwise comparisons with Bonferroni correction. Statistical significance was achieved between 1 and 2 mg/mL at day 2 (p < 0.05), and between 2 and 3 mg/mL at days 1 (p < 0.05), 2 (p < 0.01), and 3 (p < 0.01), while no significant differences were observed between 3 and 4 mg/mL. We examined whether this transition is due to differences in collagen structure. (D) High-resolution multiphoton images show representative acellular collagen networks at 1 to 4mg/mL, with individually segmented fibers from CT-FIRE analysis (Bredfeldt et al., 2014) as indicated by different colors. (E and F) Matrix porosity shows a gradual decrease with collagen concentration but is undistinguishable between 3 and 4 mg/mL (E), while fiber density displays a consistent increase with collagen concentration (F) which mirrors the increase in bulk shear modulus (Figure S8). Microstructural data are shown from 1 mg/mL (n = 12), 2 mg/mL (n = 10), 3 mg/mL (n = 12), and 4 mg/mL (n = 12) collagen gels. All data are presented as mean ± SEM and ∗ indicates statistical significance at p < 0.05.
Figure 5
Figure 5
A 2D computational model of a multicellular cluster in collagen reveals that tumor invasion phenotypes and associated material states are governed by a jamming phase diagram (A) The hybrid computational model of tumor invasion into ECM is characterized by cancer cells (orange particles) that can move in random directions with varying degrees of self-propulsion (STAR Methods). At the beginning of each simulation, cancer cells are organized to form a circular collective that is surrounded by collagen (green particles), arranged randomly and with varying spatial densities (STAR Methods). At the end of each simulation, the 95th percentile of the radial cell positions (p95th) with respect to the centroid of the collective is used as a readout of the degree of invasion. (B) A diagram is generated by gradually incrementing two state variables: cell motility and collagen density, both expressed in arbitrary units (A.U.). Data points are color-coded according to the mean value of p95th over n = 10 simulations, each corresponding to randomly assigned positions of the collagen particles and orientations of the cell motility vectors. Three notable regions can be distinguished in the diagram and qualitatively correspond to solid-, liquid-, and gas-like behaviors at the invasive front (Videos S2, S3, and S4). (C) These three regions can be distinguished from distinct elbow regions in the cumulative probability distribution of p95th generated from all simulations. We identified the 34th and 64th percentiles as robust thresholds (cf. Table S2) to separate solid-from liquid-like and liquid-from gas-like phases, respectively. (D) The resultant map represents a jamming phase diagram, now color-coded to indicate solid-like (blue squares), fluid-like (yellow circles), and gas-like (orange triangles) material phases. In analogy with equilibrium thermodynamic systems, here cell motility is replaced with an effective temperature (Teff, Box 1) while collagen density is replaced with a confinement pressure (Pconf, Box 2). By tuning only two state variables, the model recapitulates much of the experimentally observed behaviors. For each material phase on the diagram, representative multiphoton images from experiments are shown in comparison to representative computational snapshots (insets). In the solid-like phase (blue area), a non-invasive MCF-10A spheroid in high collagen density (4 mg/mL) is shown in comparison to the result of a simulation parameterized with low cell motility (0.2) and high collagen density (0.82). In the fluid-like phase (yellow area), an MDA-MB-231 spheroid collectively invading in high collagen density (4 mg/mL) is shown in comparison to the result of a simulation parameterized with high cell motility (1.0) and high collagen density (0.82). Finally, in the gas-like phase (orange area), an MDA-MB-231 spheroid scattering into single cells in low collagen density (2 mg/mL) is shown in comparison to the result of a simulation parameterized with high cell motility (1.0) and low collagen density (0.21). Overall, we observe that at low cell motility, and thus low Teff, the system is homogeneously “cold” and the spheroid shows a non-invasive, solid-like behavior regardless of collagen density. However, at higher Teff the collagen density, and hence Pconf, determines fluid-like or gas-like behaviors. Phase boundaries (black lines) on the jamming phase diagram are obtained as best-fit curves that separate data points belonging to different material phases. Unlike traditional thermodynamic phase transitions, where the boundary lines mark clear transitions between material phases, in our cellular systems material transitions are continuous and smeared. Thus, the boundary lines mark regions of coexistent phases, where near each phase boundary, the material phases become indistinguishable. The proposed diagram also predicts the existence of a “triple point” where solid-, liquid-, and gas-like phases coexist, and below which direct solid-to-gas transitions occur. (E) To test the plausibility of such prediction we ran an invasion assay in graded collagen concentrations (1–4 mg/mL) using MCF-10A spheroids. which, according to the phase diagram, are characterized by a lower Teff with respect to their MDA-MB-231 counterparts. The periphery of MCF-10A spheroids was found to remain solid-like and non-invasive in 4 mg/mL, to fluidize and invade collectively in 3 and 2 mg/mL (black arrowheads indicate collective protrusions) and, more importantly, to separate directly into individual gas-like cells in 1 mg/mL (red arrowheads indicate individualized cells). These findings support the direct individualization of cancer cells from a nearly jammed tumor as predicted by our jamming phase diagram.

References

    1. Angelini T.E., Hannezo E., Trepat X., Marquez M., Fredberg J.J., Weitz D.A. Glass-like dynamics of collective cell migration. Proc. Natl. Acad. Sci. U S A. 2011;108:4714–4719. doi: 10.1073/pnas.1010059108. - DOI - PMC - PubMed
    1. Aste T., Di Matteo T. Emergence of Gamma distributions in granular materials and packing models. Phys. Rev. E Stat. Nonlinear Soft Matter Phys. 2008;77:021309. doi: 10.1103/PhysRevE.77.021309. - DOI - PubMed
    1. Ateshian G.A., Warden W.H., Kim J.J., Grelsamer R.P., Mow V.C. Finite deformation biphasic material properties of bovine articular cartilage from confined compression experiments. J. Biomech. 1997;30:1157–1164. doi: 10.1016/s0021-9290(97)85606-0. - DOI - PubMed
    1. Atia L., Bi D., Sharma Y., Mitchel J.A., Gweon B., Koehler S.A., DeCamp S.J., Lan B., Kim J.H., Hirsch R., Pegoraro A.F. Geometric constraints during epithelial jamming. Nat. Phys. 2018;14:613–620. doi: 10.1038/s41567-018-0089-9. - DOI - PMC - PubMed
    1. Berthier L., Charbonneau P., Ninarello A., Ozawa M., Yaida S. Zero-temperature glass transition in two dimensions. Nat.Commun. 2019;10:1–7. - PMC - PubMed

LinkOut - more resources