. 2021 Oct 11;2(10):100408.
doi: 10.1016/j.xcrm.2021.100408. eCollection 2021 Oct 19.

Altered brown fat thermoregulation and enhanced cold-induced thermogenesis in young, healthy, winter-swimming men

Affiliations

Altered brown fat thermoregulation and enhanced cold-induced thermogenesis in young, healthy, winter-swimming men

Susanna Søberg et al. Cell Rep Med. .

Abstract

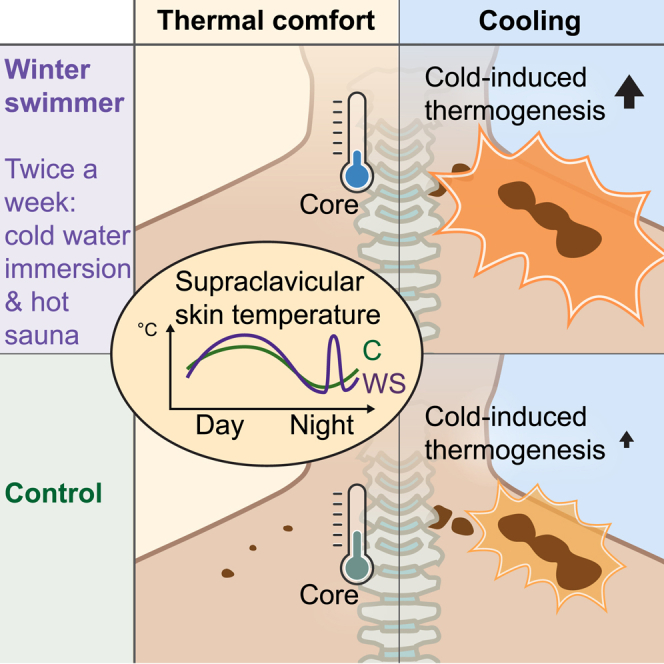
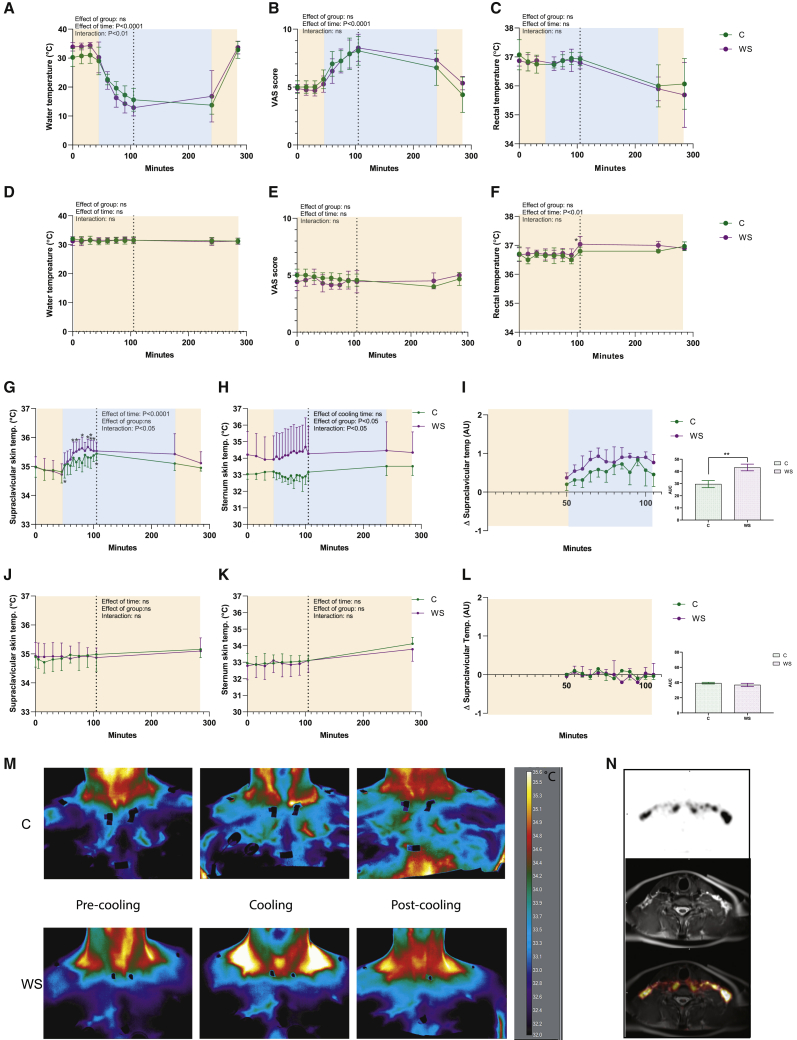
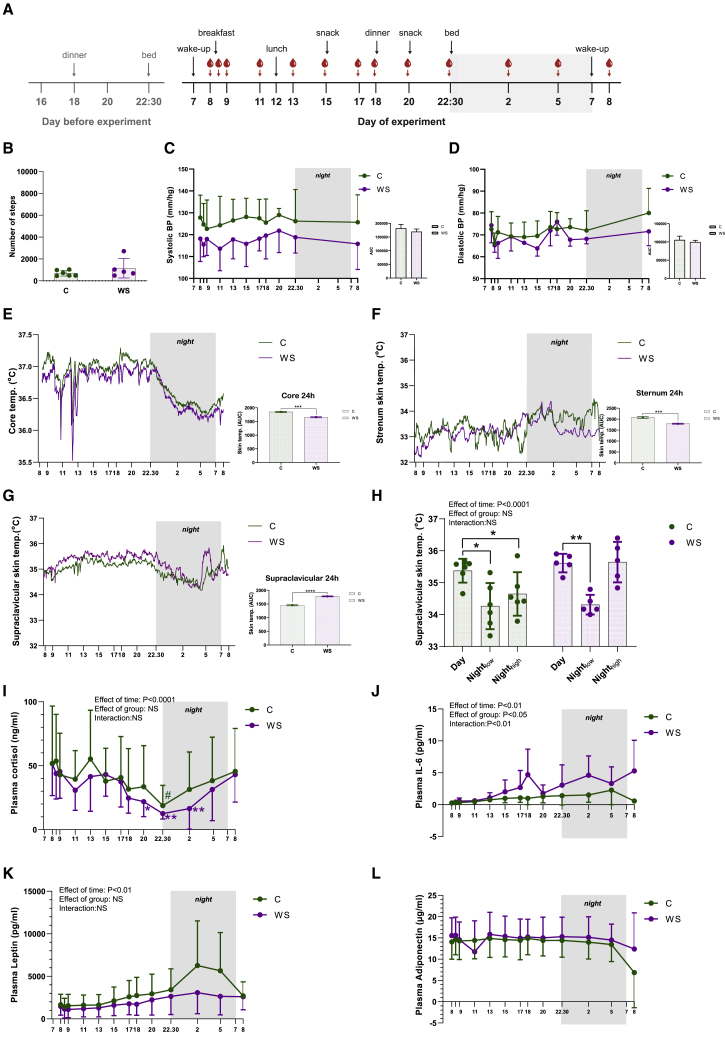
The Scandinavian winter-swimming culture combines brief dips in cold water with hot sauna sessions, with conceivable effects on body temperature. We study thermogenic brown adipose tissue (BAT) in experienced winter-swimming men performing this activity 2-3 times per week. Our data suggest a lower thermal comfort state in the winter swimmers compared with controls, with a lower core temperature and absence of BAT activity. In response to cold, we observe greater increases in cold-induced thermogenesis and supraclavicular skin temperature in the winter swimmers, whereas BAT glucose uptake and muscle activity increase similarly to those of the controls. All subjects demonstrate nocturnal reduction in supraclavicular skin temperature, whereas a distinct peak occurs at 4:30-5:30 a.m. in the winter swimmers. Our data leverage understanding of BAT in adult human thermoregulation, suggest both heat and cold acclimation in winter swimmers, and propose winter swimming as a potential strategy for increasing energy expenditure.

Trial registration: ClinicalTrials.gov NCT03096535.

Keywords: adipose tissue; cold acclimation; cold water immersion; core temperature; energy expenditure; heat acclimation; human brown fat; human circadian rhythm; sauna; thermal comfort.


Conflict of interest statement

C. Scheele is a consultant for Novo Nordisk A/S on human brown adipose tissue biology. Z.G.-H. works, in some capacity, for Embark Biotech ApS, a company developing therapeutics for the treatment of diabetes and obesity. All other authors declare no competing interests associated with this manuscript.

Figures

None
Graphical abstract
Figure 1
Figure 1
Subject characterization and experimental design Subjects (winter swimmers [WS], n = 7; controls [C], n = 8) performed an oral glucose tolerance test (OGTT). n represents the number of human individuals in each group and is consistent throughout this figure unless otherwise stated. (A) Plasma glucose levels before (time point 0) and following glucose ingestion. (B) Plasma glucose levels 2 h after glucose ingestion. (C) Plasma insulin levels before (time point 0) and following glucose ingestion. (D) Pulse before and during cooling and after reheating. (E) Systolic blood pressure in response to cooling during a cold pressor test. (F) Diastolic blood pressure in response to cooling. (G) Experimental design depicting the measurements performed during the three experimental days. Data are presented as mean ± SD. Differences were assessed using two-way repeated-measures ANOVA with Sidak’s multiple comparison tests to assess specific differences except in (B), where an unpaired t test was used. ∗p < 0.05, ∗∗p < 0.01, ∗∗∗p < 0.001.
Figure 2
Figure 2
Infrared thermography of supraclavicular BAT heat production at cooling and a thermal comfort (TC) state Subjects (WS, n = 7; C, n = 8) were cooled using a Blanketrol III system by controlling the temperature of circulating water in the blanket. n represents the number of human individuals in each group and is consistent throughout this figure unless otherwise specifically stated. (A) Water temperature in the blanket during cooling. (B) Estimate of the subjects’ temperature perception using a VAS score. (C) Core temperature as estimated by rectal thermometers. On a separate day, subjects were observed during the thermal comfort state protocol. (D) Water temperature during a thermal comfort state. (E) Estimate of the subjects’ temperature perception using a VAS score. (F) Core temperature as estimated by rectal thermometers. (G) Supraclavicular BAT skin temperature during cooling measured by IRT. The effect of the group and cooling were assessed during time points of 45–105 min. Sidak’s post-test was used to assess differences between the time point of 45 min (thermal comfort state) and the time points during cooling. (H) Sternum skin temperature during cooling as measured by IRT and analyzed as described in (G). (I) Supraclavicular BAT skin temperature in relation to the temperature at the sternum in response to cooling. Area under the curve (AUC) between groups is displayed to the right. (J) Supraclavicular BAT skin temperature as measured by IRT during a thermal comfort state and analyzed as described in (G). (K) Sternum skin temperature during a thermal comfort state as measured by IRT and analyzed as described in (G). (L) IRT recording of the temperature changes in response to a thermal comfort state in supraclavicular BAT in relation to the temperature at the sternum. Because of experimental error, measurements were not available for all subjects at every time point. The time points at which data from fewer than three subjects were recorded were excluded. (M) Representative IRT images of a control subject (upper panel) and a winter swimmer (lower panel). The scale bar represents temperature in °C. (N) MRI assessing the distance between the activated BAT and the surface of the skin in the area where IRT images were obtained. Relative IRT values in (I) and (L) were calculated as described in the STAR Methods section. Data are presented as mean ± SD. ∗p < 0.05, ∗∗p < 0.01, ∗∗∗p < 0.001. See also Figure S1.
Figure 3
Figure 3
PET/MRI scanning of subjects in response to perception-based cooling or a thermal comfort state PET/MRI scanning was part of the perception-based cooling or thermal comfort state protocols described in Figures 1 and 2, and data are shown from WS (n = 7) and C (n = 8). n represents the number of human individuals in each group and is consistent throughout this figure unless otherwise specifically stated. (A) Representative images of a subject (winter swimmer) at a thermal comfort state (left) and during cooling (right). (B) Glucose tracer (FDG) uptake in BAT measured as mean standardized uptake value (SUVmean) in the regions shown in (A). (C) SUVmean uptake multiplied by the volume of BAT with SUV above or equal to 2.0 during a TC state or during cooling as a measure of BAT metabolic volume (BMV). (D) Representative image showing glucose tracer uptake in the perirenal BAT (left), which was quantified for each subject and compared between groups and in response to a TC state and cooling (right). (E) Resting energy expenditure (REE) in winter swimmers and controls in response to a thermal comfort state or cooling. The actual analysis was performed for 30 min, and the energy consumption during 24 h represents a calculated value if the energy consumption remains constant during this period. (F) Cold-induced thermogenesis, calculated as the delta increase in energy expenditure induced by cooling. (G) Lean body mass as measured by DEXA scan as an estimation of muscle mass. (H) Electromyography (EMG) measurements recorded during 5 min at a thermal comfort state and during 5 min of cooling. Values are the area under the curve, including negative peaks, calculated per individual. (I) A subset of subjects displayed glucose tracer uptake in intercostal and/or neck muscles following cooling (left). The signal in intercostal muscles was graded 1–4 depending on intensity, and 0.5 was added if the subject also had a signal in the neck. The scale bars thus represent estimated arbitrary values for cold-induced glucose uptake in the intercostal and neck muscles. (J) Example of an MRI scan on a cooling day. Delineation of the region of interest (ROI) for calculation of the water percentage in areas with BAT (upper and middle panels), subcutaneous WAT (upper and lower panels), and skeletal muscle (middle panel). (K) Water percentage in WAT, BAT, and skeletal muscle as calculated from MRI data. (L) Water percentage in BAT in response to cooling. (M–O) Gene expression analysis of LIPE, PLIN1, and ELOVL6 in WAT between groups and in response to cooling. Differences between groups and treatments were assessed using mixed models and subsequent post-tests. Differences in AUC were assessed with an unpaired t test. When not otherwise specified, data are presented as mean ± SD. ∗p < 0.05, ∗∗p < 0.01, ∗∗∗p < 0.001, ∗∗∗∗p < 0.0001. See also Figure S2.
Figure 4
Figure 4
Diurnal thermoregulation and circulating hormones in adult humans A subset of the subjects included in the preceding experiments were invited for a subsequent experiment to study diurnal thermoregulation at a thermal comfort state (winter swimmers, n = 5; controls, n = 6). n represents the number of human individuals in each group and is consistent throughout the figure unless otherwise specifically stated. (A) Experimental setup. Subjects entered and spent the night at the laboratory before the recordings started and were then followed for 24 h. (B) Number of steps by the two groups. (C) Systolic blood pressure. (D) Diastolic blood pressure. (E) Core temperature recorded by an ingested temperature pill. Means without SD are shown. Area under the curve between groups is shown to the right. (F) Sternum temperature recorded by iButtons. Means without SD are shown. Area under the curve between groups is shown to the right. (G) BAT temperature recorded by using iButtons placed over supraclavicular BAT as detected from the IRT images during cooling. Means without SD are shown. Area under the curve between groups is shown to the right. (H) BAT temperature comparing the average during the day (1:01–2:01 p.m.), nightlow (4:01–4:11 a.m.), and nighthigh (4:49–4:59 a.m.). (I) Plasma cortisol over 24 h. Because of lack of samples, n for cortisol analysis was n = 3 winter swimmers and n = 3 control subjects. (J) Plasma IL-6 over 24 h. (K) Plasma leptin over 24 h. (L) Plasma adiponectin over 24 h. Differences between groups and treatments were assessed using two-way ANOVA or mixed models and subsequent post-tests. Differences in AUC was assessed with an unpaired t test. Data are presented as mean ± SD. ∗p < 0.05, ∗∗p < 0.01, ∗∗∗p < 0.001. See also Figure S3.

Comment in

References

    1. Leitner B.P., Huang S., Brychta R.J., Duckworth C.J., Baskin A.S., McGehee S., Tal I., Dieckmann W., Gupta G., Kolodny G.M. Mapping of human brown adipose tissue in lean and obese young men. Proc. Natl. Acad. Sci. USA. 2017;114:8649–8654. - PMC - PubMed
    1. Nedergaard J., Bengtsson T., Cannon B. Unexpected evidence for active brown adipose tissue in adult humans. Am. J. Physiol. Endocrinol. Metab. 2007;293:E444–E452. - PubMed
    1. Gerhart-Hines Z., Feng D., Emmett M.J., Everett L.J., Loro E., Briggs E.R., Bugge A., Hou C., Ferrara C., Seale P. The nuclear receptor Rev-erbα controls circadian thermogenic plasticity. Nature. 2013;503:410–413. - PMC - PubMed
    1. Lee P., Bova R., Schofield L., Bryant W., Dieckmann W., Slattery A., Govendir M.A., Emmett L., Greenfield J.R. Brown Adipose Tissue Exhibits a Glucose-Responsive Thermogenic Biorhythm in Humans. Cell Metab. 2016;23:602–609. - PubMed
    1. van den Berg R., Kooijman S., Noordam R., Ramkisoensing A., Abreu-Vieira G., Tambyrajah L.L., Dijk W., Ruppert P., Mol I.M., Kramar B. A Diurnal Rhythm in Brown Adipose Tissue Causes Rapid Clearance and Combustion of Plasma Lipids at Wakening. Cell Rep. 2018;22:3521–3533. - PubMed

Publication types

Associated data