. 2021 Oct 19;2(10):100425.
doi: 10.1016/j.xcrm.2021.100425.

Platelet transcriptome identifies progressive markers and potential therapeutic targets in chronic myeloproliferative neoplasms

Affiliations

Platelet transcriptome identifies progressive markers and potential therapeutic targets in chronic myeloproliferative neoplasms

Zhu Shen et al. Cell Rep Med. .

Abstract

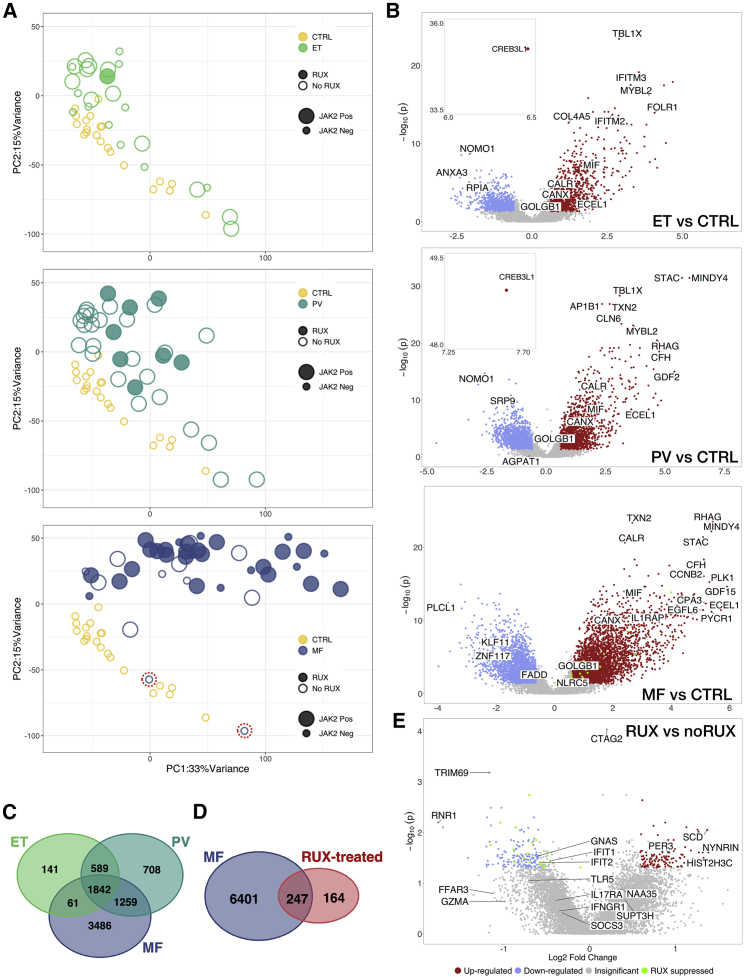
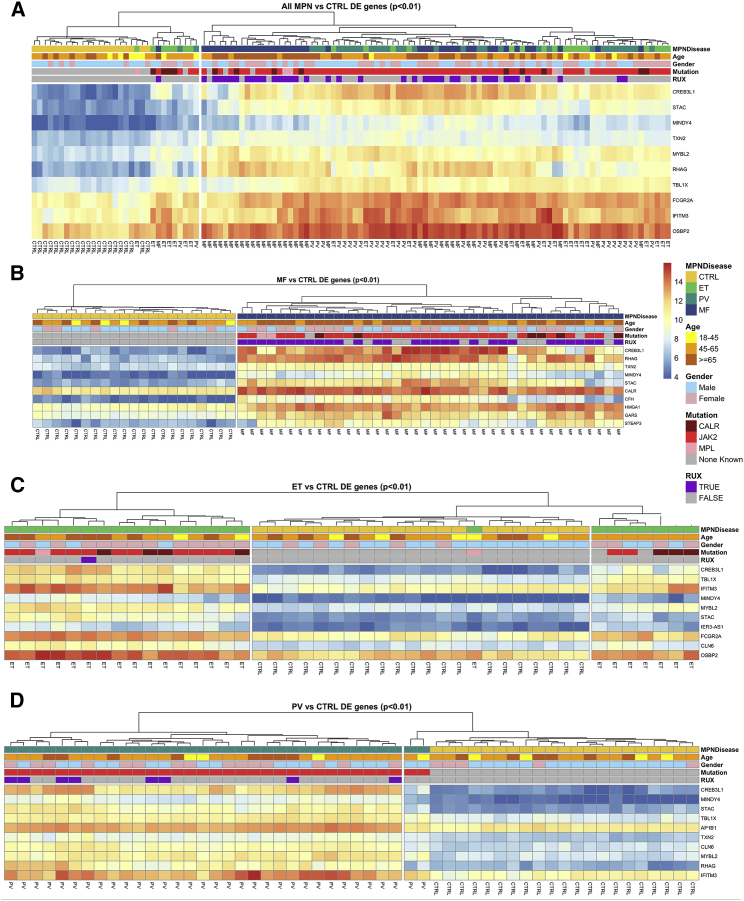
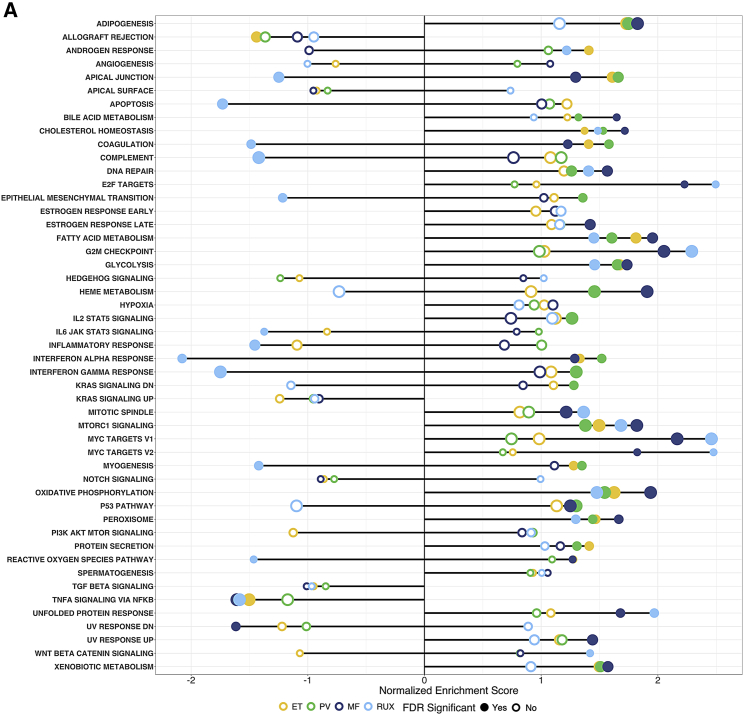
Predicting disease progression remains a particularly challenging endeavor in chronic degenerative disorders and cancer, thus limiting early detection, risk stratification, and preventive interventions. Here, profiling the three chronic subtypes of myeloproliferative neoplasms (MPNs), we identify the blood platelet transcriptome as a proxy strategy for highly sensitive progression biomarkers that also enables prediction of advanced disease via machine-learning algorithms. The MPN platelet transcriptome reveals an incremental molecular reprogramming that is independent of patient driver mutation status or therapy. Subtype-specific markers offer mechanistic and therapeutic insights, and highlight impaired proteostasis and a persistent integrated stress response. Using a LASSO model with validation in two independent cohorts, we identify the advanced subtype MF at high accuracy and offer a robust progression signature toward clinical translation. Our platelet transcriptome snapshot of chronic MPNs demonstrates a proof-of-principle for disease risk stratification and progression beyond genetic data alone, with potential utility in other progressive disorders.

Keywords: MPN; biomarker; blood platelets; myeloproliferative neoplasms; platelet RNA-seq; platelet transcriptome; prediction algorithms; progression signatures; proteostasis; ruxolitinib.


Conflict of interest statement

The authors declare no competing interests.

Figures

None
Graphical abstract
Figure 1
Figure 1
Two independent MPN clinical cohorts and closely replicated patient variables (A) Similarity in distribution of MPN subtypes between two cohorts of MPN patients (Stanford single-center; approximately 2 years apart: cohort 1: 2016-17, n = 71; and cohort 2: 2019, n = 49); the majority subtype is MF in both cohorts (34% of n = 71 and 37% of n = 49). (B) Comparable distribution of age across MPN subtypes in the two cohorts. Violin plots of patient age from each MPN subtype reflect clinical expectation, with an almost identical match between the two cohorts. Slightly higher median age noted in the second cohort for ET and PV patients alone. (C) Comparable and balanced distribution of gender across MPN subtypes in the two cohorts. Larger percentage of male healthy controls in both cohorts and smaller percentage of males in ET cohort 1 noted. (D) Matched distribution of primarily JAK2 and CALR mutational status across MPN subtypes in the two cohorts. JAK2 is the most common mutation across all three subtypes; 100% of PV and over 50% of ET and MF patients have JAK2 mutation in both cohorts. Mismatch between cohorts on the MPL/triple negative patients is noted as a natural consequence of the rarer prevalence of these mutations; and therefore, not the primary focus of this work. (E) Diversity of MPN patient therapies across the two cohorts reflecting current clinical practice. The majority being aspirin (ASA) in ET/PV patients and the JAK-inhibitor, ruxolitinib, in MF. Note that a given patient may be on more than one treatment and therefore, the total treatment percentage in this graphic may not equal 100. To control for any inter-patient variability, all treatment, in addition to patient age and gender are adjusted as confounding factors in downstream gene expression analyses. (F) Representative clinical laboratory variables, as boxplots, measured at the same date and time as platelet sampling. Compared to controls, MPN patients show larger variance (inter-quartile range [IQR]), and reflect current clinical knowledge. Groups differ primarily only with respect to blood cell counts (platelet/RBC/WBC); and show the greatest differential in MF. Note higher platelet count in ET with a concomitant lower mean platelet volume, higher red blood cell count in PV and lower red blood cell count in MF with concomitantly lower hemoglobin, hematocrit, and higher red cell width. Wilcoxson signed rank tests marked by asterisks indicate a statistically significant difference between any two groups (∗p ≤ 0.05; ∗∗p ≤ 0.01; ∗∗∗p ≤ 0.001; ∗∗∗∗p ≤ 0.0001). (G) High correlation (R2 = 0.89) of platelet gene expression as assessed by normalized counts of matched transcripts in each cohort between each of controls, essential thrombocythemia (ET), polycythemia vera (PV), and myelofibrosis (MF). The two-cohort collective sample size by subtype constitutes each of ET (n = 24), PV (n = 33), primary or post ET/PV secondary MF (n = 42), healthy donors (n = 21), and totals (n = 120), affording increased statistical power for subsequent analyses.
Figure 2
Figure 2
MPN platelet transcriptome distinguishes disease phenotype and reveals phenotype- and JAK-inhibitor specific signatures (A) Unsupervised principal component analysis (PCA) of normalized platelet gene expression counts adjusted for age, gender, treatment, and experimental batch. Three panels of PC1 and PC2 colored by MPN subtype; and each contrasted with controls (n = 21; yellow): ET (n = 24; top, light green), PV (n = 33; middle, dark green), and MF (n = 42; bottom, dark blue). Circles filled or open mark presence or absence of ruxolitinib treatment and size of circles, smaller or larger, indicate presence or absence of JAK2 mutation. The first two principal components account for 48% of total variance in the data. (B) Volcano plots (three panels as A above of ET, PV, and MF) of differential gene expression showing statistical significance (negative log10 of p values) versus log2 fold change of each gene. Significant upregulated and downregulated genes are those with p values (FDR) smaller or equal to 0.05 and absolute value of fold changes larger or equal to 1.5. (C and D) Venn Diagram comparisons of MPN differential gene expression lists. In (C), each of ET, PV and MF is contrasted with controls; identifying gene sets that are shared (n = 1504, FDR < 0.05) as well as unique to each subtype. In (D), differential in the RUX-treated cohort is contrasted with MF versus controls. Differential in gene expression in RUX-treated cohort is a fraction of the total differential noted in the MF transcriptome. (E) Volcano plot of differential gene expression between MPN patients treated with ruxolitinib and not. A small subset of overlapping differential genes that are upregulated in MF (B) (bottom panel) and suppressed in the RUX-treated cohort (E) are colored in green.
Figure 3
Figure 3
Graded differential expression by MPN phenotype and driver mutation status (A–D) Hierarchically clustered heatmaps of the top 10 differentially expressed genes (DEGs) from controls (FDR < 0.01) of all MPN (A) and MF, ET, and PV each separately (B–D). Colored annotation is provided to indicate MPN subtype, age, gender, mutation, and ruxolitinib treatment. Rows indicate gradation in gene expression on a blue (low) to red (high) scale. Columns indicate sample type from controls (CTRL) to ET, PV, and MF.
Figure 4
Figure 4
Altered immune, metabolic, and proteostatic pathways underlie each MPN phenotype Pathway-enrichment analysis of genes with MPN subtype-specific expression (color indicated; light green ET, dark green PV, and dark blue MF) overlayed with ruxolitinib-specific expression (light blue). Each point represents a pathway; the x axis gives the normalized enrichment score, which reflects the degree to which each pathway is over- or under-represented at the top or bottom of the ranked list of differentially expressed genes, normalized to account for differences in gene set size and in correlations between gene sets and the expression dataset. The y axis lists the detail-level node of the most enriched pathways; solid lines mark GSEA-recommended Bonferroni-corrected statistical significance criterion of FDR < 0.25 for exploratory analyses. Dotted lines mark FDR > 0.25 and therefore, not sufficiently significant, yet visualized alongside solid lines to retain overall context (upper-level parent nodes of the detail-level pathways are provided in Table S3A–S3C). Multiple immune and inflammatory pathways are consistently significantly enriched across ET, PV, and MF (and suppressed in the ruxolitinib-treated cohort). MF is differentiated from ET and PV through dysregulation of additional molecular processes for cellular development, proliferation, metabolism, and DNA damage.
Figure 5
Figure 5
Prediction of MF based on unique and progressive MPN platelet transcriptome (A and B) Top few genes (out of 3000+) demonstrating monotonic progressive gene expression (log 2 fold change in expression y axis, FDR < 0.01, Mann-Kendall test with Bonferroni correction) across x-axes (A), CTRL-to-ET-to-MF and (B, CTRL-to-PV-to-MF. (C) Lasso-penalized multinomial logistic regression model under temporal validation i.e., trained on Stanford cohort 1 (n = 71, 2016–2017, Figure 1A) and validated on Stanford cohort 2 (n = 49, 2019, Figure 1A) as test set. (D) Lasso-penalized multinomial logistic regression model under geographical validation using two independently published datasets for training (cohort 3, n = 31 healthy controls in addition to Stanford cohorts 1 and 2) and validation (cohort 4, n = 25 MF and n = 15 healthy controls). (E) Receiver operating curves (ROC) toward MF prediction under conditions of temporal (C) and geographical (D) validation. Temporal validation uses three models: (i) baseline, with no gene expression data but patient age, gender, and mutation status alone; (ii) entire MPN platelet transcriptome; and (iii) MPN progressive genes alone. Outperformance of the progressive transcriptome model (red curve, AUROC = 0.96) vis-a-vis the entire transcriptome dataset (blue curve, AUROC = 0.95) and lastly, the baseline model without gene expression (black curve, AUROC = 0.68). Geographical validation using the progressive transcriptome model also demonstrates independent, high MF predictive accuracy (green curve, AUROC = 0.97). (F) Heatmap of top recurring Lasso-selected progressive genes for each of controls (left column, CTRL, yellow bar), ET (light green), PV (dark green), and MF (dark blue). Rows indicate gradation in gene expression on a blue (low) to red (high) scale. Columns indicate sample type (CTRL, ET, PV, and MF).

Comment in

References

    1. Love M.I., Huber W., Anders S. Moderated estimation of fold change and dispersion for RNA-seq data with DESeq2. Genome Biol. 2014;15:550. - PMC - PubMed
    1. Friedman J., Hastie T., Tibshirani R. Regularization paths for generalized linear models via coordinate descent. J. Stat. Softw. 2010;33:1–22. - PMC - PubMed
    1. Rondina M.T., Voora D., Simon L.M., Schwertz H., Harper J.F., Lee O., Bhatlekar S.C., Li Q., Eustes A.S., Montenont E. Longitudinal RNA-seq analysis of the repeatability of gene expression and splicing in human platelets identifies a platelet SELP splice QTL. Circ. Res. 2020;126:501–516. - PMC - PubMed
    1. Guo B.B., Linden M.D., Fuller K.A., Phillips M., Mirzai B., Wilson L. Platelets in myeloproliferative neoplasms have a distinct transcript signature in the presence of marrow fibrosis. Br. J. Haematol. 2020;188:272–282. doi: 10.1111/bjh.16152. - DOI - PubMed
    1. Finazzi G., De Stefano V., Barbui T. Are MPNs vascular diseases? Curr. Hematol. Malig. Rep. 2013;8:307–316. - PubMed

Publication types

MeSH terms

Substances

LinkOut - more resources