Regulation of glucose responsive protein (GRP) gene expression by insulin
- PMID: 34755306
- PMCID: PMC8821767
- DOI: 10.1007/s12192-021-01243-z
Regulation of glucose responsive protein (GRP) gene expression by insulin
Abstract
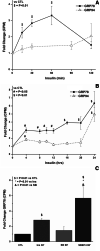
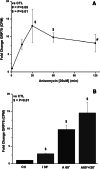
While screening for insulin-induced genes, we identified two members of a family of stress-induced genes referred to as glucose-regulated proteins (GRPs). GRPs are members of the stress-responsive superfamily of genes which also includes heat shock proteins (HSPs). The GRP proteins are not normally heat-inducible, but are overproduced when cells are starved of glucose. The two major GRP proteins, GRP78 and GRP94, are highly conserved among vertebrates. We have found that physiological concentrations of insulin stimulate the transcription of GRP78 and GRP94 in rat H4IIE hepatoma cells. The regulation of GRP78 transcription was rapid, with the first induction within minutes, and a further induction after several hours, and both occurred in the presence of glucose. GRP78 transcription was more greatly induced by insulin in the presence of SB202190, a specific p38-MAPK inhibitor. Transcription of GRP94 was also induced, but only after several hours. Calcimycin (A23187) and anisomycin were used to induce endoplasmic reticulum (ER)/cellular stress, and both induced GRP78 and GRP94 transcription.
Keywords: Anisomycin; Calcimycin; Chaperones; ER stress; Insulin.
© 2021. Cell Stress Society International.
Conflict of interest statement
The authors declare no competing interests.
Figures


Similar articles
-
Transactivation of the grp78 promoter by Ca2+ depletion. A comparative analysis with A23187 and the endoplasmic reticulum Ca(2+)-ATPase inhibitor thapsigargin.J Biol Chem. 1993 Jun 5;268(16):12003-9. J Biol Chem. 1993. PMID: 8505325
-
The glucose-regulated proteins (GRP78 and GRP94): functions, gene regulation, and applications.Crit Rev Eukaryot Gene Expr. 1994;4(1):1-18. doi: 10.1615/critreveukargeneexpr.v4.i1.10. Crit Rev Eukaryot Gene Expr. 1994. PMID: 7987045 Review.
-
Establishment of a Chinese hamster ovary cell line that expresses grp78 antisense transcripts and suppresses A23187 induction of both GRP78 and GRP94.J Cell Physiol. 1992 Dec;153(3):575-82. doi: 10.1002/jcp.1041530319. J Cell Physiol. 1992. PMID: 1332981
-
adapt78, a stress-inducible mRNA, is related to the glucose-regulated protein family of genes.Arch Biochem Biophys. 1999 Aug 1;368(1):67-74. doi: 10.1006/abbi.1998.1059. Arch Biochem Biophys. 1999. PMID: 10415113
-
[Glucose regulated protein 78 kD].Sheng Li Ke Xue Jin Zhan. 2009 Apr;40(2):135-41. Sheng Li Ke Xue Jin Zhan. 2009. PMID: 19558142 Review. Chinese.
Cited by
-
Understanding how high stocking densities and concurrent limited oxygen availability drive social cohesion and adaptive features in regulatory growth, antioxidant defense and lipid metabolism in farmed gilthead sea bream (Sparus aurata).Front Physiol. 2023 Oct 4;14:1272267. doi: 10.3389/fphys.2023.1272267. eCollection 2023. Front Physiol. 2023. PMID: 37869714 Free PMC article.
-
Disrupted Endoplasmic Reticulum Ca2+ Handling: A Harβinger of β-Cell Failure.Biology (Basel). 2024 May 25;13(6):379. doi: 10.3390/biology13060379. Biology (Basel). 2024. PMID: 38927260 Free PMC article. Review.
References
-
- Bennett WL, Keeton AB, Ji S, Xu J, Messina JL. Insulin regulation of growth hormone receptor gene expression: involvement of both the PI-3 kinase and MEK/ERK signaling pathways. Endocrine. 2007;32:219–226. - PubMed
-
- Bole DG, Dowin R, Doriaux M, Jamieson JD. Immunocytochemical localization of BiP to the rough endoplasmic reticulum: evidence for protein sorting by selective retention. J Histochem Cytochem. 1989;37:1817–1823. - PubMed
-
- Bortoff KD, Messina JL. Protein synthesis and insulin regulation of p33 and PEPCK gene expression. Mol Cell Endocrinol. 1992;84:39–46. - PubMed
-
- Bortoff KD, Zhu CC, Hrywna Y, Messina JL. Insulin induction of pip92, CL-6 and novel mRNAs in rat hepatoma cells. Endocrine. 1997;7:199–207. - PubMed
Publication types
MeSH terms
Substances
LinkOut - more resources
Full Text Sources
Miscellaneous

