

Early Adoption of Longitudinal Surveillance for SARS-CoV-2 among Staff in Long-Term Care Facilities: Prevalence, Virologic and Sequence Analysis
- PMID: 34756092
- PMCID: PMC8579921
- DOI: 10.1128/Spectrum.01003-21
Early Adoption of Longitudinal Surveillance for SARS-CoV-2 among Staff in Long-Term Care Facilities: Prevalence, Virologic and Sequence Analysis
Abstract
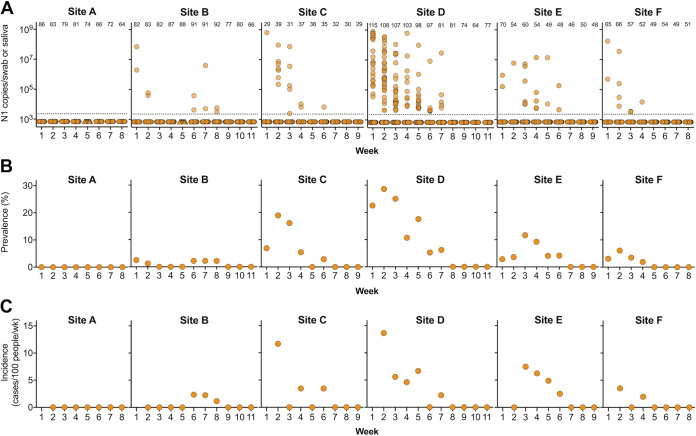
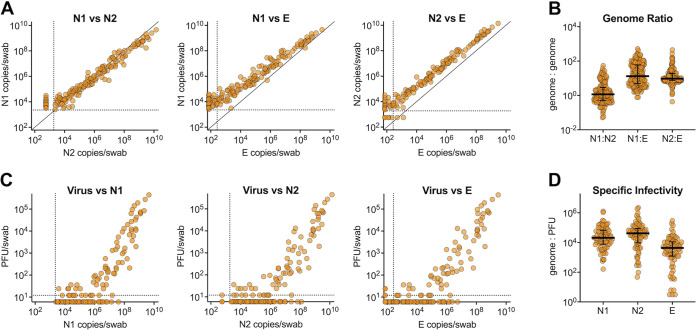
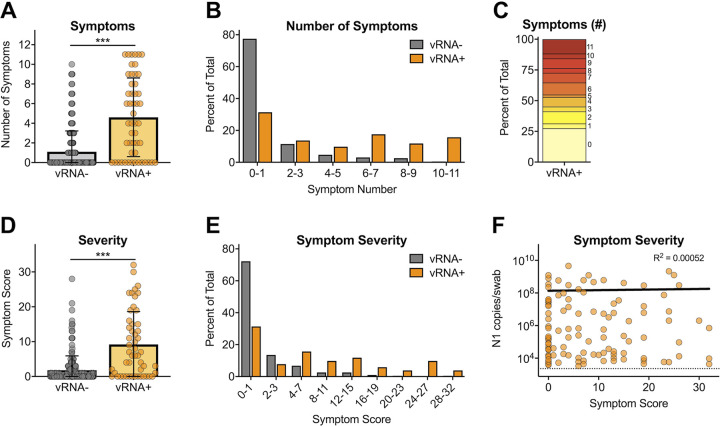
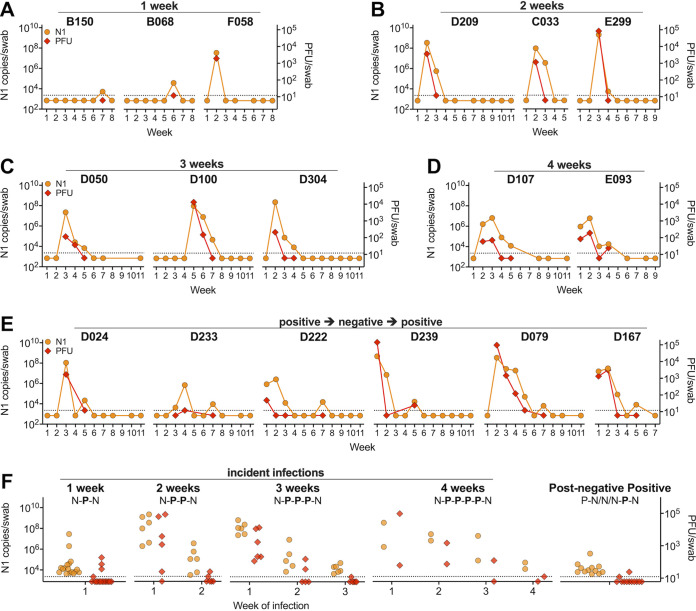
Severe acute respiratory syndrome coronavirus 2 (SARS-CoV-2) emerged in 2019 and has become a major global pathogen in an astonishingly short period of time. The emergence of SARS-CoV-2 has been notable due to its impacts on residents in long-term care facilities (LTCFs). LTCF residents tend to possess several risk factors for severe outcomes of SARS-CoV-2 infection, including advanced age and the presence of comorbidities. Indeed, residents of LTCFs represent approximately 40% of SARS-CoV-2 deaths in the United States. Few studies have focused on the prevalence and transmission dynamics of SARS-CoV-2 among LTCF staff during the early months of the pandemic, prior to mandated surveillance testing. To assess the prevalence and incidence of SARS-CoV-2 among LTCF staff, characterize the extent of asymptomatic infections, and investigate the genomic epidemiology of the virus within these settings, we sampled staff for 8 to 11 weeks at six LTCFs with nasopharyngeal swabs from March through June of 2020. We determined the presence and levels of viral RNA and infectious virus and sequenced 54 nearly complete genomes. Our data revealed that over 50% of infections were asymptomatic/mildly symptomatic and that there was a strongly significant relationship between viral RNA (vRNA) and infectious virus, prolonged infections, and persistent vRNA (4+ weeks) in a subset of individuals, and declining incidence over time. Our data suggest that asymptomatic SARS-CoV-2-infected LTCF staff contributed to virus persistence and transmission within the workplace during the early pandemic period. Genetic epidemiology data generated from samples collected during this period support that SARS-CoV-2 was commonly spread between staff within an LTCF and that multiple-introduction events were less common. IMPORTANCE Our work comprises unique data on the characteristics of SARS-CoV-2 dynamics among staff working at LTCFs in the early months of the SARS-CoV-2 pandemic prior to mandated staff surveillance testing. During this time period, LTCF residents were largely sheltering-in-place. Given that staff were able to leave and return daily and could therefore be a continued source of imported or exported infection, we performed weekly SARS-CoV-2 PCR on nasal swab samples collected from this population. There are limited data from the early months of the pandemic comprising longitudinal surveillance of staff at LTCFs. Our data reveal the surprisingly high level of asymptomatic/presymptomatic infections within this cohort during the early months of the pandemic and show genetic epidemiological analyses that add novel insights into both the origin and transmission of SARS-CoV-2 within LTCFs.
Keywords: COVID-19; SARS-CoV-2; coronavirus; epidemiology; infectious disease; long-term care.
Conflict of interest statement
We declare no conflicts of interest.
Figures
Update of
-
Longitudinal Surveillance for SARS-CoV-2 Among Staff in Six Colorado Long-Term Care Facilities: Epidemiologic, Virologic and Sequence Analysis.medRxiv [Preprint]. 2020 Nov 5:2020.06.08.20125989. doi: 10.1101/2020.06.08.20125989. medRxiv. 2020. Update in: Microbiol Spectr. 2021 Dec 22;9(3):e0100321. doi: 10.1128/Spectrum.01003-21. PMID: 32577700 Free PMC article. Updated. Preprint.
References
-
- Centers for Disease Control and Prevention. 2021. Interim infection prevention and control recommendations to prevent SARS-CoV-2 spread in nursing homes. https://www.cdc.gov/coronavirus/2019-ncov/hcp/long-term-care.html. Accessed July 23, 2021.
-
- Centers for Medicare & Medicaid Services. 2020. COVID-19 nursing home data. The nursing home COVID-19 public file. https://data.cms.gov/stories/s/COVID-19-Nursing-Home-Data/bkwz-xpvg/. Accessed July 23 2021.
-
- The New York Times. June 1, 2021. More than 40% of U.S. coronavirus deaths are linked to nursing homes. https://www.nytimes.com/interactive/2020/us/coronavirus-nursing-homes.html.
-
- McMichael TM, Clark S, Pogosjans S, Kay M, Lewis J, Baer A, Kawakami V, Lukoff MD, Ferro J, Brostrom-Smith C, Riedo FX, Russell D, Hiatt B, Montgomery P, Rao AK, Currie DW, Chow EJ, Tobolowsky F, Bardossy AC, Oakley LP, Jacobs JR, Schwartz NG, Stone N, Reddy SC, Jernigan JA, Honein MA, Clark TA, Duchin JS, Public Health—Seattle & King County, EvergreenHealth, CDC COVID-19 Investigation Team. 2020. COVID-19 in a long-term care facility—King County, Washington, February 27–March 9, 2020. MMWR Morb Mortal Wkly Rep 69:339–342. doi: 10.15585/mmwr.mm6912e1. - DOI - PMC - PubMed
Publication types
MeSH terms
Substances
Grants and funding
LinkOut - more resources
Full Text Sources
Medical
Miscellaneous
