

Community transmission and viral load kinetics of the SARS-CoV-2 delta (B.1.617.2) variant in vaccinated and unvaccinated individuals in the UK: a prospective, longitudinal, cohort study
- PMID: 34756186
- PMCID: PMC8554486
- DOI: 10.1016/S1473-3099(21)00648-4
Community transmission and viral load kinetics of the SARS-CoV-2 delta (B.1.617.2) variant in vaccinated and unvaccinated individuals in the UK: a prospective, longitudinal, cohort study
Erratum in
-
Correction to Lancet Infect Dis 2021; published online Oct 28. https://doi.org/10.1016/S1473-3099(21)00648-4.Lancet Infect Dis. 2021 Dec;21(12):e363. doi: 10.1016/S1473-3099(21)00701-5. Epub 2021 Nov 2. Lancet Infect Dis. 2021. PMID: 34839894 Free PMC article. No abstract available.
Abstract
Background: The SARS-CoV-2 delta (B.1.617.2) variant is highly transmissible and spreading globally, including in populations with high vaccination rates. We aimed to investigate transmission and viral load kinetics in vaccinated and unvaccinated individuals with mild delta variant infection in the community.
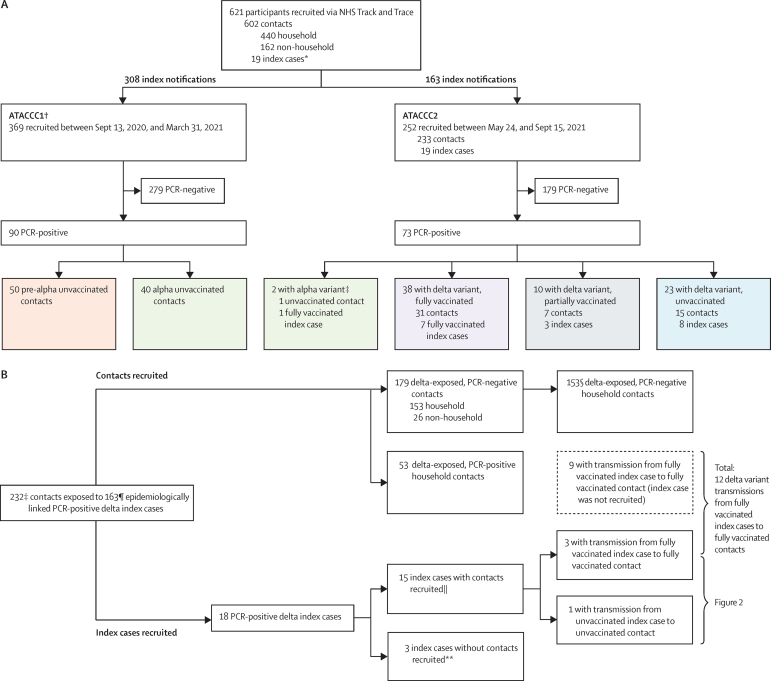
Methods: Between Sept 13, 2020, and Sept 15, 2021, 602 community contacts (identified via the UK contract-tracing system) of 471 UK COVID-19 index cases were recruited to the Assessment of Transmission and Contagiousness of COVID-19 in Contacts cohort study and contributed 8145 upper respiratory tract samples from daily sampling for up to 20 days. Household and non-household exposed contacts aged 5 years or older were eligible for recruitment if they could provide informed consent and agree to self-swabbing of the upper respiratory tract. We analysed transmission risk by vaccination status for 231 contacts exposed to 162 epidemiologically linked delta variant-infected index cases. We compared viral load trajectories from fully vaccinated individuals with delta infection (n=29) with unvaccinated individuals with delta (n=16), alpha (B.1.1.7; n=39), and pre-alpha (n=49) infections. Primary outcomes for the epidemiological analysis were to assess the secondary attack rate (SAR) in household contacts stratified by contact vaccination status and the index cases' vaccination status. Primary outcomes for the viral load kinetics analysis were to detect differences in the peak viral load, viral growth rate, and viral decline rate between participants according to SARS-CoV-2 variant and vaccination status.
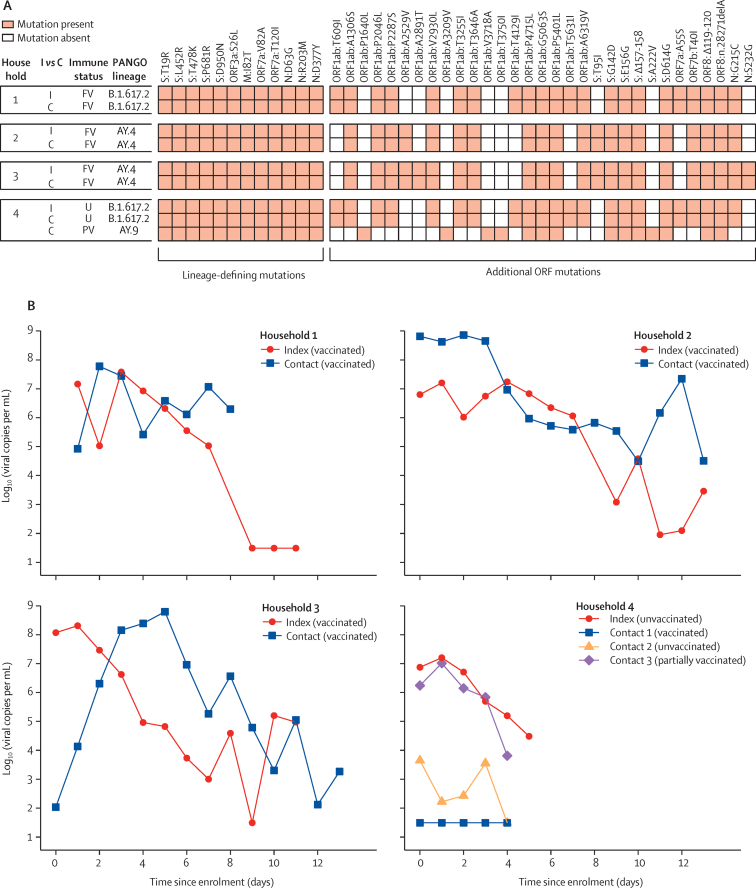
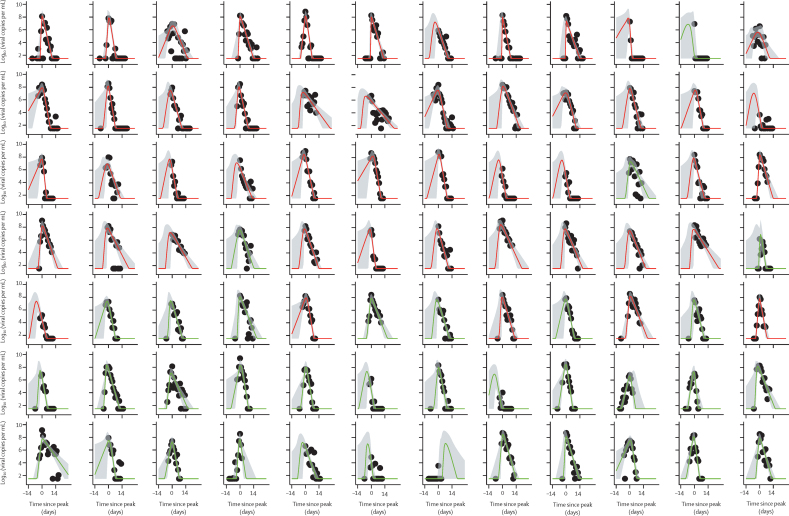
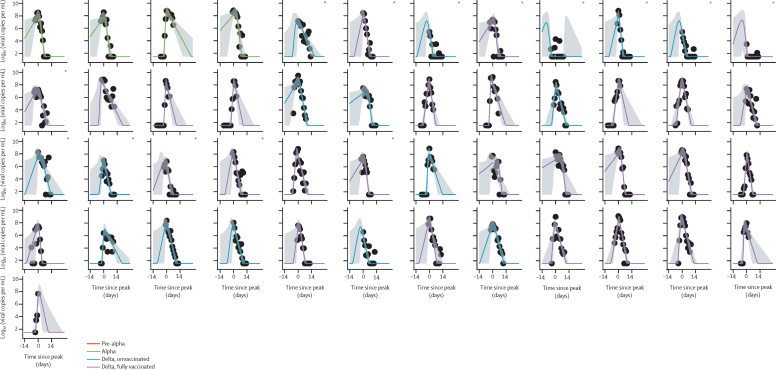
Findings: The SAR in household contacts exposed to the delta variant was 25% (95% CI 18-33) for fully vaccinated individuals compared with 38% (24-53) in unvaccinated individuals. The median time between second vaccine dose and study recruitment in fully vaccinated contacts was longer for infected individuals (median 101 days [IQR 74-120]) than for uninfected individuals (64 days [32-97], p=0·001). SAR among household contacts exposed to fully vaccinated index cases was similar to household contacts exposed to unvaccinated index cases (25% [95% CI 15-35] for vaccinated vs 23% [15-31] for unvaccinated). 12 (39%) of 31 infections in fully vaccinated household contacts arose from fully vaccinated epidemiologically linked index cases, further confirmed by genomic and virological analysis in three index case-contact pairs. Although peak viral load did not differ by vaccination status or variant type, it increased modestly with age (difference of 0·39 [95% credible interval -0·03 to 0·79] in peak log10 viral load per mL between those aged 10 years and 50 years). Fully vaccinated individuals with delta variant infection had a faster (posterior probability >0·84) mean rate of viral load decline (0·95 log10 copies per mL per day) than did unvaccinated individuals with pre-alpha (0·69), alpha (0·82), or delta (0·79) variant infections. Within individuals, faster viral load growth was correlated with higher peak viral load (correlation 0·42 [95% credible interval 0·13 to 0·65]) and slower decline (-0·44 [-0·67 to -0·18]).
Interpretation: Vaccination reduces the risk of delta variant infection and accelerates viral clearance. Nonetheless, fully vaccinated individuals with breakthrough infections have peak viral load similar to unvaccinated cases and can efficiently transmit infection in household settings, including to fully vaccinated contacts. Host-virus interactions early in infection may shape the entire viral trajectory.
Funding: National Institute for Health Research.
Copyright © 2022 Elsevier Ltd. All rights reserved.
Conflict of interest statement
Declaration of interests NMF reports grants from UK Medical Research Council, UK National Institute of Health Research, UK Research and Innovation, Community Jameel, Janssen Pharmaceuticals, the Bill & Melinda Gates Foundation, and Gavi, the Vaccine Alliance; consulting fees from the World Bank; payment or honoraria from the Wellcome Trust; travel expenses from WHO; advisory board participation for Takeda; and is a senior editor of the eLife journal. All other authors declare no competing interests.
Figures
Comment in
-
What is the vaccine effect on reducing transmission in the context of the SARS-CoV-2 delta variant?Lancet Infect Dis. 2022 Feb;22(2):152-153. doi: 10.1016/S1473-3099(21)00690-3. Epub 2021 Oct 29. Lancet Infect Dis. 2022. PMID: 34756187 Free PMC article. No abstract available.
-
Transmissibility of SARS-CoV-2 among fully vaccinated individuals.Lancet Infect Dis. 2022 Jan;22(1):16. doi: 10.1016/S1473-3099(21)00768-4. Lancet Infect Dis. 2022. PMID: 34953540 Free PMC article. No abstract available.
-
Transmissibility of SARS-CoV-2 among fully vaccinated individuals.Lancet Infect Dis. 2022 Jan;22(1):16-17. doi: 10.1016/S1473-3099(21)00763-5. Lancet Infect Dis. 2022. PMID: 34953541 Free PMC article. No abstract available.
-
Transmissibility of SARS-CoV-2 among fully vaccinated individuals.Lancet Infect Dis. 2022 Jan;22(1):17-18. doi: 10.1016/S1473-3099(21)00765-9. Lancet Infect Dis. 2022. PMID: 34953542 Free PMC article. No abstract available.
-
Transmissibility of SARS-CoV-2 among fully vaccinated individuals - Authors' reply.Lancet Infect Dis. 2022 Jan;22(1):18-19. doi: 10.1016/S1473-3099(21)00761-1. Lancet Infect Dis. 2022. PMID: 34953543 Free PMC article. No abstract available.
References
-
- Levine-Tiefenbrun M, Yelin I, Katz R, et al. Initial report of decreased SARS-CoV-2 viral load after inoculation with the BNT162b2 vaccine. Nat Med. 2021;27:790–792. - PubMed
-
- Lyngse FP, Mølbak K, Træholt Franck K, et al. Association between SARS-CoV-2 transmissibility, viral load, and age in households. medRxiv. 2021 doi: 10.1101/2021.02.28.21252608. published online June 4. (preprint). - DOI
Publication types
MeSH terms
Supplementary concepts
Grants and funding
LinkOut - more resources
Full Text Sources
Other Literature Sources
Medical
Miscellaneous
