Review
. 2022 Jan;101(1):47-62.
doi: 10.1016/j.kint.2021.10.014. Epub 2021 Oct 29.

"ADPKD-omics": determinants of cyclic AMP levels in renal epithelial cells

Affiliations
Review

"ADPKD-omics": determinants of cyclic AMP levels in renal epithelial cells

Yash R Mehta et al. Kidney Int. 2022 Jan.

Abstract

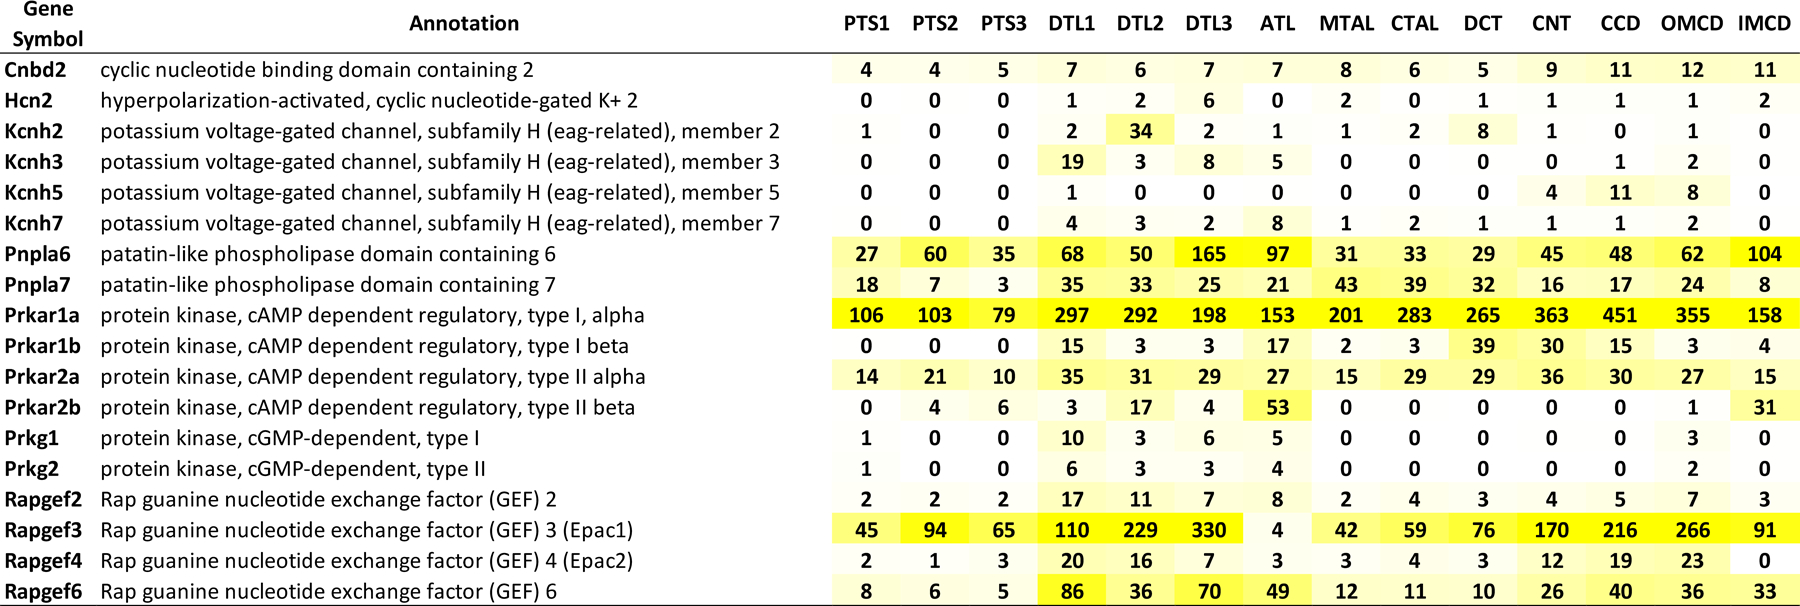
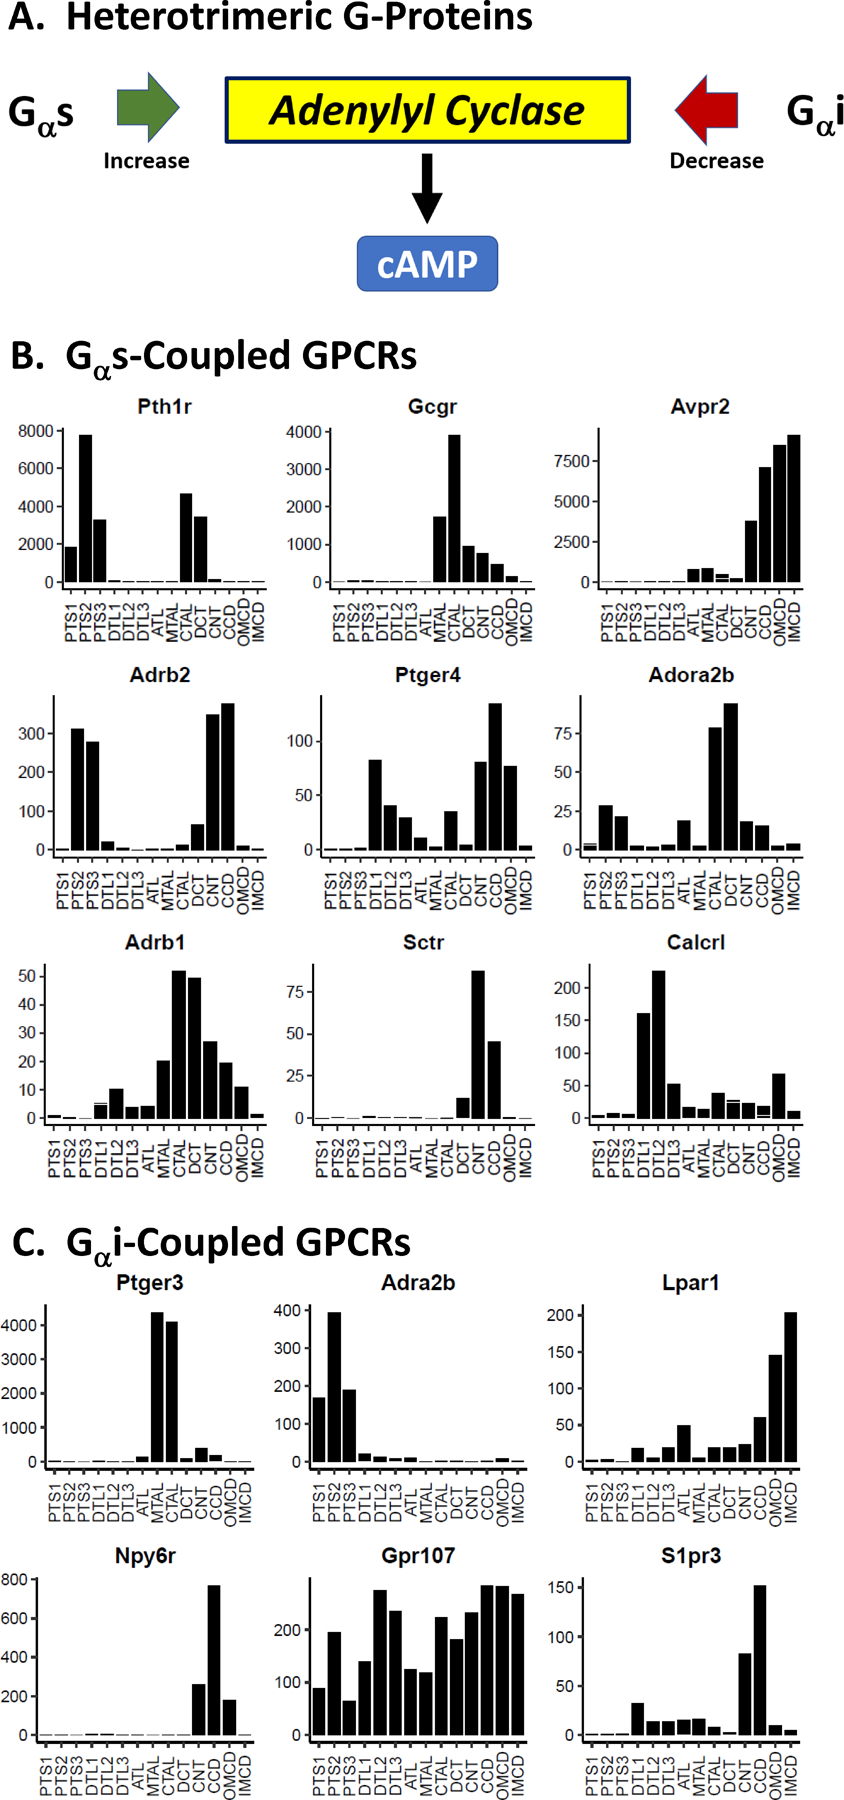
The regulation of cyclic adenosine monophosphate (cAMP) levels in kidney epithelial cells is important in at least 2 groups of disorders, namely water balance disorders and autosomal dominant polycystic kidney disease. Focusing on the latter, we review genes that code for proteins that are determinants of cAMP levels in cells. We identify which of these determinants are expressed in the 14 kidney tubule segments using recently published RNA-sequencing and protein mass spectrometry data ("autosomal dominant polycystic kidney disease-omics"). This includes G protein-coupled receptors, adenylyl cyclases, cyclic nucleotide phosphodiesterases, cAMP transporters, cAMP-binding proteins, regulator of G protein-signaling proteins, G protein-coupled receptor kinases, arrestins, calcium transporters, and calcium-binding proteins. In addition, compartmentalized cAMP signaling in the primary cilium is discussed, and a specialized database of the proteome of the primary cilium of cultured "IMCD3" cells is provided as an online resource (https://esbl.nhlbi.nih.gov/Databases/CiliumProteome/). Overall, this article provides a general resource in the form of a curated list of proteins likely to play roles in determination of cAMP levels in kidney epithelial cells and, therefore, likely to be determinants of progression of autosomal dominant polycystic kidney disease.

Keywords: RNA sequencing; protein mass spectrometry; vaptans; vasopressin.


Figures

Figure 1.
Figure 1.. Determinants of cyclic AMP (cAMP) levels in renal epithelial cells.
A. Mass balance for cyclic AMP. Adenylyl cyclases produce cAMP; cyclic nucleotide phosphodiesterases consume cAMP; certain cAMP efflux transporters move cAMP out of cells. Regulatory factors are summarized on the right. B. Adenylyl cyclase gene expression along the renal tubule. C. Cyclic nucleotide phosphodiesterase (PDE) expression along the renal tubule. Only cAMP-selective PDEs are shown. D. Cyclic nucleotide transporting ABC ATPases that transport cAMP out of cells. Yellow, mRNA levels; green, protein levels. Gene products are designated by unitalicized official gene symbols for both mRNA and proteins. Renal tubule segments are designated by standard abbreviations: S1, first segment of proximal tubule; S2, second segment of proximal tubule; S3, third segment of proximal tubule; DTL1, thin descending limb of short-looped nephrons; DTL2, outer medullary thin descending limb of long-looped nephrons; DTL3, inner medullary thin descending limb of long-looped nephrons; ATL, ascending thin limb; mTAL, medullary thick ascending limb; cTAL, cortical thick ascending limb; DCT, distal convoluted tubule; CNT, connecting tubule; CCD, cortical collecting duct; OMCD, outer medullary collecting duct; IMCD, inner medullary collecting duct.
Figure 2.
Figure 2.. Cyclic AMP binding proteins.
Cyclic AMP binding domain containing protein expression throughout the renal tubule. Renal tubule segments are designated by standard abbreviations: PTS1, first segment of proximal tubule; PTS2, second segment of proximal tubule; PTS3, third segment of proximal tubule; DTL1, thin descending limb of short-looped nephrons; DTL2, outer medullary thin descending limb of long-looped nephrons; DTL3, inner medullary thin descending limb of long-looped nephrons; ATL, ascending thin limb; mTAL, medullary thick ascending limb; cTAL, cortical thick ascending limb; DCT, distal convoluted tubule; CNT, connecting tubule; CCD, cortical collecting duct; OMCD, outer medullary collecting duct; IMCD, inner medullary collecting duct.
Figure 3.
Figure 3.. GPCRs that couple to Gαs or Gαi along the renal tubule.
A. Gαs coupled receptors increase cAMP in renal tubule cells, while or Gαi coupled receptors decrease cAMP. B. Distributions of major Gαs coupled receptors along the renal tubule. Values represent mRNA levels in TPM for microdissected tubules measured using RNA-Seq. C. Distributions of major Gαi coupled receptors along the renal tubule. Values represent mRNA levels in TPM for microdissected tubules measured using RNA-Seq. Data gleaned from Chen et al. . Renal tubule segments are designated by standard abbreviations: PTS1, first segment of proximal tubule; PTS2, second segment of proximal tubule; PTS3, third segment of proximal tubule; DTL1, thin descending limb of short-looped nephrons; DTL2, outer medullary thin descending limb of long-looped nephrons; DTL3, inner medullary thin descending limb of long-looped nephrons; ATL, ascending thin limb; mTAL, medullary thick ascending limb; cTAL, cortical thick ascending limb; DCT, distal convoluted tubule; CNT, connecting tubule; CCD, cortical collecting duct; OMCD, outer medullary collecting duct; IMCD, inner medullary collecting duct.
Figure 4.
Figure 4.. GPCRs that regulate adenylyl cyclase activity in collecting duct principal cells.
A. The heterotrimeric G protein-coupled receptors that regulate the chief adenylyl cyclase, adenylyl cyclase 6 (Adcy6) are shown. Avpr2, Calcrl, and Ptger4 all show stimulation of adcy6 while Adra2b, Npy6r, Lpar1, and Gpr107 show inhibition. B. Table depicting the distribution of the GPCRs in different collecting duct cell types, α intercalated, β intercalated, and principal cells is shown.
Figure 5.
Figure 5.. RGS Protein expression.
Various RGS proteins are listed along with their abundance along the renal tubule. Renal tubule segments are designated by standard abbreviations: PTS1, first segment of proximal tubule; PTS2, second segment of proximal tubule; PTS3, third segment of proximal tubule; DTL1, thin descending limb of short-looped nephrons; DTL2, outer medullary thin descending limb of long-looped nephrons; DTL3, inner medullary thin descending limb of long-looped nephrons; ATL, ascending thin limb; mTAL, medullary thick ascending limb; cTAL, cortical thick ascending limb; DCT, distal convoluted tubule; CNT, connecting tubule; CCD, cortical collecting duct; OMCD, outer medullary collecting duct; IMCD, inner medullary collecting duct.
Figure 6.
Figure 6.. Expression of G protein receptor kinases and arrestins.
A. G protein receptor kinases phosphorylate the carboxyl end of G proteins reveptors and their abundances is shown throughout the renal tubule. B. The phosphorylation of carboxyl end creates a binding site or arrestin. The abundance of arrestin is shown throughout the renal tubule. Renal tubule segments are designated by standard abbreviations: PTS1, first segment of proximal tubule; PTS2, second segment of proximal tubule; PTS3, third segment of proximal tubule; DTL1, thin descending limb of short-looped nephrons; DTL2, outer medullary thin descending limb of long-looped nephrons; DTL3, inner medullary thin descending limb of long-looped nephrons; ATL, ascending thin limb; mTAL, medullary thick ascending limb; cTAL, cortical thick ascending limb; DCT, distal convoluted tubule; CNT, connecting tubule; CCD, cortical collecting duct; OMCD, outer medullary collecting duct; IMCD, inner medullary collecting duct.
Figure 7.
Figure 7.. Vasopressin can trigger proliferative or anti-proliferative responses depending on the balance between β-arrestin and G protein signaling.
See text for details.
Figure 8.
Figure 8.. Determinants of cytosolic free calcium.
A. Free calcium in the cytosol is regulated by the transporters in endoplasmic reticulum, mitochondrion, plasma membrane, and endosomes. B. The abundance of various ER calcium transporters along the renal tubule is shown. C. The mitochondria calcium transporters are listed alongside their abundances in different parts of the renal tubule. Mitochondrial calcium regulation occurs to maintain the mitrochondrial function and changes to the cytosolic free calcium is a byproduct. D. The distribution of plasma membrane calcium ATPases along the renal tubule are shown. These transporters help maintain a low intracellular calcium concentration. E. The abundances of various sodium dependent calcium exchangers are shown. F. The plasma membrane and endosomal calcium channels are shown alongside their abundances. Renal tubule segments are designated by standard abbreviations: PTS1, first segment of proximal tubule; PTS2, second segment of proximal tubule; PTS3, third segment of proximal tubule; DTL1, thin descending limb of short-looped nephrons; DTL2, outer medullary thin descending limb of long-looped nephrons; DTL3, inner medullary thin descending limb of long-looped nephrons; ATL, ascending thin limb; mTAL, medullary thick ascending limb; cTAL, cortical thick ascending limb; DCT, distal convoluted tubule; CNT, connecting tubule; CCD, cortical collecting duct; OMCD, outer medullary collecting duct; IMCD, inner medullary collecting duct.
Figure 9.
Figure 9.. Distributions of transcripts coding for major calcium binding proteins along the renal tubule.
Data are from Chen et al. . Renal tubule segments are designated by standard abbreviations: PTS1, first segment of proximal tubule; PTS2, second segment of proximal tubule; PTS3, third segment of proximal tubule; DTL1, thin descending limb of short-looped nephrons; DTL2, outer medullary thin descending limb of long-looped nephrons; DTL3, inner medullary thin descending limb of long-looped nephrons; ATL, ascending thin limb; mTAL, medullary thick ascending limb; cTAL, cortical thick ascending limb; DCT, distal convoluted tubule; CNT, connecting tubule; CCD, cortical collecting duct; OMCD, outer medullary collecting duct; IMCD, inner medullary collecting duct.
Figure 10.
Figure 10.. Determinants of cyclic AMP levels in renal collecting duct principal cells.
Cyclic AMP in a cell or a subcellular region is defined as in terms of mass balance composed of production by adenylyl cyclases, degradation by cyclic nucleotide phosphodiesterases and efflux via ABC ATPases. Specific genes and proteins involved are indicated for collecting duct principal cells; however, similar schemas apply to other cell types such as thick ascending limb cells or distal convoluted tubule cell, which can also be sources of cysts in ADPKD. See text for details.

References

    1. Bergmann C, Guay-Woodford LM, Harris PC, et al. Polycystic kidney disease. Nat Rev Dis Primers 2018; 4: 50. - PMC - PubMed
    1. Ma M, Gallagher AR, Somlo S. Ciliary Mechanisms of Cyst Formation in Polycystic Kidney Disease. Cold Spring Harb Perspect Biol 2017; 9. - PMC - PubMed
    1. Fedeles SV, Gallagher AR, Somlo S. Polycystin-1: a master regulator of intersecting cystic pathways. Trends Mol Med 2014; 20: 251–260. - PMC - PubMed
    1. Padovano V, Podrini C, Boletta A, et al. Metabolism and mitochondria in polycystic kidney disease research and therapy. Nat Rev Nephrol 2018; 14: 678–687. - PubMed
    1. Zhang Y, Reif G, Wallace DP. Extracellular matrix, integrins, and focal adhesion signaling in polycystic kidney disease. Cell Signal 2020; 72: 109646. - PMC - PubMed

Publication types

MeSH terms

LinkOut - more resources