. 2021 Nov 1;10(13):14.
doi: 10.1167/tvst.10.13.14.

Normative Data of Ocular Biometry, Optical Coherence Tomography, and Electrophysiology Conducted for Cynomolgus Macaque Monkeys

Affiliations

Normative Data of Ocular Biometry, Optical Coherence Tomography, and Electrophysiology Conducted for Cynomolgus Macaque Monkeys

Kwang-Eon Choi et al. Transl Vis Sci Technol. .

Abstract

Purpose: To present normative data of optical coherence tomography (OCT) parameters, electrophysiological tests, and optical biometry conducted for cynomolgus monkeys.

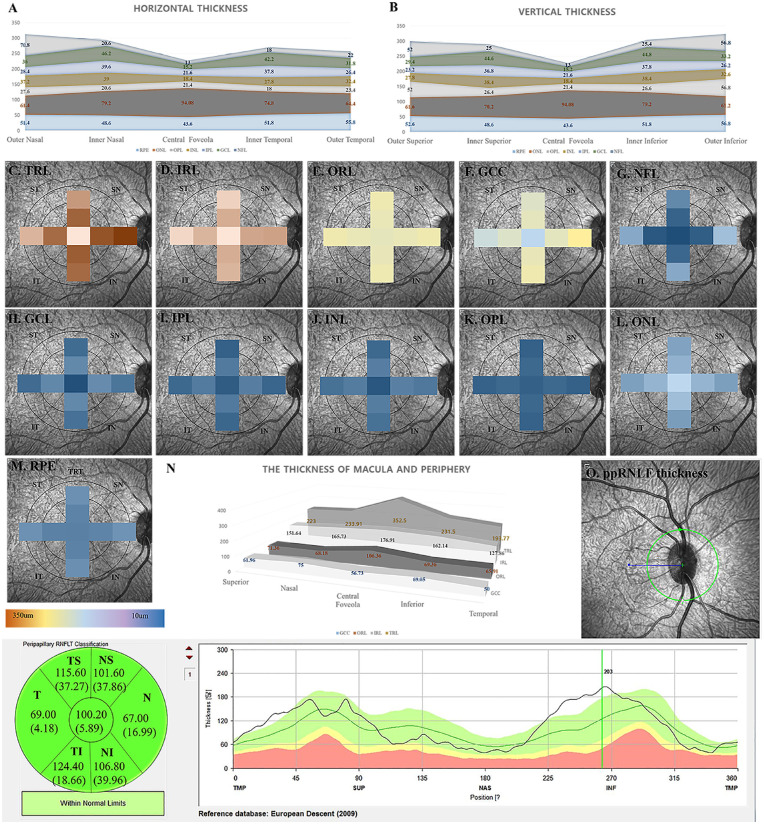
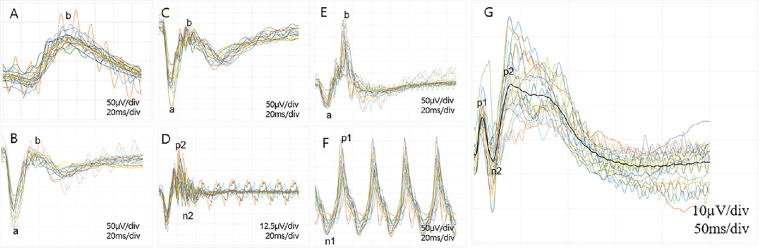
Methods: Multimodal examinations were performed for 11 adult cynomolgus monkeys (Macaca fascicularis, weighing 2.6-7.5 kg, aged 45-99 months). A-scan biometry was performed to measure ocular biometry. OCT images were obtained at 30° and 55°. After the pupils were fully dilated, electroretinogram (ERG) and visual evoked potentials (VEP) were recorded with a commercial system using a contact lens electrode.

Results: All cynomolgus monkeys were males. The mean axial length was 17.92 ± 0.34 mm. The central total retinal layer (TRL) and subfoveal choroidal thicknesses were 286.27 ± 18.43 and 234.73 ± 53.93 µm, respectively. The TRL and nerve fiber layer thickness was greater in the nasal than in other quadrants in the Early Treatment Diabetic Retinopathy Study circle in the macula. Peripheral TRL and ganglion cell complex thickness on the temporal outside the vascular arcades were lower than on the other sides. The peak latency of a-wave and b-wave in scotopic and photopic 3.0 ERG was 14.78 ± 1.00 and 32.89 ± 1.81 ms, and 12.91 ± 1.03 and 31.79 ± 2.16 ms, respectively. The n2 wave peak latency of VEP was 15.21 ± 8.07 ms. The a-wave peak latency of ERG and the n2 wave peak latency of VEP negatively correlated with age.

Conclusions: The normative ocular biometric, electrophysiological test, and OCT parametric data of cynomolgus monkeys could serve as reference values for further preclinical studies.

Translational relevance: We present normative data of cynomolgus monkeys' eyes, an adequate animal model for preclinical studies.


Conflict of interest statement

Disclosure: K.-E. Choi, None; V.T.Q. Anh, None; C. Yun, None; Y.-J. Kim, None; H. Jung, None; H. Eom, None; D. Shin, None; S.-W. Kim, None

Figures

Figure 1.
Figure 1.
Heat maps and comparison of each retinal sublayer's thickness and the mean thickness of peripapillary retinal nerve fiber layers. (A) The comparison of each retinal sublayer's horizontal thickness is shown. Nasal TRL, NFL thickness in the inner ring is thicker than temporal thicknesses. Nasal TRL, IRL, GCC, and NFL thickness in the outer ring are thicker than temporal thicknesses. (B) The comparison of each retinal sublayer's vertical thickness is shown. Inferior TRL, IRL, GCC, and NFL thicknesses in the outer ring are thicker than superior thicknesses. (C–M) The heat maps of each sublayer in the ETDRS circle are shown. (C) The TRL thickness is shown. In the 1- to 3-mm zone, the nasal TRL is thicker than the temporal TRL. In the 3- to 6-mm zone, the thickness is different among the four quadrants, thickest at nasal, followed by inferior, superior, and temporal. (D) The IRL thickness is shown. In the 3- to 6-mm zone, the thickness differs among the four quadrants, thickest at nasal, inferior, superior, and temporal (no significant difference between superior and temporal). (E) The ORL thickness is shown. There is no difference between the ORL thickness among the four quadrants in the 1- to 3- and 3- to 6-mm zones. (F) The GCC thickness. In the 3- to 6-mm zone, the GCC thickness differs among the four quadrants, thickest at nasal, followed by inferior, superior, and temporal. (G) The nerve fiber layer (NFL) thickness is shown. In the 3- to 6-mm zone, the NFL thickness is different among the four quadrants, thickest at nasal, followed by inferior, temporal, and superior (no significant difference between at inferior and at nasal). (H) The GCL thickness is shown. No difference among the four quadrants is observed. (I) The IPL thickness is shown. In the 3- to 6-mm zone, the superior IPL thickness is thinner than other IPL thicknesses. (J) The INL thickness is shown. In the 3- to 6-mm zone, the INL thickness is different among the four quadrants, thickest at nasal, followed by inferior, temporal, and superior (no significant difference between at inferior and at nasal). (K) The OPL thickness is shown. No difference among the four quadrants is observed. (L) The ONL thickness is shown. No difference among the four quadrants is observed. (M) The RPE thickness is shown. No difference among the four quadrants is observed. (N) The peripheral thickness of GCC, ORL, IRL, and TRL are thinner than those of the foveola. (O) The peripapillary retinal NFL (ppRNFL) thickness is shown. Superior and temporal ppRNFL thickness is thicker than nasal and temporal ppRNFL thickness.
Figure 2.
Figure 2.
Trace map of the full-field retinography and flash VEPs in all cynomolgus monkeys. (A) A scotopic 0.01 ERG showing the mean peak latency and amplitudes of b-wave (71.99 ± 5.23 ms and 96.36 ± 24.46 µV, respectively). (B) A scotopic 3.0 ERG showing the mean peak latency of the a-wave and b-wave (14.78 ± 1.00 and 32.89 ± 1.81 ms, respectively). The amplitudes of the a-wave and b-wave are 128.36 ± 31.68 and 132.71 ± 26.34 µV, respectively. (C) A scotopic 10.0 ERG showing the mean peak latency of the a-wave and b-wave (13.98 ± 0.94 and 13.98 ± 0.94 ms, respectively). The mean amplitudes of the a-wave and b-wave are 90.97 ± 25.09 and 79.70 ± 19.08 µV, respectively. (D) The oscillatory potential with a mean amplitude of 32.34 ± 11.62 µV. (E) A photopic 3.0 ERG showing the mean peak latency of the a-wave and b-wave (12.91 ± 1.03 and 31.79 ± 2.16 ms, respectively). The mean amplitudes of the a-wave and b-wave are 27.13 ± 7.39 and 79.86 ± 19.21 µV, respectively. (F) The 30-Hz flicker ERG with a mean amplitude of 99.63 ± 26.21 µV. (G) The trace map of flash VEP is shown. The p1-wave, the n2-wave, and p-2 wave peak latencies were 18.59 ± 3.24, 39.71 ± 6.71, and 79.76 ± 8.41 ms, respectively.

References

    1. Chang B. Mouse models for studies of retinal degeneration and diseases. Methods Mol Biol. 2013; 935: 27–39. - PMC - PubMed
    1. Koh AE, Alsaeedi HA, Rashid MBA, et al. .. Retinal degeneration rat model: a study on the structural and functional changes in the retina following injection of sodium iodate. J Photochem Photobiol B. 2019; 196: 111514. - PubMed
    1. Jeon CJ, Strettoi E, Masland RH.. The major cell populations of the mouse retina. J Neurosci Res. 1998; 18: 8936–8946. - PMC - PubMed
    1. Lozano DC, Twa MD.. Development of a rat schematic eye from in vivo biometry and the correction of lateral magnification in SD-OCT imaging. Invest Ophthalmol Vis Sci. 2013; 54: 6446–6455. - PMC - PubMed
    1. Freeberg FE, Nixon GA, Reer PJ, et al. .. Human and rabbit eye responses to chemical insult. Fundam Appl Toxicol. 1986; 7: 626–634. - PubMed

Publication types