. 2022 Jan 25;88(2):e0211721.
doi: 10.1128/AEM.02117-21. Epub 2021 Nov 10.

Subcellular Localization Defects Characterize Ribose-Binding Mutant Proteins with New Ligand Properties in Escherichia coli

Affiliations

Subcellular Localization Defects Characterize Ribose-Binding Mutant Proteins with New Ligand Properties in Escherichia coli

Diogo Tavares et al. Appl Environ Microbiol. .

Abstract

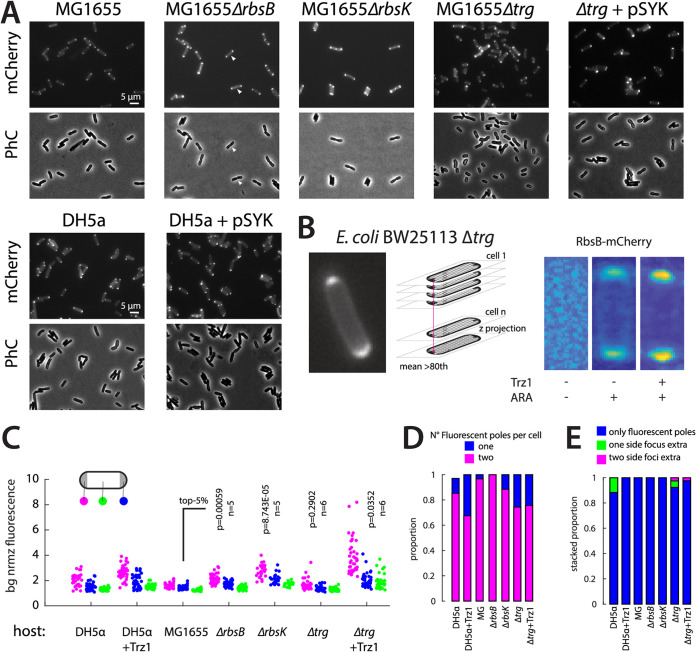
Periplasmic binding proteins have been previously proclaimed as a general scaffold to design sensor proteins with new recognition specificities for nonnatural compounds. Such proteins can be integrated in bacterial bioreporter chassis with hybrid chemoreceptors to produce a concentration-dependent signal after ligand binding to the sensor cell. However, computationally designed new ligand-binding properties ignore the more general properties of periplasmic binding proteins, such as their periplasmic translocation, dynamic transition of open and closed forms, and interactions with membrane receptors. In order to better understand the roles of such general properties in periplasmic signaling behavior, we studied the subcellular localization of ribose-binding protein (RbsB) in Escherichia coli in comparison to a recently evolved set of mutants designed to bind 1,3-cyclohexanediol. As proxies for localization, we calibrated and deployed C-terminal end mCherry fluorescent protein fusions. Whereas RbsB-mCherry coherently localized to the periplasmic space and accumulated in (periplasmic) polar regions depending on chemoreceptor availability, mutant RbsB-mCherry expression resulted in high fluorescence cell-to-cell variability. This resulted in higher proportions of cells devoid of clear polar foci and of cells with multiple fluorescent foci elsewhere, suggesting poorer translocation, periplasmic autoaggregation, and mislocalization. Analysis of RbsB mutants and mutant libraries at different stages of directed evolution suggested overall improvement to more RbsB-wild-type-like characteristics, which was corroborated by structure predictions. Our results show that defects in periplasmic localization of mutant RbsB proteins partly explain their poor sensing performance. Future efforts should be directed to predicting or selecting secondary mutations outside computationally designed binding pockets, taking folding, translocation, and receptor interactions into account. IMPORTANCE Biosensor engineering relies on transcription factors or signaling proteins to provide the actual sensory functions for the target chemicals. Since for many compounds there are no natural sensory proteins, there is a general interest in methods that could unlock routes to obtaining new ligand-binding properties. Bacterial periplasmic binding proteins (PBPs) form an interesting family of proteins to explore for this purpose, because there is a large natural variety suggesting evolutionary trajectories to bind new ligands. PBPs are conserved and amenable to accurate computational binding pocket predictions. However, studying ribose-binding protein in Escherichia coli, we discovered that designed variants have defects in their proper localization in the cell, which can impair appropriate sensor signaling. This indicates that functional sensing capacity of PBPs cannot be obtained solely through computational design of the ligand-binding pocket but must take other properties of the protein into account, which are currently very difficult to predict.

Keywords: biosensing; fluorescent protein fusion; protein localization.


Conflict of interest statement

The authors declare no conflict of interest.

Figures

FIG 1
FIG 1
Effect of fluorescent protein fusion positioning and signal sequences on RbsB expression and translocation in E. coli DH5α. Panels show expression of RbsB fused with N-terminal TorA signal sequence and C-terminal mCherry (A), N-terminal TorAss and mCherry (B), RbsB fused with N-terminal RbsB signal sequence and C-terminal mCherry (C), N-terminal RbsBss and mCherry (D), RbsB fused with N-terminal RbsBss and C-terminal mCherry but without l-arabinose induction (E), and without RbsB signal sequence but with C-terminal mCherry in the presence of l-arabinose (F). Fusion constructs are schematically drawn on top of each micrograph (not to scale) and were all expressed under the control of the arabinose-inducible PBAD promoter. Cells were incubated for 3 h and expression of fusion protein was induced with 0.5% l-arabinose (except in panel E). Hooked arrows indicate promoters and transcription direction. PhC, phase-contrast. mCHE, mCherry fluorescence. All fluorescence images (mCHE) are scaled to the same intensity (low-high).
FIG 2
FIG 2
Ribose-dependent induction of the Trz1-ompC′::gfp signaling chain in E. coli ΔrbsB by different plasmid-expressed RbsB/mCherry fusion constructs. (A) Principle of ribose-dependent RbsB-Trz1 induction of gfp from the ompC promoter. p, periplasmic space; c, cytoplasm. Trz1 is a hybrid receptor with Trg periplasmic and EnvZ cytoplasmic parts. (B) Fold induction of GFP fluorescence in the presence of 0.1 mM ribose for 2.5 h compared to the case with no ribose. Bars show the mean ratio from 12 biological replicates (black dots). Letters indicate significance groups in ANOVA followed by post hoc Tukey test (Pa,b < 0.001). As a comparison, induction by RbsB without mCherry tag but expressed from the constitutive PAA promoter is shown. (C) Effect of ribose addition on mCherry signal intensities for the RbsBss-RbsB-mCherry fusion construct. Bars indicate the mean of population fluorescence means in flow cytometry across 12 replicates (black dots) in the absence (light gray) or presence (dark gray) of ribose. P value was derived from two-sided t test (n = 12). ns, not significant (P > 0.05).
FIG 3
FIG 3
RbsB-mCherry localization in different E. coli backgrounds. (A) Representative cell micrographs in mCherry fluorescence and phase-contrast. Fluorescence images are autocontrasted and cropped. (B) Detail of periplasmic space and polar region fluorescence of RbsB-mCherry in E. coli Δtrg background. Shown are a z-projection of the mean top 20 percentiles per pixel across all cells in a biological replicate (n = 103) standardized to the same cell length and width and a heat map representation of fluorescence intensity in the cells in presence or absence of arabinose (ARA) or coexpressed Trz1. Blue and orange colors represent low and high intensities, respectively. Scale is not comparable between heat maps. (C) Polar (cyan and blue) and mid-cell (green) fluorescence from RbsB-mCherry normalized for image background (bg nrmz) of individual cells in one technical replicate in different E. coli hosts, manually segmented (each dot a single cell). P values compare the extracted mean top 5% pixel values (representative for foci) from automated segmentation across 5 or 6 biological replicates (each with 10 images) of that host to MG1655 (unpaired one-sided t test). (D) Manually extracted proportions of cells in panel C with one or both fluorescent polar regions. (E) Proportions of cells with only polar foci and those with one or two additional foci outside the cell pole regions.
FIG 4
FIG 4
Aberrant localization behavior of DT mutant-mCherry fusions in E. coli hosts. (A and B) Manually segmented cells of one technical replicate showing background normalized polar fluorescence (cyan and blue) or mid-cell fluorescence (green) in E. coli Δtrg or Δtrg with coexpressed pSYK1 plasmid (Trz1 expression). Note the higher cell-cell variability and higher cell background fluorescence in many of the DT mutants in comparison to wild-type RbsB (WT). (C) Mean top 5% fluorescence pixel extraction as proxy for manual polar focus determination. Bars show replicate means (dots are individual replicates) for the indicated E. coli host and expressed wild-type RbsB-mCherry (n = approximately 1,000 cells per replicate). (D) Comparison of mean top 5% and cell background (i.e., median fluorescence) in E. coli MG1655 ΔrbsB or ΔrbsK of expressed wild-type RbsB- to DT016- and DT022-mCherry. Bars represent replicate means (dots are individual replicate values), each from 200 to 1,000 cells. P values are from unpaired one-sided t test comparisons to wild-type RbsB-mCherry in that host (red, top 5% comparisons; blue, cell background). (E) Proportions of cells with zero, one, or both polar fluorescent foci for the various expressed DT mutant- or RbsB-mCherry in different E. coli hosts, obtained from the manually segmented images. (F) Same as panel E, but for the proportions of cells with additional foci.
FIG 5
FIG 5
Wild-type-like improvement in successive DT mutant error-prone libraries. (A) Representative images (autocontrasted and cropped) of RbsB-mCherry-expressing E. coli DH5α cells and library samples of the first-generation (epDT016) and second-generation (epDT021 and epDT022) error-prone libraries. Note the (still) large fraction of individual cells in error-prone libraries that have completely lost DT-mCherry fluorescence. (B) Estimation of the proportion of cells behaving like E. coli DH5α expressing RbsB-mCherry, based on similar cell width, low cell background, and high polar fluorescence and absence of side foci on automatically segmented cells from images. Bars are replicate means with black dots representing single replicate values (combined from up to 10 technical replicates, typically 200 to 1,000 cells). “+WT” refers to proportions of spiked E. coli DH5α expressing RbsB-mCherry to the respective error-prone library. (C) Proportions of cells within cell width range and with only detectable polar foci for E. coli DH5α expressing RbsB-mCherry (WT), DT022-mCherry, or DT038-mCherry. Bars are replicate means with dots representing single replicate values. P values were derived from unpaired one-side t test on the shown grouped individual biological replicates.

References

    1. Chu BCH, Vogel HJ. 2011. A structural and functional analysis of type III periplasmic and substrate binding proteins: their role in bacterial siderophore and heme transport. Biol Chem 392:39–52. 10.1515/BC.2011.012. - DOI - PubMed
    1. Berntsson RPA, Smits SHJ, Schmitt L, Slotboom D-J, Poolman B. 2010. A structural classification of substrate-binding proteins. FEBS Lett 584:2606–2617. 10.1016/j.febslet.2010.04.043. - DOI - PubMed
    1. Matilla MA, Ortega A, Krell T. 2021. The role of solute binding proteins in signal transduction. Comput Struct Biotechnol J 19:1786–1805. 10.1016/j.csbj.2021.03.029. - DOI - PMC - PubMed
    1. Quiocho FA, Ledvina PS. 1996. Atomic structure and specificity of bacterial periplasmic receptors for active transport and chemotaxis: variation of common themes. Mol Microbiol 20:17–25. 10.1111/j.1365-2958.1996.tb02484.x. - DOI - PubMed
    1. Fernandez M, Rico-Jimenez M, Ortega A, Daddaoua A, Garcia Garcia AI, Martin-Mora D, Torres NM, Tajuelo A, Matilla MA, Krell T. 2019. Determination of ligand profiles for Pseudomonas aeruginosa solute binding proteins. Int J Mol Sci 20:5156. 10.3390/ijms20205156. - DOI - PMC - PubMed

Publication types

MeSH terms