. 2021 Nov 1;148(21):dev199940.
doi: 10.1242/dev.199940. Epub 2021 Nov 10.

Alveolar progenitor differentiation and lactation depends on paracrine inhibition of notch via ROBO1/CTNNB1/JAG1

Affiliations

Alveolar progenitor differentiation and lactation depends on paracrine inhibition of notch via ROBO1/CTNNB1/JAG1

Oscar Cazares et al. Development. .

Abstract

In the mammary gland, how alveolar progenitor cells are recruited to fuel tissue growth with each estrus cycle and pregnancy remains poorly understood. Here, we identify a regulatory pathway that controls alveolar progenitor differentiation and lactation by governing Notch activation in mouse. Loss of Robo1 in the mammary gland epithelium activates Notch signaling, which expands the alveolar progenitor cell population at the expense of alveolar differentiation, resulting in compromised lactation. ROBO1 is expressed in both luminal and basal cells, but loss of Robo1 in basal cells results in the luminal differentiation defect. In the basal compartment, ROBO1 inhibits the expression of Notch ligand Jag1 by regulating β-catenin (CTNNB1), which binds the Jag1 promoter. Together, our studies reveal how ROBO1/CTTNB1/JAG1 signaling in the basal compartment exerts paracrine control of Notch signaling in the luminal compartment to regulate alveolar differentiation during pregnancy.

Keywords: Alveolar progenitor; Beta-catenin; Jagged1; Mammary gland; Mouse; Notch; Robo.


Conflict of interest statement

Competing interests L.H., O.C. and S.C. have applied for patents related to this paper. L.H. receives research funding from Zoetis Inc. C.S. and J.W.B., are employees of Zoetis Inc.

Figures

Fig. 1.
Fig. 1.
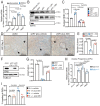
Loss of Robo1 diminishes alveologenesis and lactogenesis. (A) Volcano plot of significantly altered mRNAs involved in alveologenesis. (B) Representative confocal image of CUBIC cleared alveoli from 7.5 DP Robo1+/+ tissue shows ROBO1 (magenta; white arrow) with basal marker smooth muscle actin (ACTA2; green), and ROBO1 (magenta; white arrowhead) in underlying luminal cells. (C-F) Representative H&E-stained whole-mount sections of 17.5 DP Robo1+/+ (C) and Robo1−/− (D) littermates. Insets show magnified images of boxed areas. Arrows identify compact Robo1−/− alveoli (D). Quantification of fat pad filling (E) and average alveolar size (F) show reduced Robo1−/− alveologenesis. (G,H) Representative confocal images (G) and quantification (H) show reduced milk (magenta) with ACTA2 (green) in 17.5 DP Robo1−/− MGs. (I) RT-qPCR on lactation day 1 (LD1) Robo1−/− MGs shows reduced milk protein gene expression: whey acidic protein (WAP), alpha-lactalbumin (Lalba) and xanthine dehydrogenase (XDH). (J) Mating strategy to measure milk production. (K) Images of pups at LD1, boxed area shows reduced stomach milk in pup fed by Robo1−/− dam. (L) Quantification shows pups fed by Robo1−/− dam gain less weight (two-way ANOVA followed by a two-tailed, unpaired t-test). n=3 independent experiments, five images/n E,F,H,I. Data are represented as mean±s.e.m. Statistical analysis was performed using a two-tailed, unpaired Student's t-test with Welch's correction or as stated above. N.S., not significant. See also Fig. S1.
Fig. 2.
Fig. 2.
ROBO1 regulation of mammary alveologenesis is intrinsic to epithelium. (A) Diagram of transplantation. (B,C) Representative H&E whole-mount sections of 17.5DP Robo1+/+ (B) and Robo1−/− (C) contralateral outgrowths at 17.5 DP. Insets are magnified images of boxed areas. Arrows identify compact Robo1−/− alveoli. (D,E) Quantification of fat pad filling (D) and average alveolar size (E) show reduced Robo1−/− alveologenesis. (F,G). Representative confocal images (F) and quantification (G) show reduced milk (magenta) with ACTA2 (green) in 17.5 DP Robo1−/− outgrowths. (H) Schematic of the stages of HC11 lactogenic differentiation. (I) Representative confocal image of undifferentiated HC11 cells shows expression of KRT14+ (green) cells encircling KRT8+ (magenta) cell. (J,K) Differential interference contrast (DIC) images (J) and quantification (K) of siScr and Robo1 KD in differentiated HC11 cells show reduced milk dome formation that is largely rescued by Robo1 overexpression. Arrowheads identify domes. (L,M) Immunoblot (L) and quantification (M) show reduced CSN2 expression that is largely rescued by Robo1 overexpression (two-tailed paired t-test). n=3 independent experiments, 10 images/n (D,E,G,K). Data are represented as mean±s.e.m. Statistical analysis was performed using a two-tailed, unpaired Student's t-test with Welch's correction or as stated above. ns, not significant. See also Fig. S2.
Fig. 3.
Fig. 3.
ROBO1 regulates notch signaling in luminal progenitors and HC11 cells. (A) RT-qPCR on siScr and Robo1 (siR1) KD primed HC11 cells shows increased Notch effector expression with loss of Robo1. (B,C) Immunoblot (B) and quantification (C) on the nuclear fraction of siScr and Robo1 KD primed HC11 cells show increased nuclear HES1 with Robo1 loss and rescue by either Robo1 overexpression or GSI treatment (two-tailed paired t-test). (D,E) HC11 dome assay (D) and quantification (E) show fewer domes with Robo1 KD and rescue with GSI treatment. Arrows identify domes. (F,G) CSN2 immunoblot (F) and quantification (G) show decreased milk production with Robo1 KD and partial rescue by GSI treatment (two-tailed paired t-test). (H) RT-qPCR on FACS-purified Robo1+/+ and Robo1−/− AVPs shows increased Notch effector expression with loss of Robo1. (I) FACS quantification of the AVP subpopulation shows more AVPs in Robo1−/− MGs and rescue to Robo1+/+ levels by GSI treatment. n=3 independent experiments, five images/n. Data are represented as mean±s.e.m. Statistical analysis was performed using a one-way ANOVA followed by a two-tailed, unpaired Student's t-test with Welch's correction or as indicated above. ns, not significant. See also Fig. S3.
Fig. 4.
Fig. 4.
ROBO1 regulates luminal Notch signaling from the basal compartment. (A) Diagram showing mosaic organoids that contain Robo1−/− (orange) basal or luminal cells combined with ACTb-eGFP Robo1+/+ (green: eGFP+/+) basal or luminal cells. (B-F) Representative confocal images (B-E) and quantification (F) of paraffin-embedded organoid sections immunostained for GFP (green) and milk protein CSN2 (magenta). Organoids with Robo1−/− basal cells (KO/WT) and (KO/KO) show little CSN2 staining (B,E,F), whereas organoids with GFP+/+ basal cells (WT/KO) and (WT/WT) show robust CSN2 staining (C,D,F). (G-I) Representative ICC (G,H) and quantification (I) of Robo1−/− basal cells co-cultured with eGFP+/+ luminal cells show increased nuclear HES1 in the eGFP+/+ luminal cells (arrows) (G,I). In contrast, co-cultures of eGFP+/+ basal cells with Robo1−/− luminal cells show little or no nuclear HES1 in the Robo1−/− luminal cells (H,I). n=3 independent experiments. Data are represented as mean±s.e.m. Statistical analysis was performed using a one-way ANOVA followed by a two-tailed, unpaired Student's t-test with Welch's correction. ns, not significant. See also Fig. S4.
Fig. 5.
Fig. 5.
ROBO1 inhibits JAG1 expression in basal cells via CTTNB1. (A) Immunoblot shows the inverse regulation of ROBO1 with respect to JAG1 and JAG2 and no change in DLL1 over HC11 differentiation. (B,C) Immunoblot (B) and quantification (C) show increased JAG1 with Robo1 KD and rescue with Robo1 overexpression (two-tailed paired t-test). (D,E) Immunoblot (D) and quantification (E) show that increasing overexpression of Robo1 results in decreasing JAG1 (two-tailed, paired Student's t-test). (F) RT-qPCR using primers within the Jag1 promoter either specific to two Tcf/Lef binding sites or to an irrelevant location (control) shows increased CTNNB1 chromatin immunoprecipitation in FACS-purified 10.5 DP Robo1−/− basal cells. (G,H) Representative 3D confocal images (G) and quantification (H) of differentiated Robo1+/+ and Robo1−/− organoids show increased nuclear CTNNB1 (green) staining in Robo1−/− KRT14+ (magenta) basal cells. Bottom panels in G show magnification of boxed areas in top panels. n=3 independent experiments. Data are represented as mean±s.e.m. Statistical analysis was performed using a one-way ANOVA followed by a two-tailed, unpaired Student's t-test with Welch's correction or as stated above. ns, not significant. See also Fig. S5.
Fig. 6.
Fig. 6.
JAG1 in basal cells inhibits luminal differentiation and milk production. (A) Representative 3D confocal images of Robo1+/+ and Robo1−/− organoids infected with either shScr or shJag1 and stained for JAG1 (green) and KRT14 (magenta) show little JAG1 in Robo1+/+ basal cells, and an increase in JAG1 staining in Robo1−/− basal cells that is decreased by KD of Jag1 (shJag1). (B,C) Representative 3D confocal images (B) and quantification (C) of Robo1+/+ and Robo1−/− organoids infected with either shScr or shJag1 and stained for HES1 (magenta) and KRT14 (green) show little HES1 in Robo1+/+ basal cells, and an increase in HES1 expression in Robo1−/− basal cells that is decreased by KD of Jag1 (shJag1). Bottom panels in B show magnification of boxed areas in top panels. Arrows indicate nuclear HES1. (D,E) Representative 3D confocal images (D) and quantification (E) of Robo1+/+ and Robo1−/− organoids infected with either shScr or shJag1 and stained for CSN2 (magenta) and KRT14 (green) show robust CSN2 expression in Robo1+/+ organoids and in Robo1−/− organoids with Jag1 (shJag1) KD; there is little or no CSN2 staining in Robo1−/− (shScr) organoids. (F) Schematic of our model showing how JAG1 expression is held in check in the cytoplasm in wild-type (left) basal cells of mid-pregnant MGs by ROBO1 inhibition of CTNNB1, thereby promoting differentiation. In contrast in Robo1−/− (right) basal cells, nuclear CTNNB1 enhances Jag1 expression and JAG1/Notch signaling inhibits differentiation while promoting alveolar progenitor renewal and expansion. n=3 independent experiments minimum. Statistical analysis was performed using a one-way ANOVA followed by a two-tailed, unpaired Student's t-test with Welch's correction. ns, not significant. See also Fig. S6.

References

    1. Asselin-Labat, M. L., Sutherland, K. D., Vaillant, F., Gyorki, D. E., Wu, D., Holroyd, S., Breslin, K., Ward, T., Shi, W., Bath, M. L.et al. (2011). Gata-3 negatively regulates the tumor-initiating capacity of mammary luminal progenitor cells and targets the putative tumor suppressor caspase-14. Mol. Cell. Biol. 31, 4609-4622. 10.1128/MCB.05766-11 - DOI - PMC - PubMed
    1. Bach, K., Pensa, S., Grzelak, M., Hadfield, J., Adams, D. J., Marioni, J. C. and Khaled, W. T. (2017). Differentiation dynamics of mammary epithelial cells revealed by single-cell RNA sequencing. Nat. Commun. 8, 2128. 10.1038/s41467-017-02001-5 - DOI - PMC - PubMed
    1. Ball, R. K., Friis, R. R., Schoenenberger, C. A., Doppler, W. and Groner, B. (1988). Prolactin regulation of beta-casein gene expression and of a cytosolic 120-kd protein in a cloned mouse mammary epithelial cell line. EMBO J. 7, 2089-2095. 10.1002/j.1460-2075.1988.tb03048.x - DOI - PMC - PubMed
    1. Ballard, M. S. and Hinck, L. (2012). A roundabout way to cancer. Adv. Cancer Res. 114, 187-235. 10.1016/B978-0-12-386503-8.00005-3 - DOI - PMC - PubMed
    1. Blockus, H. and Chedotal, A. (2016). Slit-Robo signaling. Development 143, 3037-3044. 10.1242/dev.132829 - DOI - PubMed

Publication types

MeSH terms