. 2021 Nov 9;37(6):109972.
doi: 10.1016/j.celrep.2021.109972.

Distinct in vivo dynamics of excitatory synapses onto cortical pyramidal neurons and parvalbumin-positive interneurons

Affiliations

Distinct in vivo dynamics of excitatory synapses onto cortical pyramidal neurons and parvalbumin-positive interneurons

Joshua B Melander et al. Cell Rep. .

Abstract

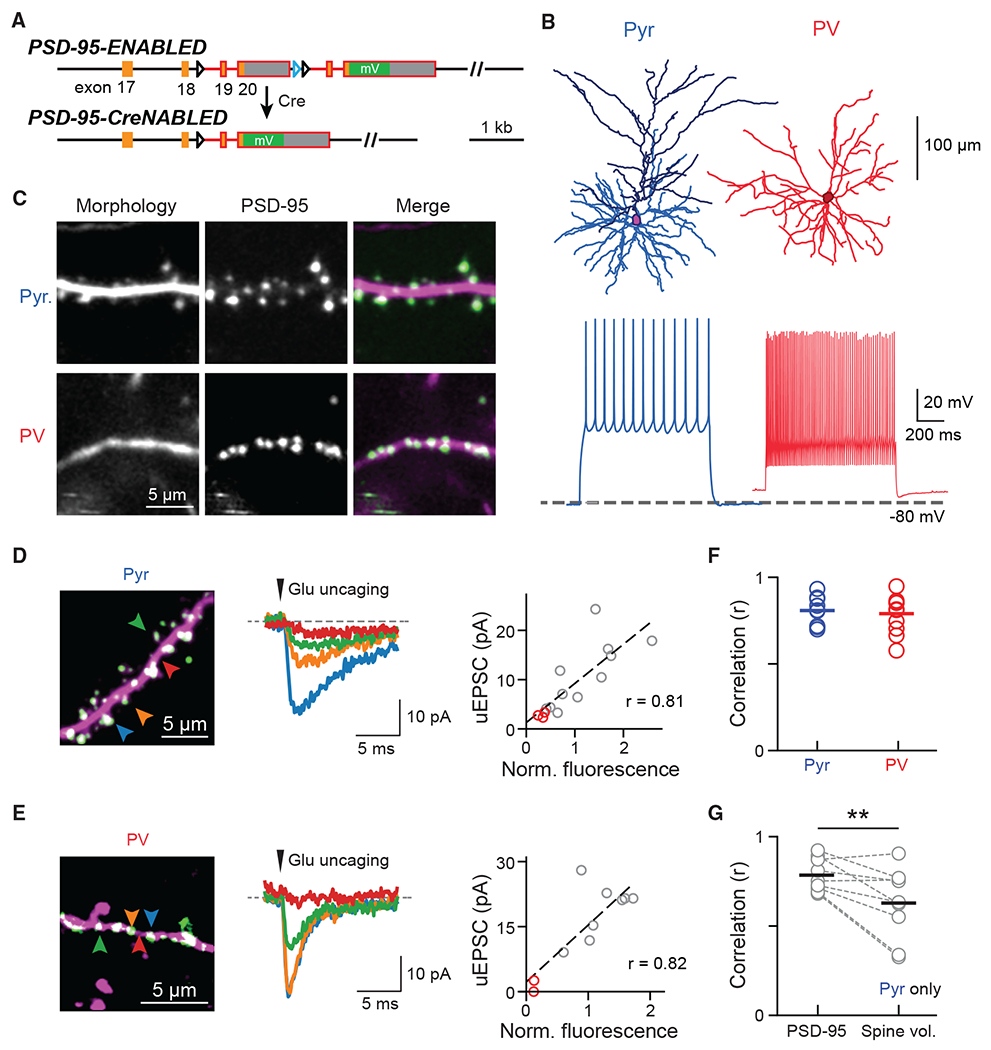
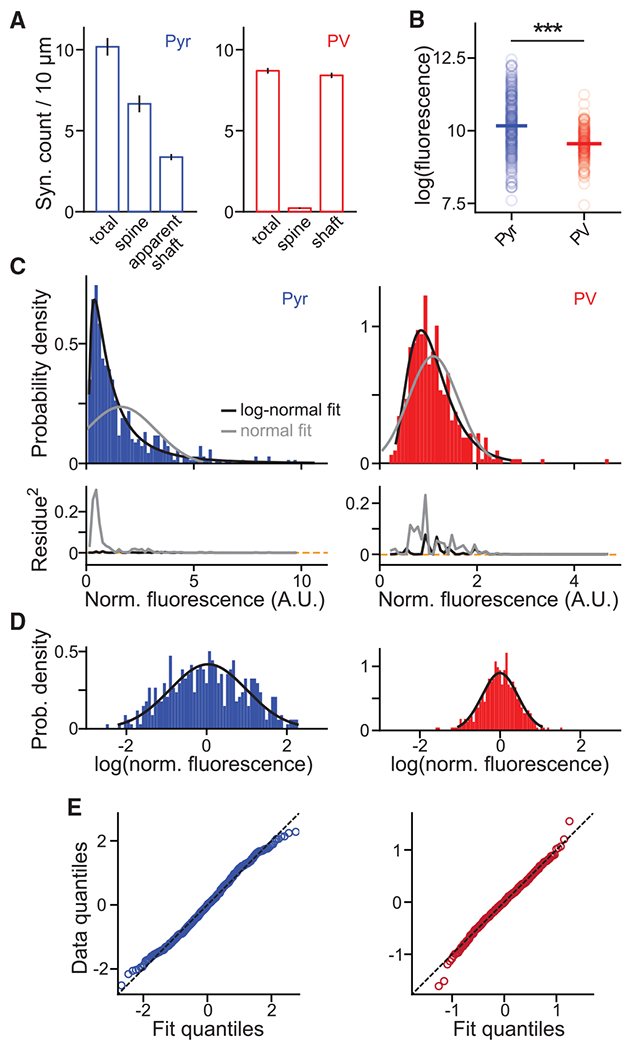
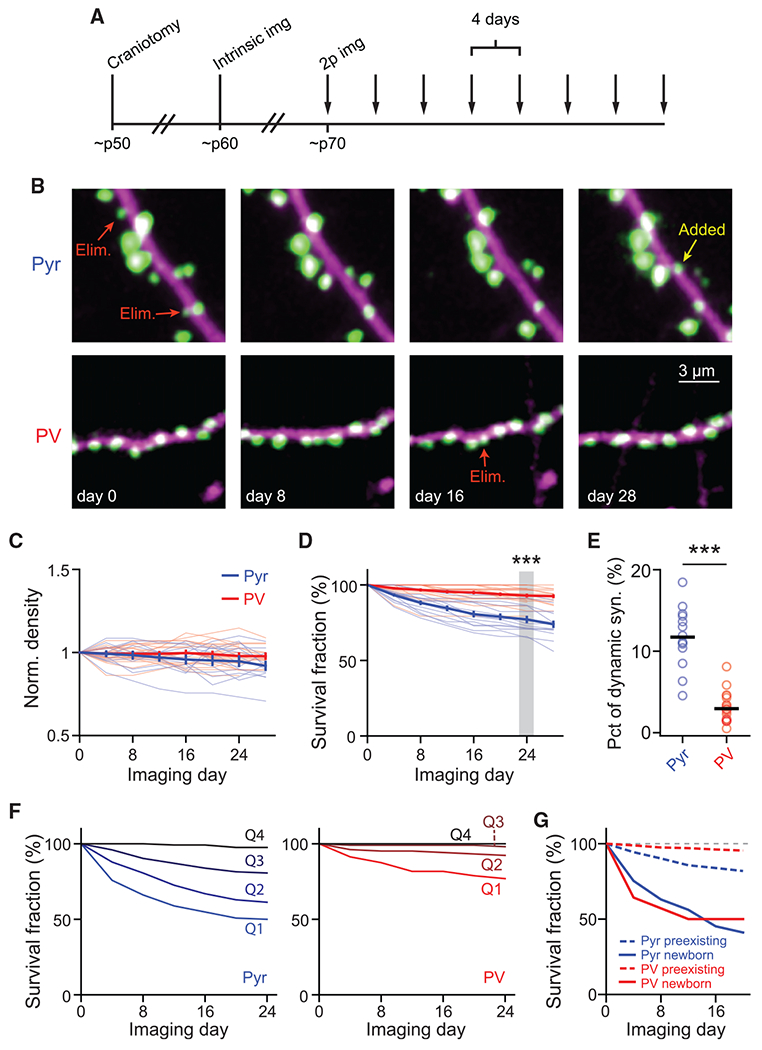
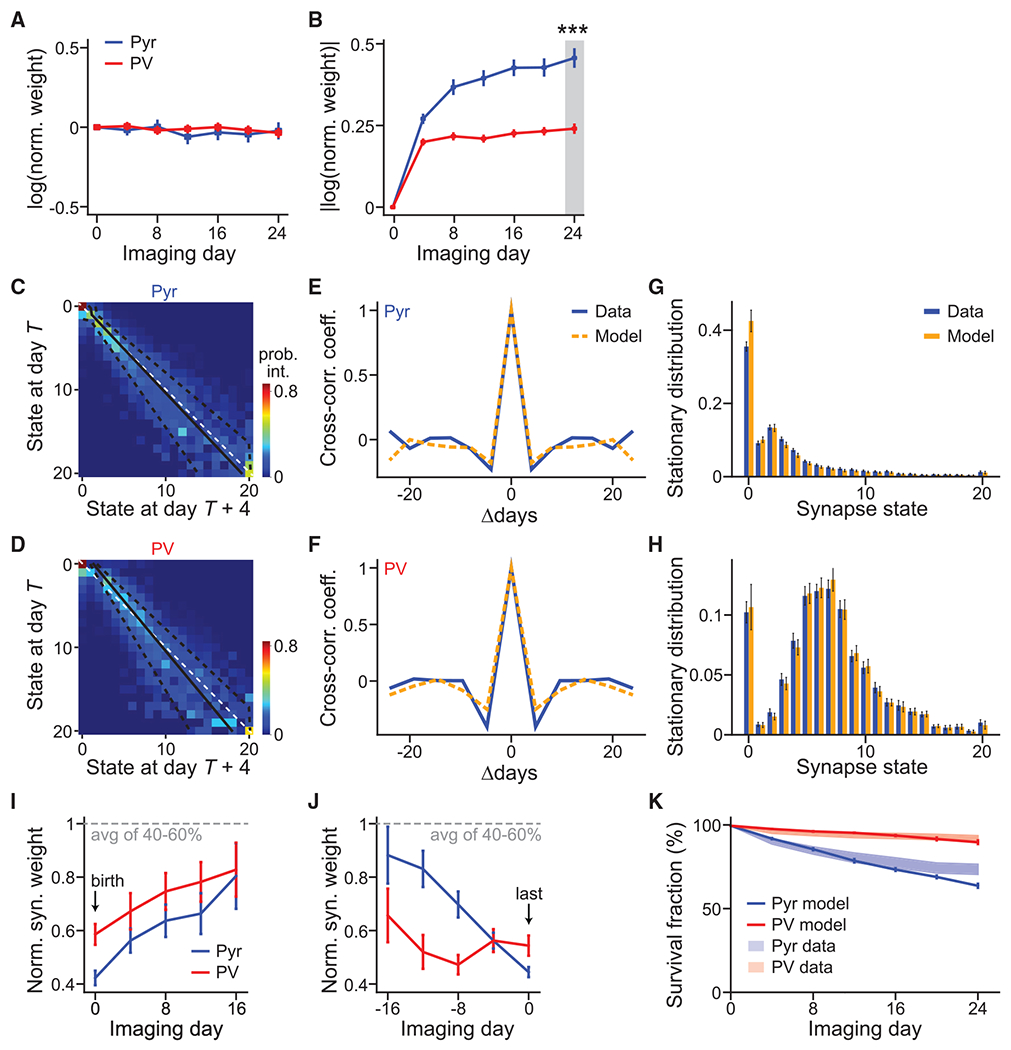
Cortical function relies on the balanced activation of excitatory and inhibitory neurons. However, little is known about the organization and dynamics of shaft excitatory synapses onto cortical inhibitory interneurons. Here, we use the excitatory postsynaptic marker PSD-95, fluorescently labeled at endogenous levels, as a proxy for excitatory synapses onto layer 2/3 pyramidal neurons and parvalbumin-positive (PV+) interneurons in the barrel cortex of adult mice. Longitudinal in vivo imaging under baseline conditions reveals that, although synaptic weights in both neuronal types are log-normally distributed, synapses onto PV+ neurons are less heterogeneous and more stable. Markov model analyses suggest that the synaptic weight distribution is set intrinsically by ongoing cell-type-specific dynamics, and substantial changes are due to accumulated gradual changes. Synaptic weight dynamics are multiplicative, i.e., changes scale with weights, although PV+ synapses also exhibit an additive component. These results reveal that cell-type-specific processes govern cortical synaptic strengths and dynamics.

Keywords: Markov model; PSD-95; additive and multiplicative synaptic dynamics; in vivo two-photon imaging; log normality; parvalbumin-positive inhibitory interneuron; shaft excitatory synapses; structural plasticity; synaptic weight.


Conflict of interest statement

Declaration of interests H.Z. is the inventor of the PSD-95-ENABLED mouse, which has been licensed to several companies. This potential conflict of interest has been reviewed and managed by OHSU.

Figures

Figure 1.
Figure 1.. Visualizing endogenous PSD-95 as a proxy for the presence and weight of excitatory synapses onto Pyr and PV+ dendrites
(A) Schematic of the ENABLED/CreNABLED strategy for tagging endogenous PSD-95 with mVenus in a Cre-dependent manner. (B) Representative cellular reconstructions (top) and spike trains (bottom) elicited via supra-threshold current steps from Pyr (left) and PV+ (right) neurons. (C) Representative two-photon images of dendritic segments from Pyr neurons (top) and PV+ interneurons (bottom). PSD-95 (green) and dendritic morphology (magenta) were labeled simultaneously. (D and E) Two-photon glutamate uncaging experiment for Pyr (D) and PV+ (E) neurons in acute brain slices. Left: representative images; colored arrowheads correspond to the traces shown. Middle: Example uEPSCs (average of 5–10 trials). Right: correlation between integrated PSD-95mVenus fluorescence intensities with uEPSC of the example dendrite. Red circles indicate stimulations at locations without PSD-95mVenus. (F) Correlation (Pearson’s r) between PSD-95mVenus fluorescence and uEPSC amplitude within individual dendrites. Averages are: 0.81 ± 0.03, n (dendrites/cells/animals) = 9/6/3 for Pyr neurons; and 0.79 ± 0.03, n = 11/8/3 for PV+ neurons. (G) Correlation between uEPSC amplitudes and PSD-95mVenus fluorescence versus spine volume in Pyr neurons. Only clear, laterally protruding spines were included. Averages are 0.78 ± 0.03 for PSD-95mVenus and 0.63 ± 0.07 for spine volume, n (dendrites/animals) = 9/3. One-sided Wilcoxon signed-rank test: p = 0.009, W = 42. See also Figure S1.
Figure 2.
Figure 2.. Population characteristics of the organization of synapses and their weights
(A) The density of PSD-95mVenus puncta, and the fractions on laterally protruding spines and of those colocalized with dendritic shafts on Pyr (left) and PV+ (right) dendrites in vivo. (B) Absolute integrated PSD-95mVenus fluorescence of Pyr and PV+ synapses in the logarithmic scale. Only synapses between 10 and 50 μm beneath the pia are included. Medians are 10.16 ± 0.05 (SEM), n (synapses/dendrites/animals) = 308/9/4 for Pyr, and 9.6 ± 0.04, n = 191/10/7 for PV+. Wilcoxon rank-sum test: p < 0.001, U = 8.28. (C) Probability density histograms of normalized synaptic PSD-95mVenus fluorescence fitted by log-normal or normal distributions (top) and their squared residues (bottom). n (synapses/dendrites/animals) = 452/14/4 and 409/21/7 for Pyr and PV+, respectively. (D and E) Histograms of the logarithm of synaptic PSD-95mVenus fluorescence plotted with the best-fit normal distribution (D) and their quantile-quantile plots (E). All error bars are SEM. See also Figure S2.
Figure 3.
Figure 3.. Synapses onto PV+ dendrites are more stable compared to those onto pyramidal dendrites
(A) Experimental protocol for longitudinal in vivo experiments. (B) Representative images of Pyr (top) and PV+ (bottom) dendrites in layer 1 imaged over a month. Arrows indicate representative added and eliminated (Elim.) synapses. (C) Time course of the synaptic density of Pyr and PV+ dendrites normalized to day 0. (D) Survival fraction of synapses present on the first imaging session at subsequent time points. n (synapses/dendrites/animals) = 594/14/4 for Pyr and 683/21/7 for PV. Wilcoxon rank-sum test: p < 0.001, U = 4.09. (E) Percentage of synapses on a dendritic segment that were added or eliminated during a 4-day interval. n (dendrites/animals) = 14/4 for Pyr and 21/7 for PV. Wilcoxon rank-sum test: p < 0.001, U = 4.8. (F) Survival fractions of four quartiles (from weak to strong: Q1–Q4) of synapses sorted by weight on the first imaging day. n = 124 and 104 synapses/quartile for Pyr and PV+ dendrites, respectively. (G) Survival fractions of newborn versus preexisting synapses onto Pyr and PV+ dendrites. n = 552, 441, 73, and 14, respectively, for Pyr preexisting, PV+ preexisting, Pyr newborn, and PV+ newborn. All error bars are SEM. See also Figures S2 and S3.
Figure 4.
Figure 4.. Markov-chain model reveals cell-type-specific principles of synaptic weight dynamics
(A and B) Average of signed (A) and absolute (B) synaptic weight changes relative to day 1 in the natural log scale. n = 174 for Pyr and 190 for PV+. (C and D) The Markov-state transition matrices of Pyr (C) and PV+ (D) synapses. The unity line (white dashed) and fitted Kesten process with its ± 1 standard deviation (solid and dashed black lines, respectively) are superimposed. The Markov process was fit using 678 and 451 high-quality synapses for Pyr and PV+ dendrites, respectively. (E and F) Cross-correlation coefficient between synaptic weight changes from day T to day T+4 and those from day T+Δ to day T+Δ+4, averaged over all synapses and days. (G and H) Steady-state distributions of synaptic weight for Pyr(G) and PV+ (H), as computed from experimental data (blue) or as predicted by the Markov model (orange). Error bars denote standard deviation across 30 bootstrap runs. (I and J) Addition-triggered (I) and elimination-triggered (J) averages of weight trajectories, aligned to birth and death, respectively. n (synapses) = 225 (Pyr birth), 271 (PV+ birth), 45 (Pyr death), and 50 (PV+ death). (K) The survival fraction as a function of time predicted by the Markovian transition model (solid lines) compared with experimental data (shades, SEM; same as Figure 3D) for both Pyr and PV+ synapses. n (synapses) = 721 (Pyr model), 468 (PV+ model), 496 (Pyr data), and 416 (PV+ data). All error bars are SEM. See also Figures S2 and S4.

References

    1. Antoine MW, Langberg T, Schnepel P, and Feldman DE (2019). Increased Excitation-Inhibition Ratio Stabilizes Synapse and Circuit Excitability in Four Autism Mouse Models. Neuron 101, 648–661.e4. - PMC - PubMed
    1. Béïque JC, and Andrade R (2003). PSD-95 regulates synaptic transmission and plasticity in rat cerebral cortex. J. Physiol 546, 859–867. - PMC - PubMed
    1. Bergmann I, Nitsch R, and Frotscher M (1991). Area-specific morphological and neurochemical maturation of non-pyramidal neurons in the rat hippocampus as revealed by parvalbumin immunocytochemistry. Anat. Embryol. (Berl) 184, 403–409. - PubMed
    1. Bhatt DH, Zhang S, and Gan WB (2009). Dendritic spine dynamics. Annu. Rev. Physiol 71, 261–282. - PubMed
    1. Buzsáki G, and Mizuseki K (2014). The log-dynamic brain: how skewed distributions affect network operations. Nat. Rev. Neurosci 15, 264–278. - PMC - PubMed

Publication types

LinkOut - more resources