. 2021 Nov 9;37(6):109993.
doi: 10.1016/j.celrep.2021.109993.

The organization and development of cortical interneuron presynaptic circuits are area specific

Affiliations

The organization and development of cortical interneuron presynaptic circuits are area specific

Gabrielle Pouchelon et al. Cell Rep. .

Abstract

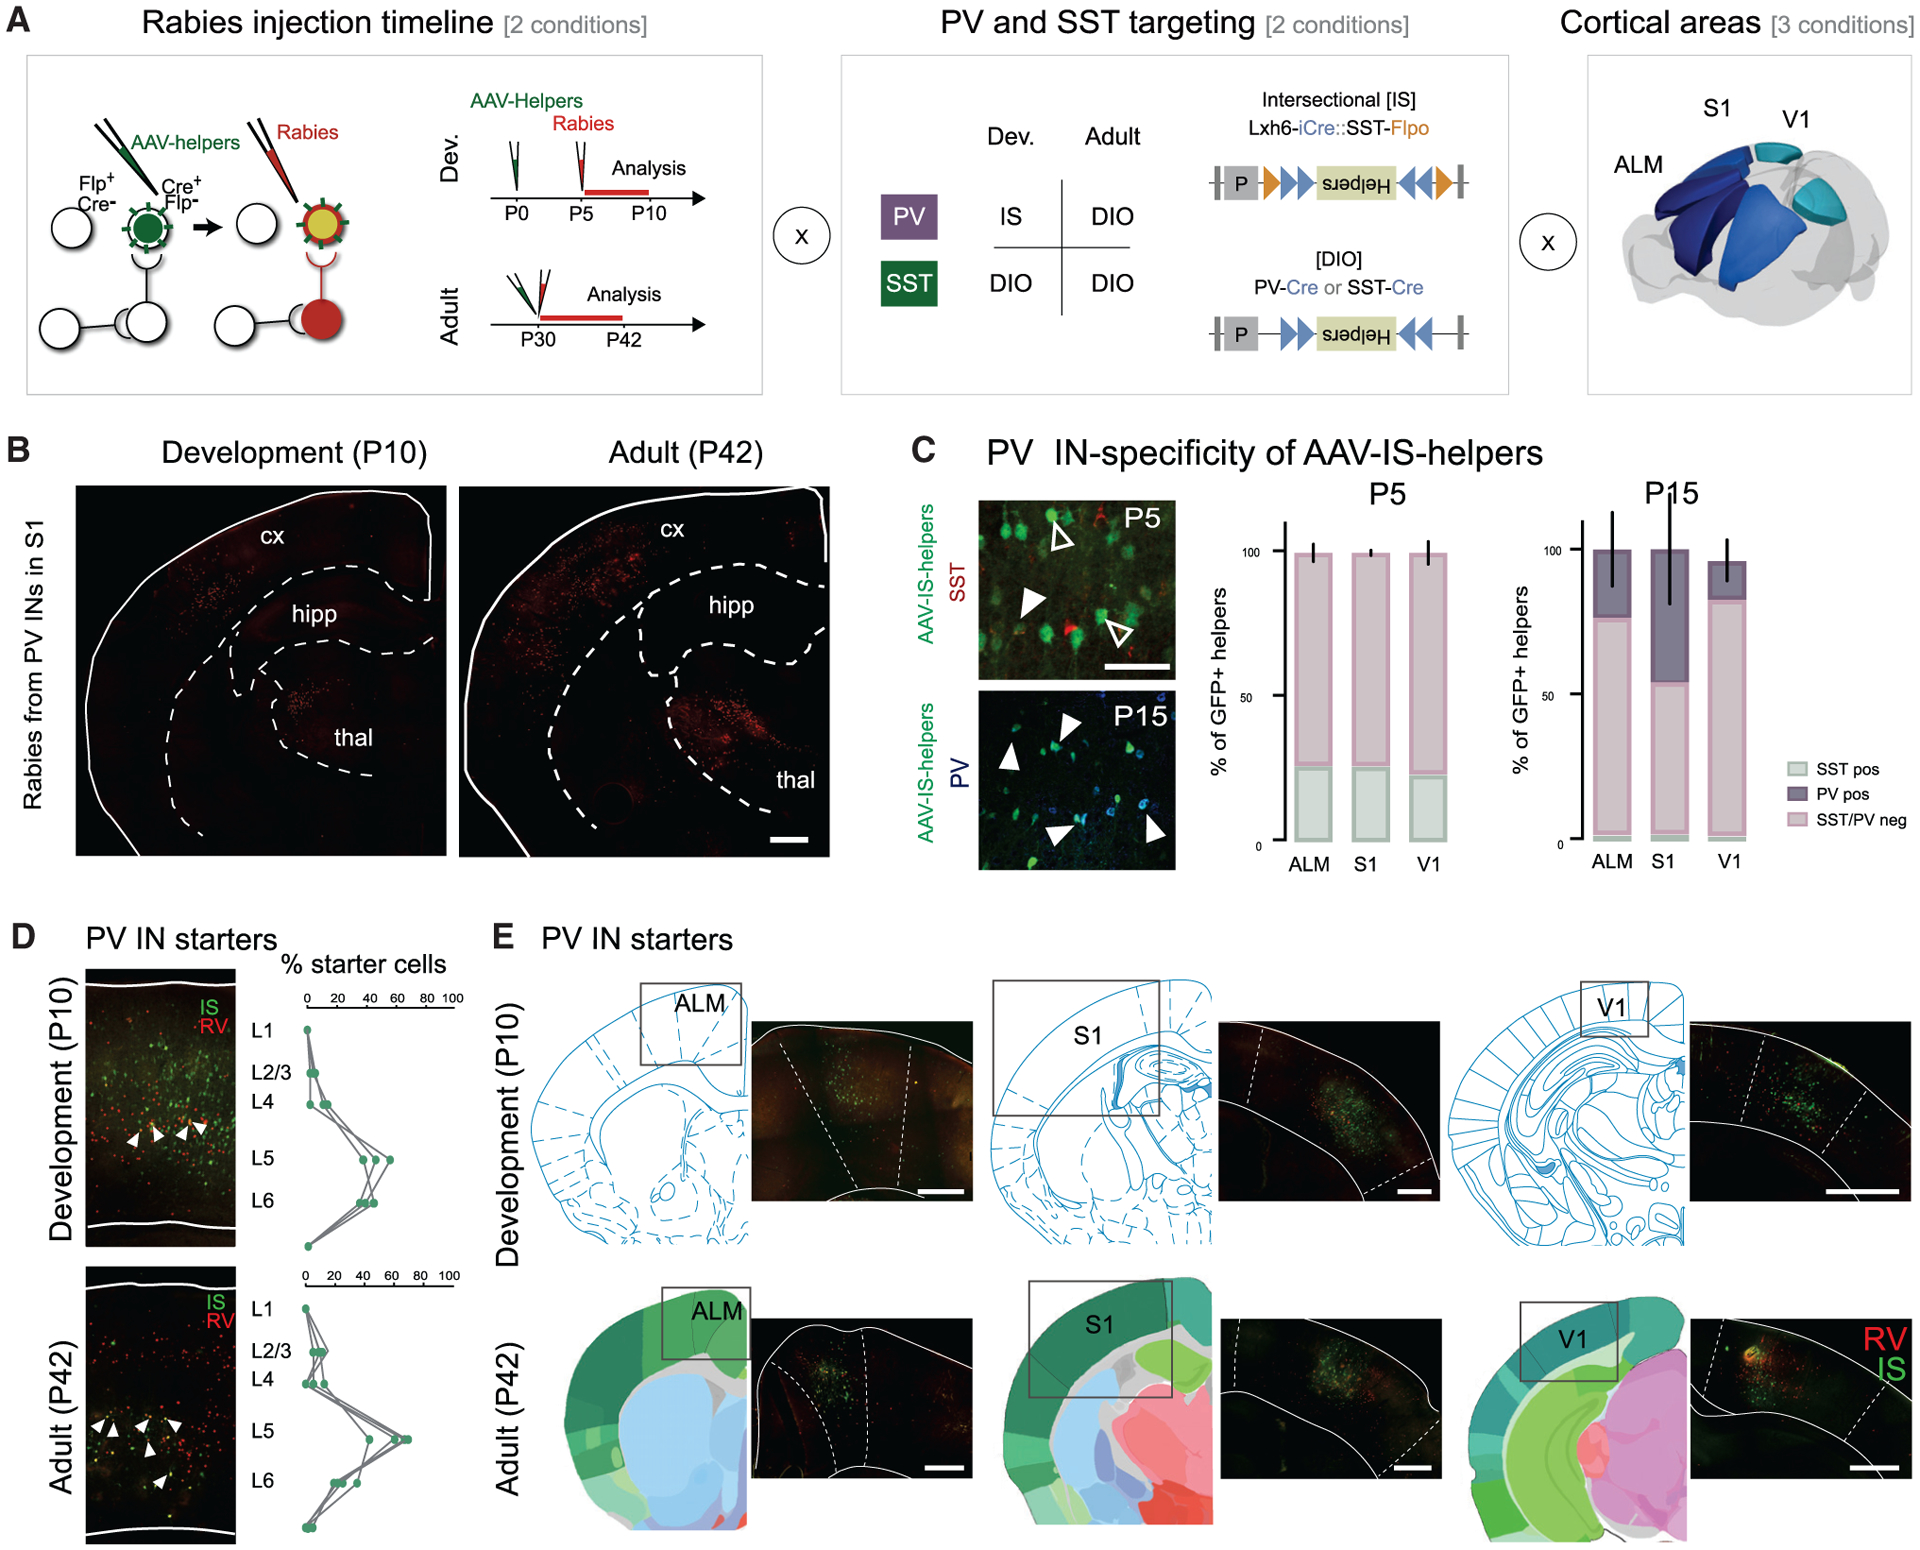
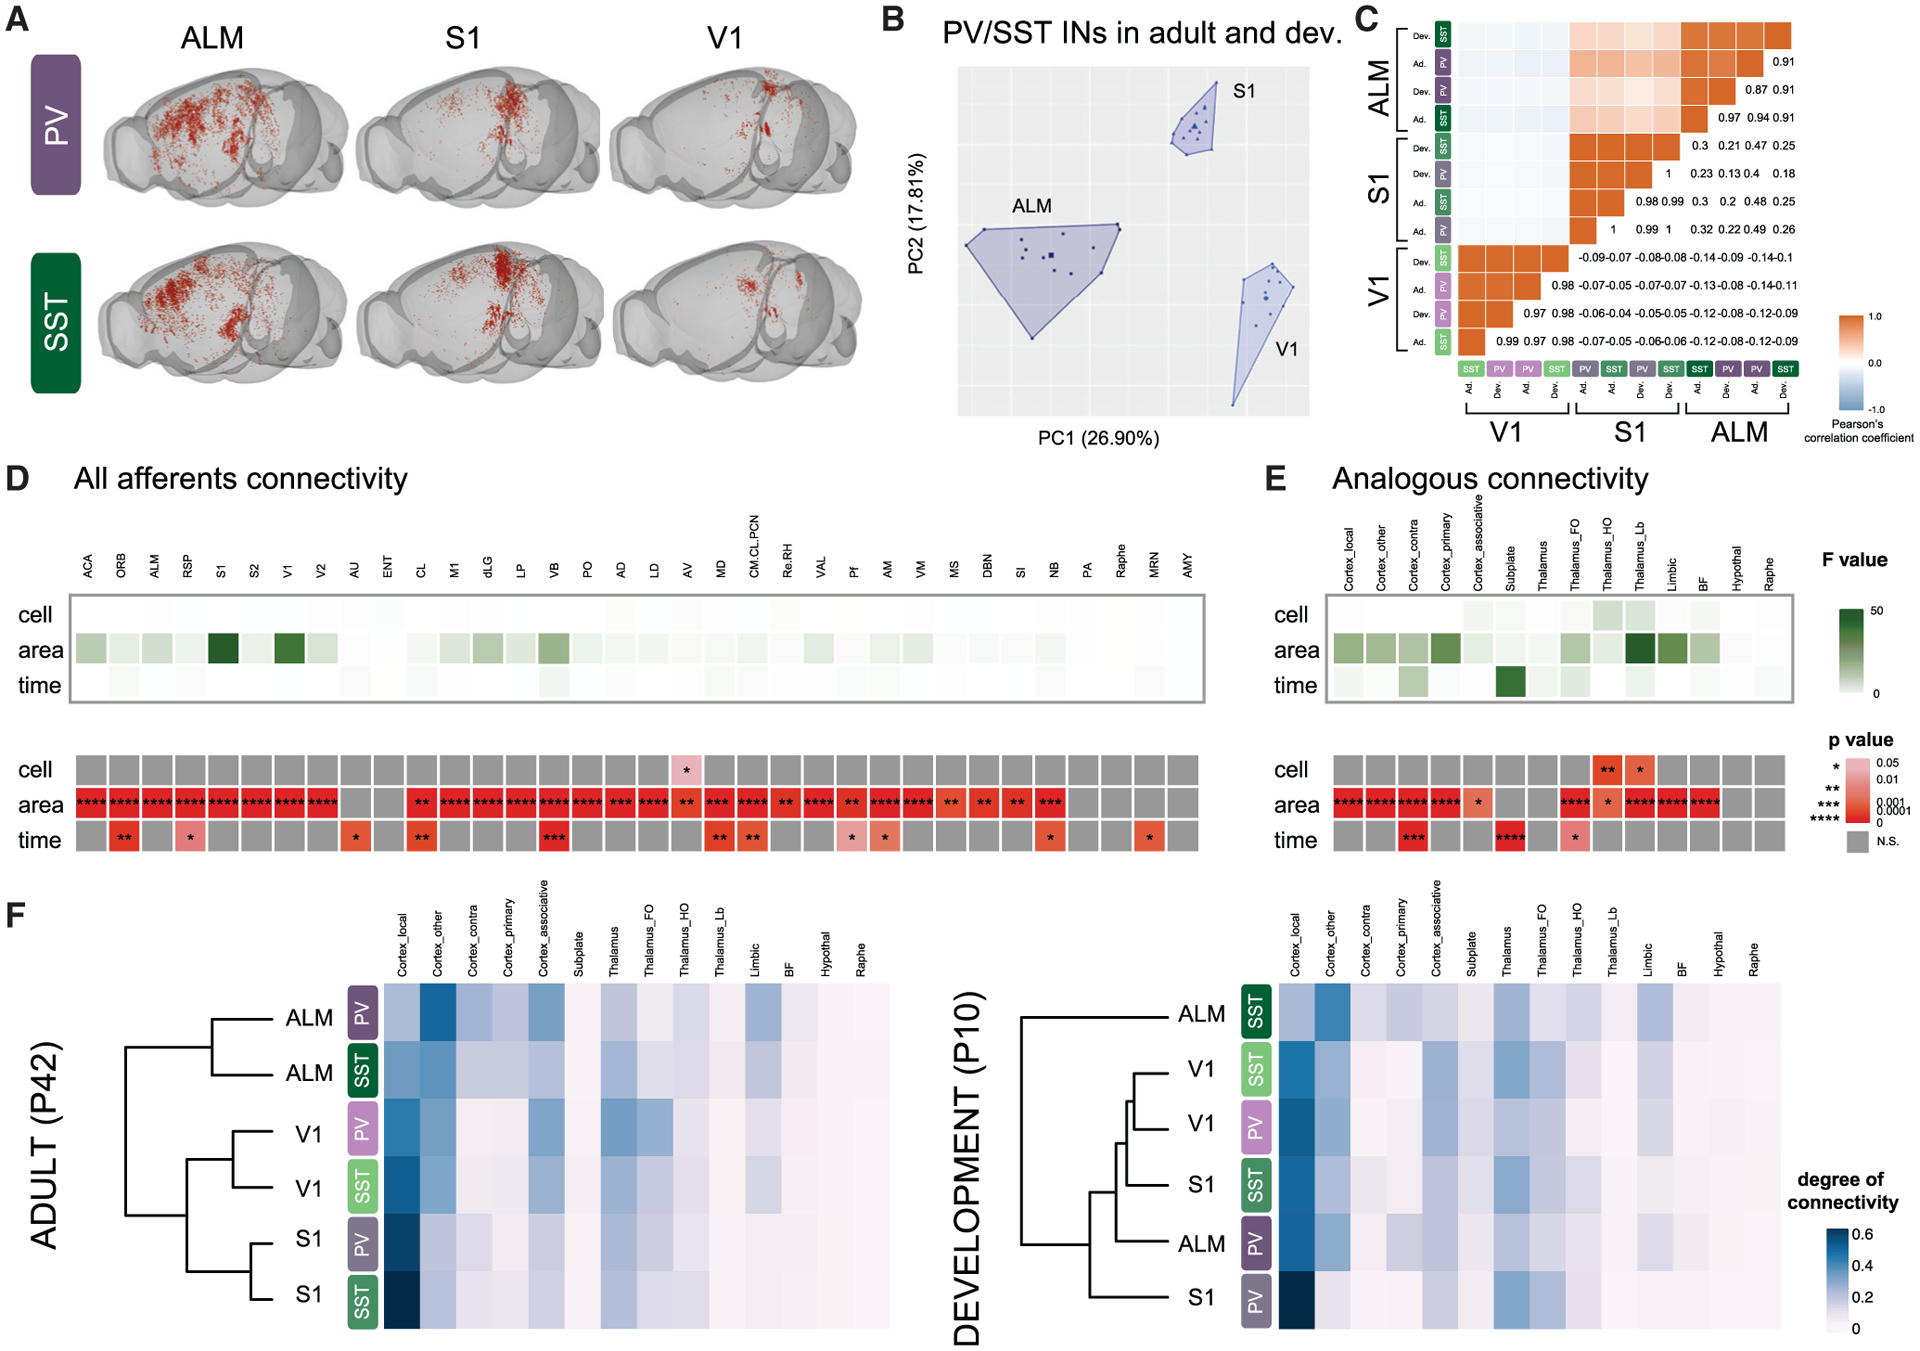
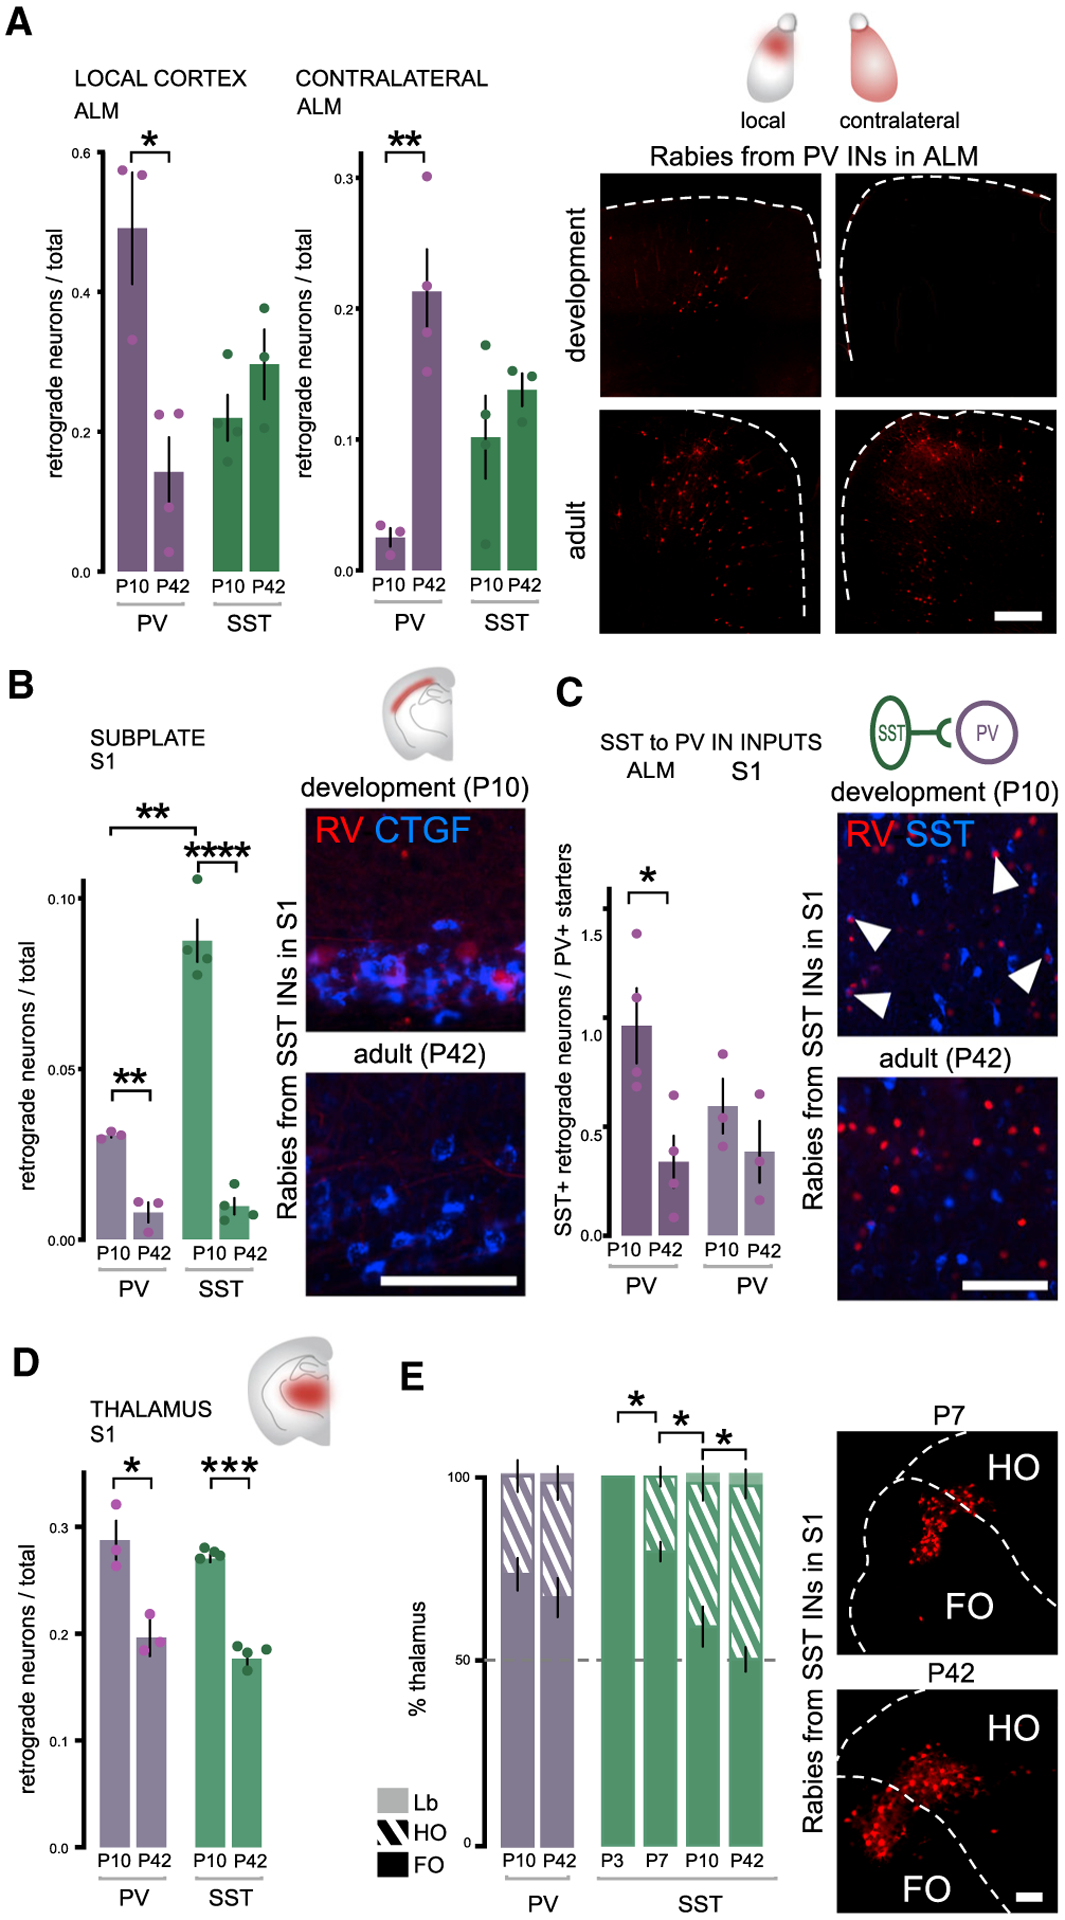
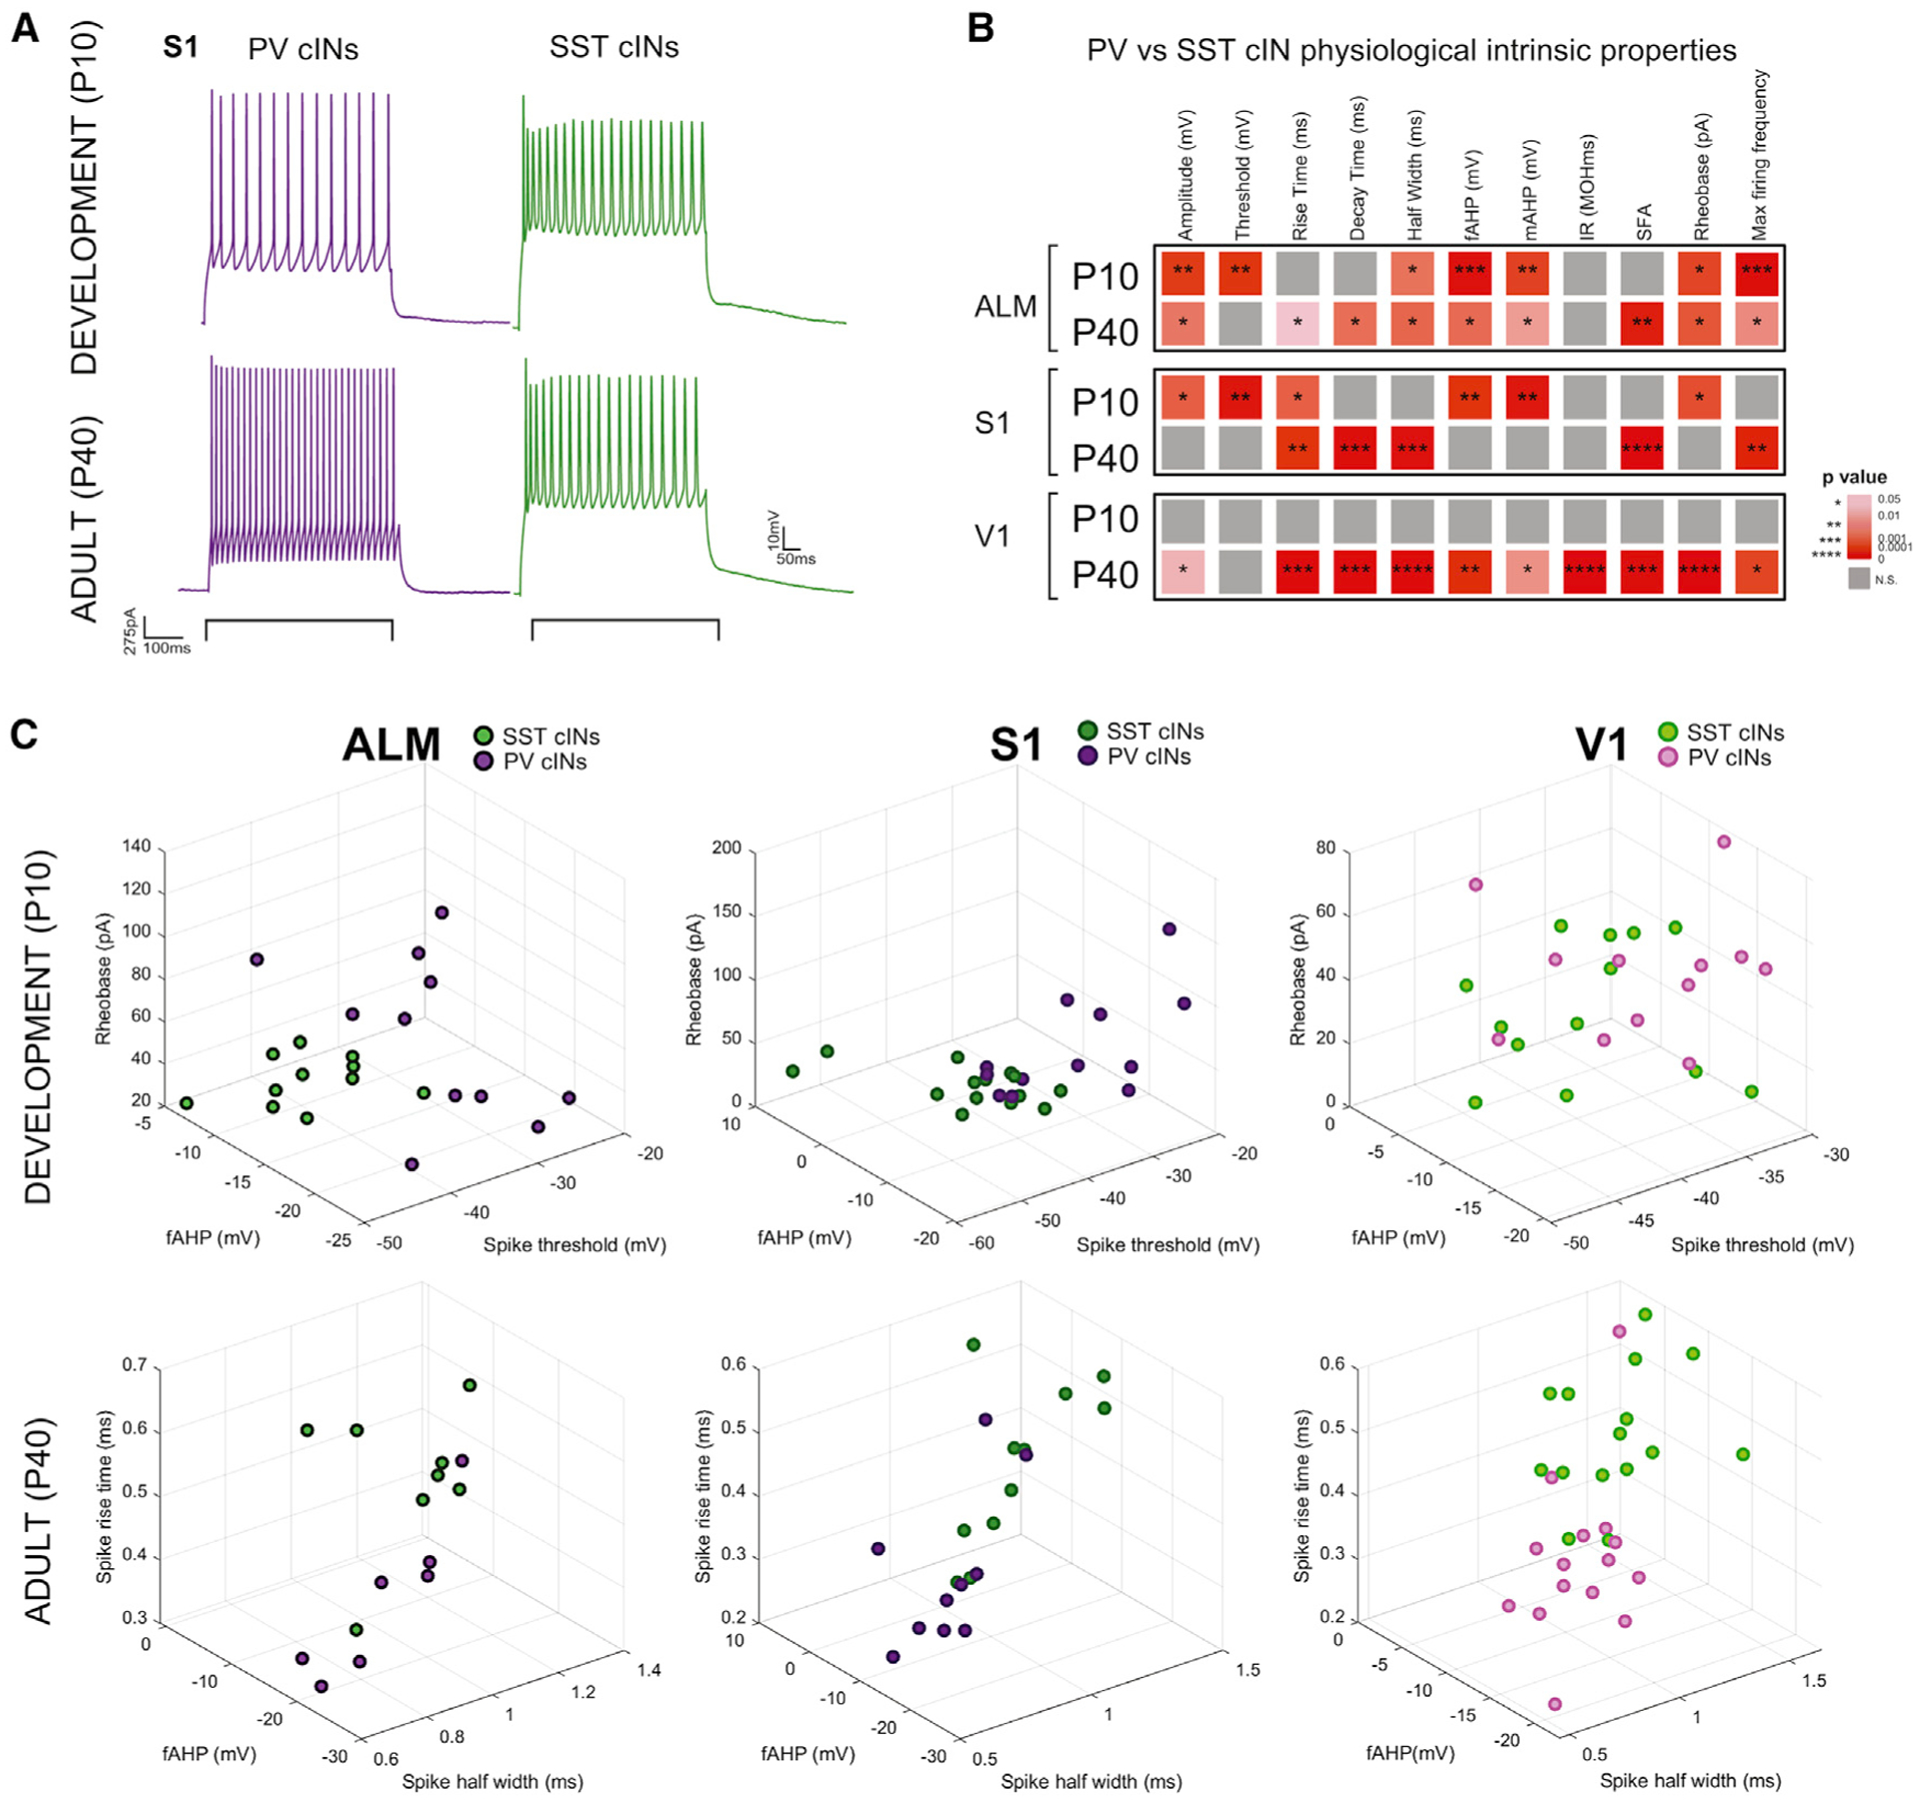
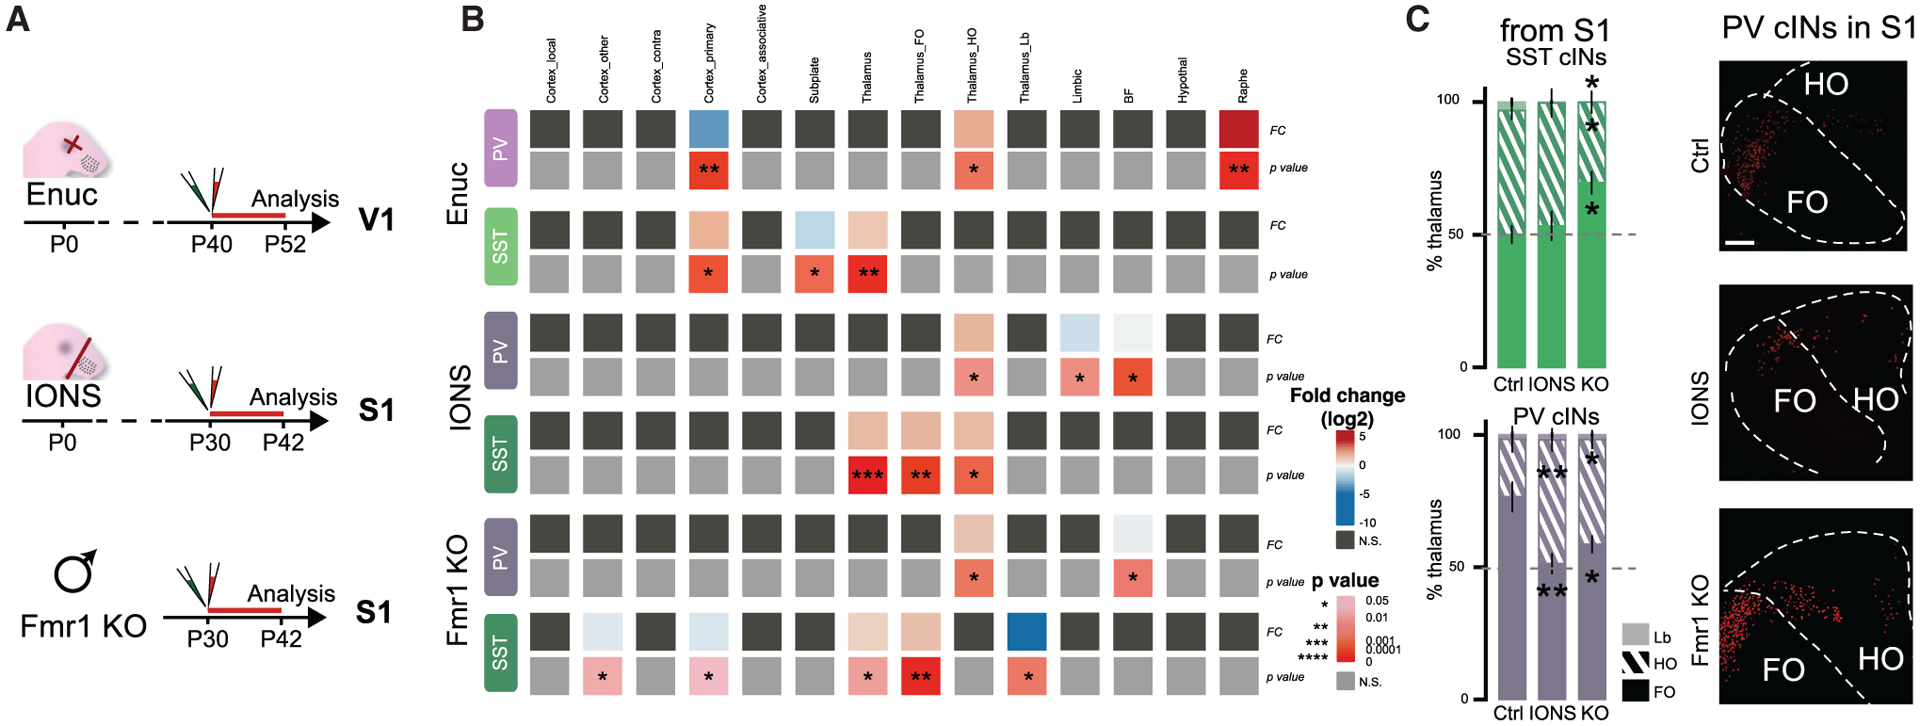
Parvalbumin and somatostatin inhibitory interneurons gate information flow in discrete cortical areas that compute sensory and cognitive functions. Despite the considerable differences between areas, individual interneuron subtypes are genetically invariant and are thought to form canonical circuits regardless of which area they are embedded in. Here, we investigate whether this is achieved through selective and systematic variations in their afferent connectivity during development. To this end, we examined the development of their inputs within distinct cortical areas. We find that interneuron afferents show little evidence of being globally stereotyped. Rather, each subtype displays characteristic regional connectivity and distinct developmental dynamics by which this connectivity is achieved. Moreover, afferents dynamically regulated during development are disrupted by early sensory deprivation and in a model of fragile X syndrome. These data provide a comprehensive map of interneuron afferents across cortical areas and reveal the logic by which these circuits are established during development.

Keywords: ALM; GABAergic interneurons; cortical areas; development; fragile X syndrome; monosynaptic rabies tracing; sensory cortex; thalamocortical input.


Conflict of interest statement

Declaration of interests Gord Fishell is a founder of Regel Therapeutics, which has no competing interests with the present manuscript.

Figures

Figure 1.
Figure 1.. Mapping developmental changes in the afferent connectivity of PV and SST cINs
(A) Experimental design of PV and SST cINs afferent rabies retrograde tracing. Left panel: principle of modified rabies tracing with the timeline of AAV-helpers and N2cRV injections for the developmental time point (top) and for the adult time points (bottom). TVA and N2cG conditional helpers (in green) are expressed using AAVs, followed by the specific infection and retrograde labeling by EnVA-pseudotyped CVS N2c rabies virus (Rabies, in red). Middle panel: PV Cre- and SST-Cre mouse lines are used with AAV-DIO-helpers construct (bottom). Intersectional strategy using Lhx6-iCre/SST-FlpO mouse lines is used with the AAV-IS-helper (top). Right panel: The tracing was performed from both PV and SST cINs populations within 3 cortical areas (ALM, S1 and V1). (B) Example of retrograde labeling from PV cINs in S1 at a developmental (P5–10) and adult (P30–42) time points (scale bar: 500 μm). (C) The specificity of the PV cINs targeting using AAV-IS-helpers was verified with somatostatin staining (red) at P5 and P15 and with parvalbumin staining (blue) at P15 (left panel). Percentage of parvalbumin-positive versus somatostatin-negative in AAV-IS-helpers infected population at P5 and P15 in ALM, S1, and V1 (right panel).Data shown are as mean ± SEM. (D) Examples of starter cells (colocalization of helpers (green) with RV (red). Percentage of starter cells quantified per layer (scale bar: 100 μm). Circles represent individual animals. (E) Examples of AAV-helpers localization within ALM, S1 and V1 during development, P5–P10, and in adults, P30–P42, together with their corresponding atlas Paxinos at P6 for the development and Allen Institute Brain reference atlas for adults (scale bar: 200 μm). Circles represent individual animals.
Figure 2.
Figure 2.. Presynaptic inputs to PV and SST cINs are primarily determined by their areal location
(A) Examples of rabies retrograde labeling from PV and SST cINs in ALM, S1, and V1 using “Brainrender” 3D representation (Claudi et al., 2020). (B) Principal component analysis (PCA) of using degree of connectivity for all afferents I each animal (N = 21), showing the clustering, using K-mean analysis, of both PV and SST cINs, both during development and adulthood into 3 areal-specific clusters (ALM, S1 and V1). (C) Correlation plot of pearson’s correlation coefficients based on the degree of connectivity of all N shows the high correlation between PV and SST cINs both during development and adulthood within each area. (D) Heatmap of the F values (top) and the p values (p, bottom) calculated after multiple linear regression using “cell” (PV versus SST cINs), “area” (ALM versus S1 versus V1), and “time” (development versus adult) as categorical indicators. Only significant p are represented, with *p < 0.05, **p < 0.01, ***p < 0.001, ****p < 0.001. See abbreviations of the origin of the afferents below. (E) Same as (D), but using afferents grouped in analogous types instead. See STAR Methods for the groups. (F) Heatmap and hierarchical clustering of PV and SST cINs in ALM, V1, and S1 using the degree of connectivity from analogous afferents in adults (left) and during development (right). Abbreviations: Cortex: primary and secondary motor (M1, ALM) visual (V1, V2), somatosensory (S1, S2), auditory (AU), retrosplenial (RSP), cingulate (ACA), orbital (ORB), entorhinal (ENT), claustrum (CL) areas, amygdala (AMY); Thalamus: laterodorsal (LD). Lateroposterior (LP), dorsal lateral geniculate (dLG), posterior (PO), ventrobasal (VB), ventral anterior and lateral (VAL), anteromedial (AM), anteroventral (AV), centromedian, central lateral and paracentral (CM/CL/PCN), mediodorsal (MD), Reuniens and Rhomboid (Re/RH), anterodorsal (AD), Parafascicular (Pf) nuclei; basal forebrain: medial septum (MS), substantia innominate (SI), diagonal band nucleus (DBN), nucleus basalis (NB); hypothalamus: preoptic area (PA); hindbrain: raphe nucleus (Raphe), middle reticular nucleus (MRN).
Figure 3.
Figure 3.. During development, areal-specific presynaptic inputs onto cINs are dynamically regulated in a cell-type-specific fashion
(A) Early establishing connectivity within local cortex and late-establishing connectivity of contralateral cortex from PV and SST cINs within ALM during development (P5–P10) and in adults (P30–P42). Quantification: Local cortex: PV cINs development comparison Student’s t test *p = 0.0111, SST cINS comparison is non-significant (n.s.). Contralateral: PV cINs development comparison Student’s t test **p = 0.0046. SST cINs n.s. Examples of RV retrograde tracing from PV cINs in ALM and in the contralateral side (scale bar: 200 μm). (B) Early establishing connectivity of subplate neurons is higher on both PV and SST cINs during development in S1. Student’s t test PV cINs **p = 0.0016; SST cINs ****p < 0.0001. However, subplate connectivity is higher onto SST than PV cINs at P10. Student’s t test ***p = 0.0006. Example of rabies-labeled neurons (red) colocalization with CTGF maker (blue) in L6b (scale bar: 50 μm). (C) Early SST cIN transient connectivity to PV cINs. PV cINs Student’s t test *p = 0.0247 in ALM, n.s. in S1. SST cINs are identified as local RV+ neurons (RV) colocalizing with somatostatin (SST, bue) and normalized with the number of PV starter cells (see Figure 1, colocalization of RV+ and helpers-GFP) (scale bar: 50 μm) (D) Early connectivity from the thalamus in S1. PV cINs Student’s t test *p = 0.0218, SST cINs Student’s t test ****p < 0.0001. (E) Ratio of FO, HO, and Lb neurons (see STAR Methods for definition of the classes) within whole thalamic afferent populations (100%). PV cINs receive a higher proportion of FO afferents at both time points in S1, while SST receive a similar amount of FO and HO afferents at P42. The proportion of FO to SST cINs gradually lowers during development. One-way ANOVA followed by Tukey’s test adjusted p values: P3/P7 *p = 0.0118; P7/P10 *p = 0.0222; P10/P42 *p = 0.0236. Examples of FO/HO proportion from the retrograde RV labeling from SST cINs in S1 during development (at P7) and in adult (scale bar: 100 μm). Data shown are as mean ± sem. Circles represent individual animals.
Figure 4.
Figure 4.. The timing of PV and SST cIN physiological maturation varies across cortical areas
(A) Example of electrophysiological trace of patch clamp recording from PV and SST cINs in S1 at P10 and P40, showing their maturation. (B) Heatmap of p values from Sidák’s multiple comparison test between PV and SST cINs average features within each area at P10 and P40. *p < 0.05, **p < 0.01, ***p < 0.001, ****p < 0.00001. Grey is n.s. More physiological properties or more significance was detected at P40 between PV and cINs reflecting their maturation. See below for abbreviations of the features. (C) 3D plot of all PV and SST cINs within ALM, S1 and V1 during development and in adults using the most significant features at P10 and P40. Clustering of PV and SST populations are more evident at P40 and the least in V1 at P10. Abbreviations: fAHP, mAHP = fast-, medium-afterhyperpolarization; IR = input resistance; SFA = spike frequency adaptation.
Figure 5.
Figure 5.. Development of cIN afferent connectivity is disrupted in fragile X syndrome disorder or upon early sensory experience defects
(A) Experimental timeline: visual or somatosensory deprivation at P0 (Enuc = enucleation (eye removal) and IONS = infraorbital nerve section for whisker deprivation, respectively), followed by N2cRV+AAV-helpers injection in PV-Cre and SST-Cre animals, at P40 or P30 and in V1 or S1, respectively. Fmr1 KO males crossed with PV-Cre or SST-Cre were used for N2cRV+AAV-helper injections at P30 in S1. (B) Heatmap of log2(fold change) and the p values from the difference between average analogous connectivity between Enuc, IONS or Fmr1 KO animals and their respective controls (PV and SST cIN WT from S1 or V1 from Figures 2 and 3) tested with Student’s t test *p < 0.05, **p < 0.01, ***p < 0.001, ****p < 0.00001. Grey boxes are n.s. (C) Ratio of FO, HO and Lb thalamic neurons within the whole thalamus (100%). SST cIN TC afferent proportion is changed only in the Fmr1 KOs (One-way ANOVA followed by Tukey’s test (adjusted p values): %FO p = 0.018; for %HO p = 0.043, for %Lb p = 0.026); PV cIN TC afferent proportion is disrupted in both IONS and Fmr1 KO animals (One-way ANOVA, Tukey’s test: %FO IONS **p = 0.0063; Enuc *p = 0.039). Examples of FO/HO distribution from S1 PV cIN RV tracing (Scale bar: 100 μm).

References

    1. Ackman JB, Burbridge TJ, and Crair MC (2012). Retinal waves coordinate patterned activity throughout the developing visual system. Nature 490, 219–225. 10.1038/nature11529. - DOI - PMC - PubMed
    1. Ährlund-Richter S, Xuan Y, van Lunteren JA, Kim H, Ortiz C, Pollak Dorocic I, Meletis K, and Carlén M (2019). A whole-brain atlas of monosynaptic input targeting four different cell types in the medial prefrontal cortex of the mouse. Nat. Neurosci 22, 657–668. 10.1038/s41593-019-0354-y. - DOI - PubMed
    1. Allen WE, Kauvar IV, Chen MZ, Richman EB, Yang SJ, Chan K, Gradinaru V, Deverman BE, Luo L, and Deisseroth K (2017). Global Representations of Goal-Directed Behavior in Distinct Cell Types of Mouse Neocortex. Neuron 94, 891–907.e6. 10.1016/j.neuron.2017.04.017. - DOI - PMC - PubMed
    1. Antón-Bolaños N, Espinosa A, and López-Bendito G (2018). Developmental interactions between thalamus and cortex: a true love reciprocal story. Curr. Opin. Neurobiol 52, 33–41. 10.1016/j.conb.2018.04.018. - DOI - PMC - PubMed
    1. Atallah BV, Bruns W, Carandini M, and Scanziani M (2012). Parvalbumin-expressing interneurons linearly transform cortical responses to visual stimuli. Neuron 73, 159–170. 10.1016/j.neuron.2011.12.013. - DOI - PMC - PubMed

Publication types

MeSH terms

Substances