. 2022 Jan;601(7891):110-117.
doi: 10.1038/s41586-021-04186-8. Epub 2021 Nov 10.

Pre-existing polymerase-specific T cells expand in abortive seronegative SARS-CoV-2

Collaborators, Affiliations

Pre-existing polymerase-specific T cells expand in abortive seronegative SARS-CoV-2

Leo Swadling et al. Nature. 2022 Jan.

Abstract

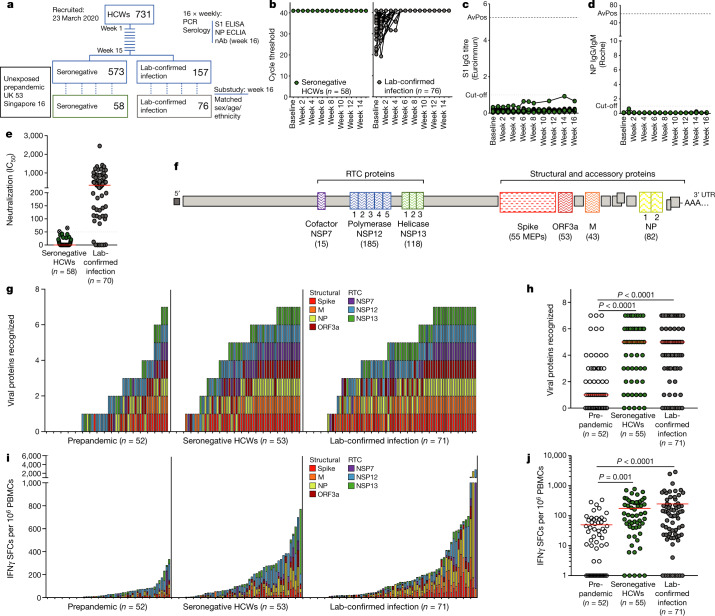
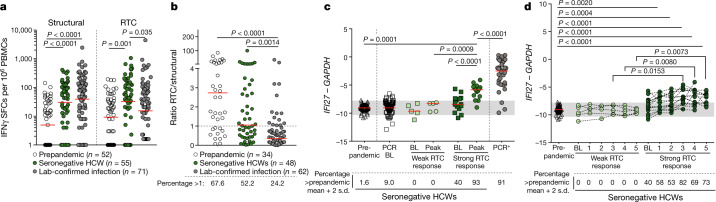
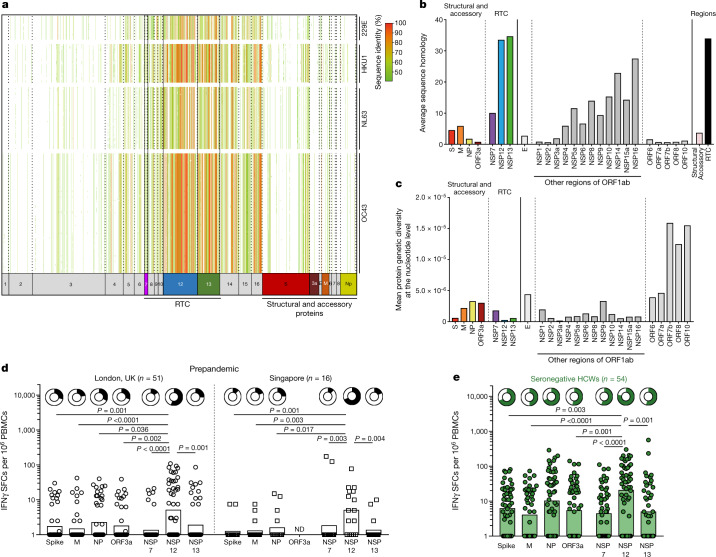
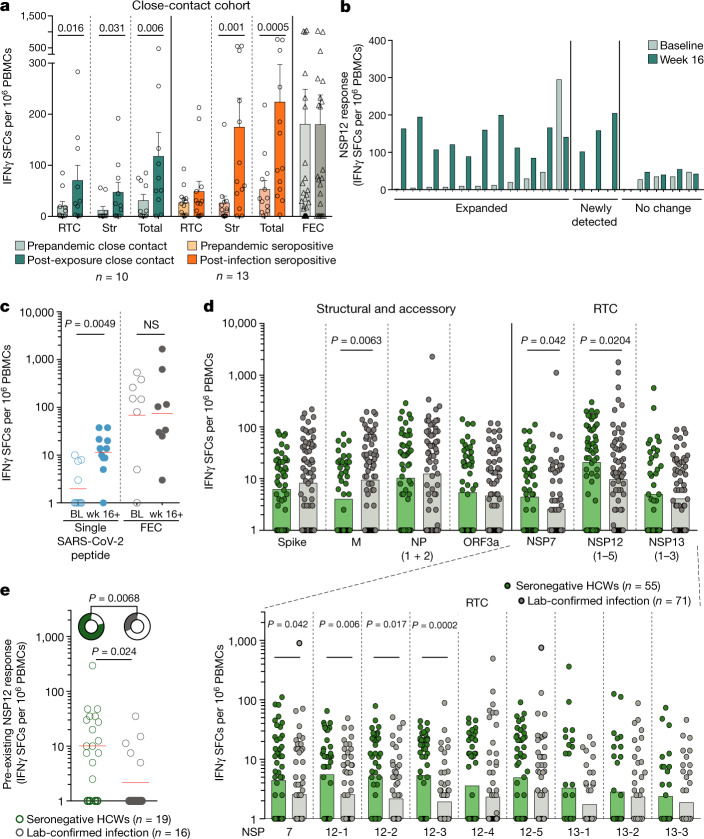
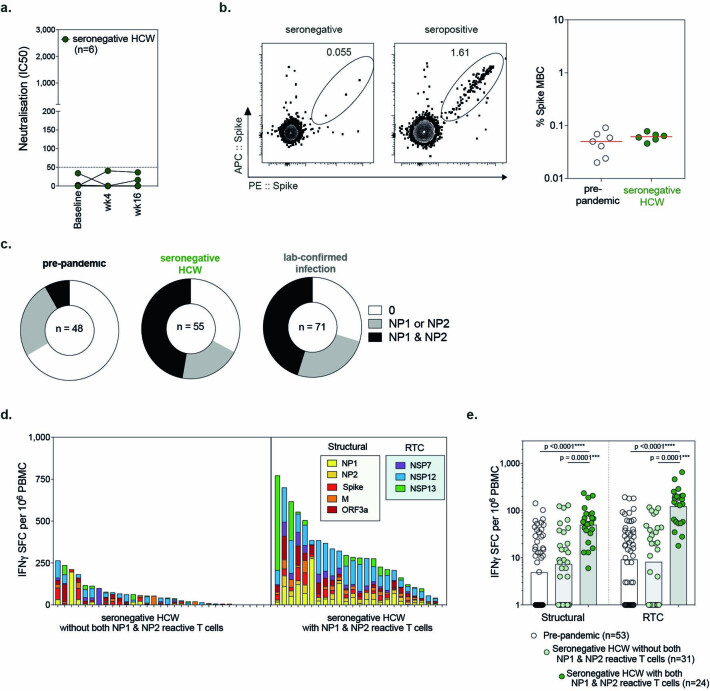
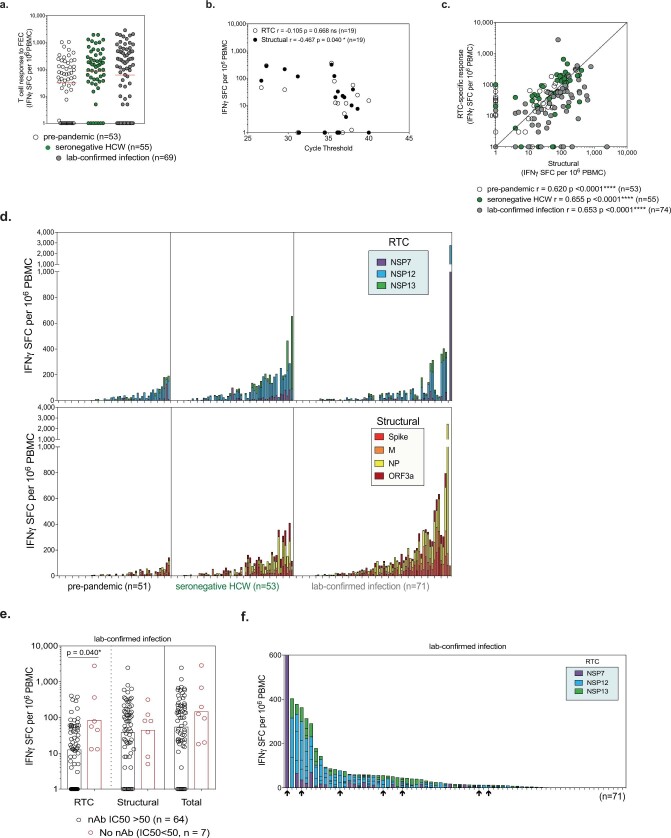
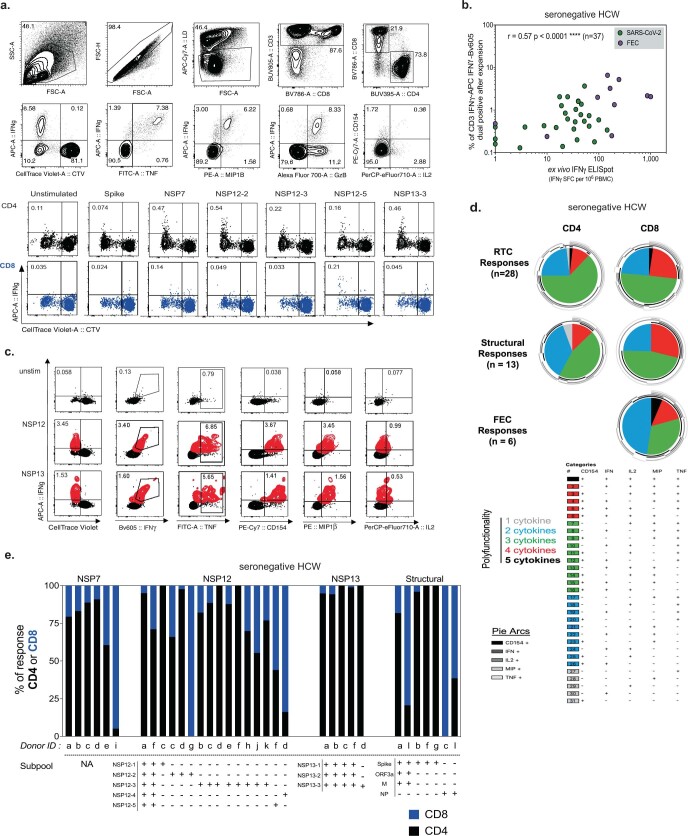
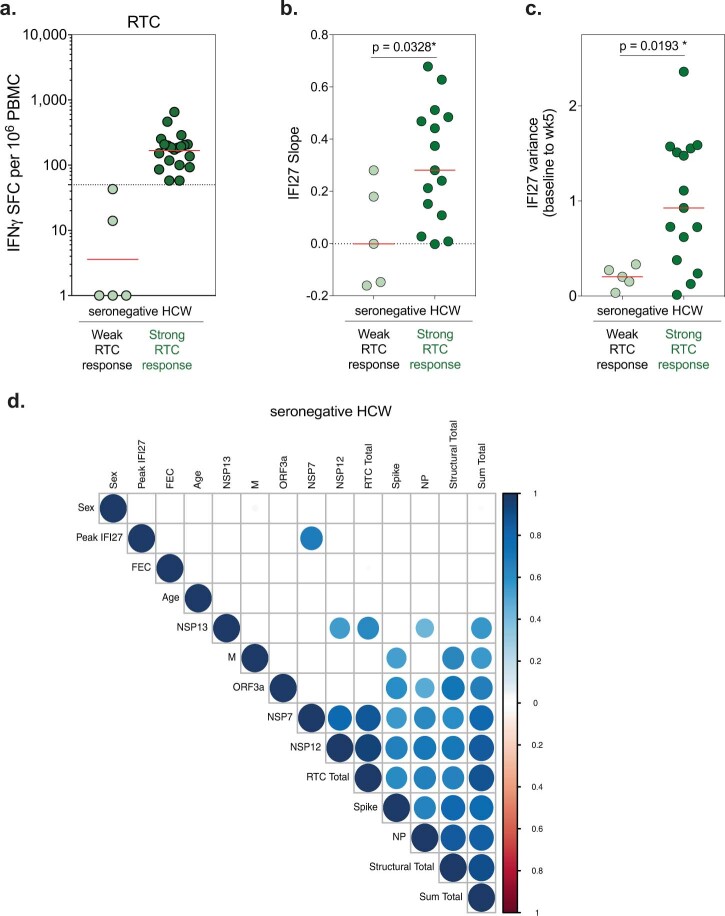
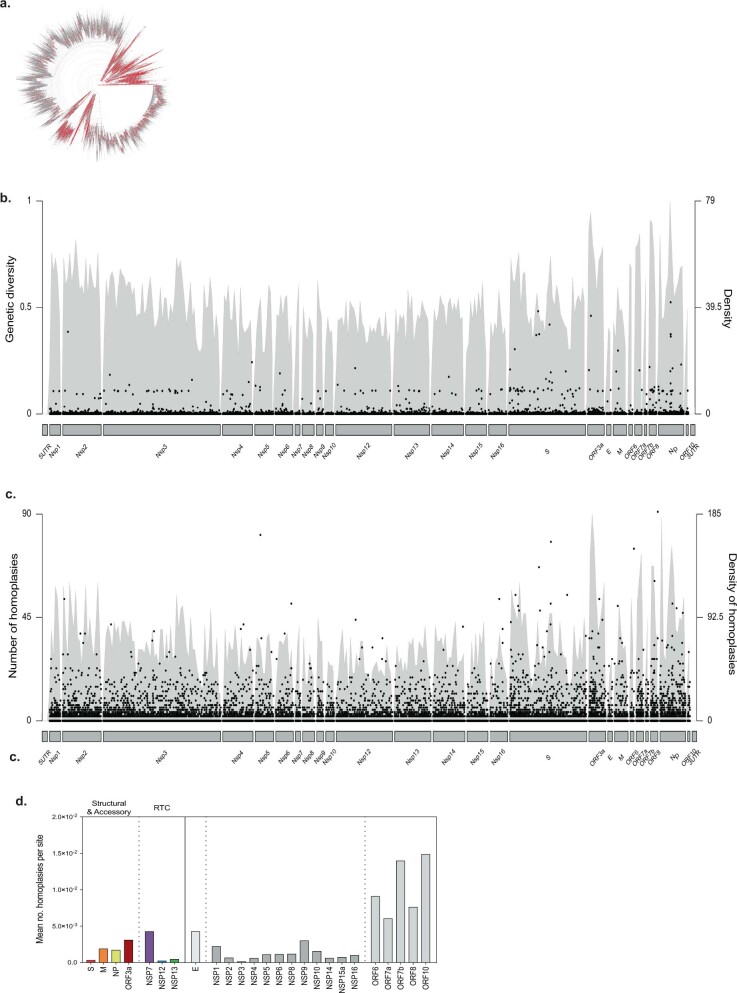
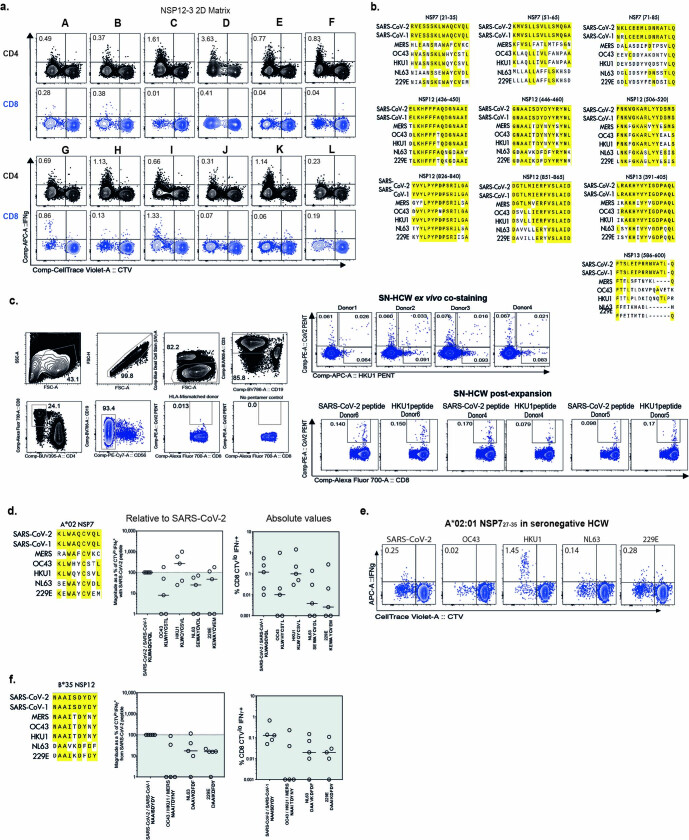
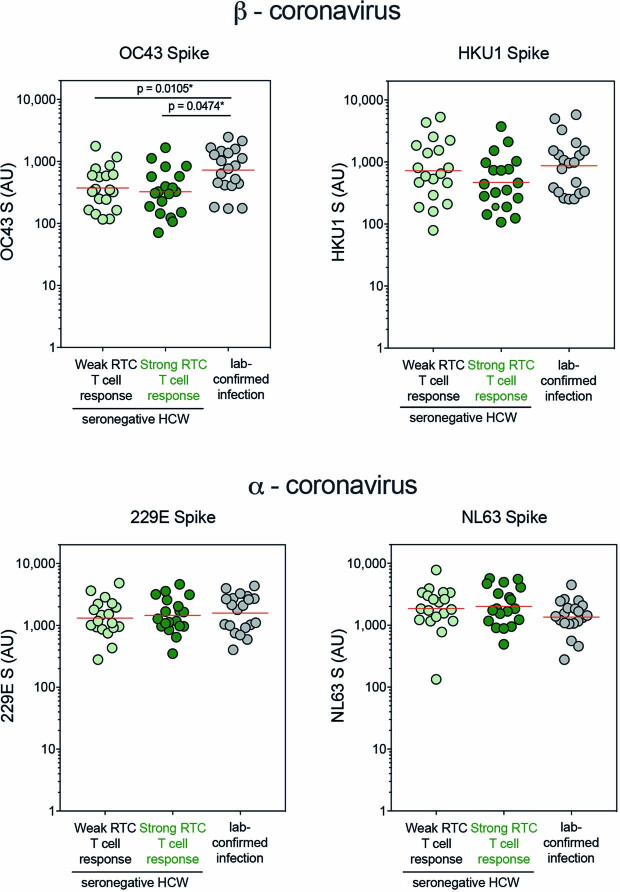
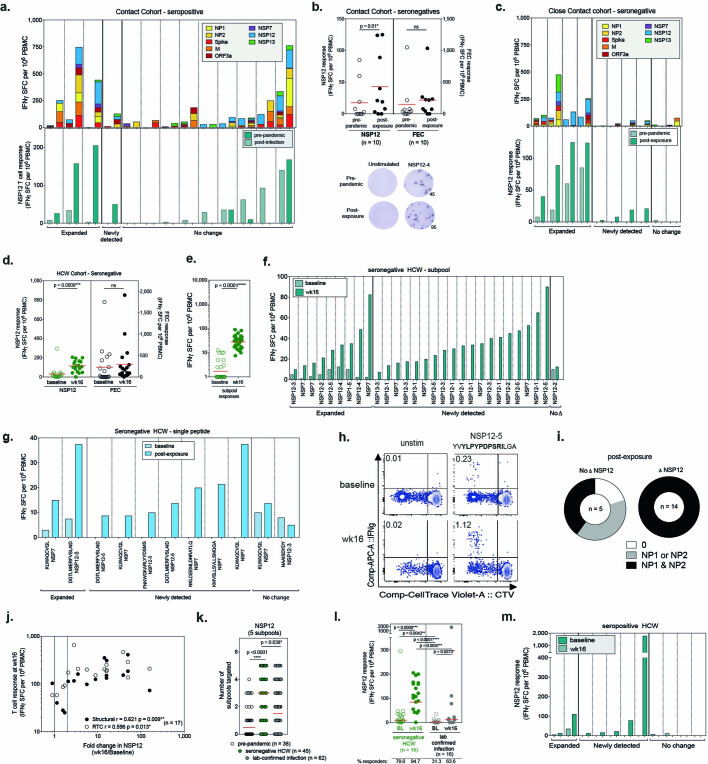
Individuals with potential exposure to severe acute respiratory syndrome coronavirus 2 (SARS-CoV-2) do not necessarily develop PCR or antibody positivity, suggesting that some individuals may clear subclinical infection before seroconversion. T cells can contribute to the rapid clearance of SARS-CoV-2 and other coronavirus infections1-3. Here we hypothesize that pre-existing memory T cell responses, with cross-protective potential against SARS-CoV-2 (refs. 4-11), would expand in vivo to support rapid viral control, aborting infection. We measured SARS-CoV-2-reactive T cells, including those against the early transcribed replication-transcription complex (RTC)12,13, in intensively monitored healthcare workers (HCWs) who tested repeatedly negative according to PCR, antibody binding and neutralization assays (seronegative HCWs (SN-HCWs)). SN-HCWs had stronger, more multispecific memory T cells compared with a cohort of unexposed individuals from before the pandemic (prepandemic cohort), and these cells were more frequently directed against the RTC than the structural-protein-dominated responses observed after detectable infection (matched concurrent cohort). SN-HCWs with the strongest RTC-specific T cells had an increase in IFI27, a robust early innate signature of SARS-CoV-2 (ref. 14), suggesting abortive infection. RNA polymerase within RTC was the largest region of high sequence conservation across human seasonal coronaviruses (HCoV) and SARS-CoV-2 clades. RNA polymerase was preferentially targeted (among the regions tested) by T cells from prepandemic cohorts and SN-HCWs. RTC-epitope-specific T cells that cross-recognized HCoV variants were identified in SN-HCWs. Enriched pre-existing RNA-polymerase-specific T cells expanded in vivo to preferentially accumulate in the memory response after putative abortive compared to overt SARS-CoV-2 infection. Our data highlight RTC-specific T cells as targets for vaccines against endemic and emerging Coronaviridae.


Conflict of interest statement

A.B. is a cofounder of Lion TCR, a biotechnology company that develops T cell receptors for the treatment of virus-related diseases and cancers. R.J.B. and D.M.A. are members of the Global T-cell Expert Consortium and have consulted for Oxford Immunotec outside the submitted work. The other authors declare no competing interests.

Figures

Fig. 1
Fig. 1. SARS-CoV-2-specific T cells in SN-HCWs.
a, Design of the HCW and prepandemic cohorts. nAb, neutralizing antibodies. b, Cycle threshold values for the E gene PCR analysis in SN-HCWs and HCWs with a laboratory (lab)-confirmed infection (undetectable at 40 cycles was assigned 41). c, d, Anti-spike S1 (c) and anti-NP antibody (d) titres in SN-HCWs (baseline to week 16; n = 58; dotted lines at assay positivity cut-off and at average peak (AvPos) response in laboratory-confirmed infection). e, Pseudovirus neutralization at week 16. The crossed circles represent individuals who were excluded from SN-HCW group (IC50 > 50). f, SARS-CoV-2 proteome highlighting RTC and structural regions assayed for T cell responses (peptide subpools are identified by the numbered boxes) and the number of overlapping 15-mer peptides (or mapped epitope peptides (MEP) for spike). gj, IFNγ ELISpot analyses. g, h, Viral proteins recognized by individuals coloured by specificity (g) and the number of viral proteins targeted by group (h). i, j, The magnitude of the T cell response coloured by viral protein (i) and the cumulative magnitude of the T cell response by group (j). The red bar shows the geometric mean. For e, h, the red bar shows the median. For h, j, statistical analysis was performed using Kruskal–Wallis tests with Dunn’s correction. M, membrane; SFCs, spot-forming cells. For be, gj, participants were from the COVIDsortium HCW cohort. Source Data.
Fig. 2
Fig. 2. RTC-specific T cell and IFI27 signature in SN-HCWs.
a, b, IFNγ ELISpot analysis at week 16. a, The magnitude of T cell response to structural regions and the RTC. b, The ratio of the T cell response to the RTC versus structural regions. The percentage of the cohort with a ratio above 1 (RTC > structural) is shown below. For a, b, the red bar shows the geometric mean. c, IFI27 transcript signal by reverse transcription PCR (RT–PCR) in unexposed prepandemic samples (n = 59), baseline (BL) samples in HCWs who remained PCR negative and seronegative throughout follow-up (n = 99), SN-HCWs with weak (n = 5, <50 SFCs per 106 PBMCs; Extended Data Fig. 4a) or strong (n = 15, >50 SFCs per 106 PBMCs) RTC-specific T cells (baseline and peak signal (weeks 0–5)), and HCWs at the time of PCR positivity (PCR+). d, The longitudinal IFI27 signal in SN-HCWs with weak or strong RTC-specific T cell responses (n values as in c). For c, d, the red bar shows the median, with 2 s.d. either side of the prepandemic cohort mean highlighted in grey; the percentage with raised IFI27 above the mean + 2 s.d. is indicated below. Statistical analysis was performed using Kruskal–Wallis analysis of variance (ANOVA) with Dunn’s correction (ad). Mann–Whitney paired t-test for paired BL versus peak (c). For ad, participants were from the COVIDsortium HCW cohort. Source Data.
Fig. 3
Fig. 3. Cross-reactive T cells targeting conserved RNA polymerase.
a, Sequence homology of SARS-CoV-2-derived peptide sequences to HCoV sequences. The columns show 15-mer SARS-CoV-2-derived peptides. The rows show HCoV genome records. Cells are coloured by the level of homology of the 15-mer to a particular HCoV proteome. Cells with no fill indicate that a sequence homology of <40% was observed. b, The average sequence homology of 15-mers covering SARS-CoV-2 proteins, or regions (pink, structural (S, M, NP and ORF3a); black, RTC (NSP7, NSP12 and NSP13)), to HCoV sequences. Viral proteins that were not assayed for T cell responses are shown in grey. c, The nucleotide diversity along the SARS-CoV-2 genome estimated with Nei’s genetic diversity index across each viral protein for all SARS-CoV-2 clades (subsampling; Extended Data Fig. 5a). d, e, IFNγ ELISpot analysis of the magnitude of T cell responses to individual SARS-CoV-2 proteins in unexposed prepandemic samples (d) and SN-HCWs at week 16 (e). The frequency of responders is shown as doughnut charts above. The bar shows the geometric mean. ND, not done. Statistical analysis was performed using Kruskal–Wallis tests with Dunn’s correction. Participants were from the COVIDsortium HCW cohort. Source Data.
Fig. 4
Fig. 4. In vivo expansion of polymerase-specific T cells in abortive infection.
ae, IFNγ ELISpot analysis. a, The magnitude of the T cell response in seronegative individuals who had close contact with cases (green) or in seropositive individuals with infection (orange) to the RTC, structural proteins (Str), a summed total, and an influenza A, EBV and CMV (FEC) peptide pool (grey seronegative/seropositive combined), before and after exposure/infection. Data are mean ± s.e.m. P values are shown at the top. b, The change in magnitude of NSP12 T cell response between recruitment and post-exposure in SN-HCWs (subgroup with top 19 RTC responses at week 16; Extended Data Fig. 4a). Expanded, greater than twofold change. c, The magnitude of paired pre- and post-exposure T cell responses to individual 9–15-mer peptides (individual responses; Extended Data Fig. 8g) from RTC or the control FEC peptide pool in SN-HCWs (weeks 16–26, 11 responses from 9 SN-HCWs). CI, confidence intervals. d, The magnitude of the T cell response to individual SARS-CoV-2 proteins (top) and to subpools (~40 overlapping peptides; bottom) within the RTC at week 16 in HCWs with a laboratory-confirmed infection or SN-HCWs. e, Pre-existing NSP12-specific T cell responses in baseline samples from SN-HCWs and the laboratory-confirmed infection group (PCR positive after baseline or seroconversion at least 4 weeks after recruitment). The doughnut plot above shows frequency. For ce, the red lines (c, e) and bars (d) show the geometric mean. Statistical analysis was performed using Wilcoxon tests (a, c), Mann–Whitney U-test and Fisher’s exact test (d, e). For a, participants were from the contact cohort (Extended Data Table 5). For be, participants were from the COVIDsortium HCW cohort (Extended Data Table 1). Source Data.
Extended Data Fig. 1
Extended Data Fig. 1. SARS-CoV-2 immunity in seronegative HCW – authentic virus neutralization and T cell response in those with NP1+NP2 responses.
a, authentic virus neutralization (Wuhan Hu-1). b, Example plots of SARS-CoV-2 spike memory B cell (MBC) staining (gated on: lymphocytes/singlets/Live, CD3-CD14-CD19+/CD20+, excluding CD38hi, IgD+ and CD21+CD27- fractions) and frequency of SARS-CoV-2 spike-specific MBC in pre-pandemic or SN-HCW (wk16; as a percentage of total MBC). Bars, median. c, Proportion of cohorts with T cell responses to NP1 and/or NP2 subpools. d, Magnitude of T cell response coloured by viral protein and e, summed response to RTC and structural regions in SN-HCW with T cells reactive against both NP1 and NP2 and against one of or neither NP1 or NP2 pools at wk16. Kruskal-Wallis with Dunn’s correction. Bars, geomean. a-e, COVIDsortium HCW cohort. NP, nucleoprotein; RTC, replication-transcription complex. Source Data
Extended Data Fig. 2
Extended Data Fig. 2. T cell responses to RTC and structural regions of SARS-CoV-2 by cohort.
a, T cell response to Flu, EBV and CMV (FEC) MHC class I restricted peptide pool. b, E gene RT-PCR cycle threshold value vs. magnitude of T cell response to RTC or structural proteins in HCW with laboratory-confirmed infection. c, Magnitude of T cell response to RTC vs. structural regions. d, Magnitude of T cell response to RTC (top) and structural regions (bottom) coloured by specificity. e, Magnitude of T cell response in laboratory-confirmed infection group in HCW with or without detectable neutralizing antibodies at wk16. f, T cell response to RTC coloured by protein in laboratory-confirmed infection group ordered by magnitude. HCW lacking neutralizing antibodies highlighted by arrows below. a-f, IFNγ ELISpot wk16. a, Red lines, geomean. e, Bars, geomean. b-c Spearman r. a,d Kruskal-Wallis ANOVA with Dunn’s correction. a-f, COVIDsortium HCW cohort. Source Data
Extended Data Fig. 3
Extended Data Fig. 3. Functional and proliferative SARS-CoV-2 specific T cells in seronegative HCWs.
a, (Upper) Example gating of CTV stained PBMC after 10-day peptide stimulation: Lymphocytes (SSC-A vs. FSC-A), single cells (FSC-H vs. FSC-A), Live cells (fixable live/dead-), CD3+, CD4+ or CD8+. Second row: Gated on CD8+ showing cytokine/intracellular protein combinations. Response to immunodominant MHC class I-restricted peptide pool against Flu, EBV, CMV (FEC) in SN-HCW. (Lower) example CTV and IFNγ staining in a SN-HCW (gated on CD4+ [black] or CD8+ [blue] T cells, percentage CTVloIFNγ+ shown). b, Correlation between the magnitude of T cells responses to SARS-CoV-2 pools or FEC after 10-day in vitro expansion (% dual staining for two anti-human IFNγ mAb clones, responses <0.1% of CD3 post-expansion excluded) and ex vivo IFNγ ELISpot in SN-HCWs. Spearman r. c, Example plots of dual cytokine or activation marker staining of SARS-CoV-2-specific T cells in an SN-HCW after 10-day expansion with peptide pools (proliferating T cells become CTVlo as they divide and dilute out marker). SARS-CoV-2-specific T cells highlighted in red (CD4+ CTVloIFNγ+). Percentage of CD4+ shown. d, polyfunctionality of CD4+ and CD8+ T cells targeting the RTC or structural regions of SARS-CoV-2 or FEC peptide pool (proportion of cytokine producing T cells that co-producing a given number of cytokines after 10-day peptide stimulation). Pie base, mean. Pie arcs show proportion of cells producing a given cytokine. e, Proportion of SARS-CoV-2-specific T cells (CTVloIFNγ+) that are CD4+ or CD8+ after 10-day expansion (the protein specificity is listed above, donor ID (a-l, corresponding to raw data in Extended Data Table 2) and peptide subpools used for stimulation listed below). a-e, SN-HCW at wk16 COVIDsortium HCW cohort.
Extended Data Fig. 4
Extended Data Fig. 4. Slope and variance of IFI27 signal in seronegative HCWs.
a, Subsetting SN-HCW group into those with weak (n=5, <50 SFCs per 106 PBMCs) or strong (n=20, >50 SFCs per 106 PBMCs) RTC-specific T cell responses at wk16. b, Slope and c, variance of IFI27 signal (wk0-5) in SN-HCW with weak (n=5) or strong (n=15) RTC-specific T cell responses at wk16. d, Correlation matrix of variables for SN-HCW (colour and size of dots represent spearman’s r, only correlations p<0.05 shown; peak IFI27 signal from wk0-5, T cell responses at wk16 to proteins, regions [RTC or structural], or total SARS-CoV-2 response). b,c, Mann-Whitney test, Red lines at median. a-d, COVIDsortium HCW cohort. Source Data
Extended Data Fig. 5
Extended Data Fig. 5. Diversity along SARS-CoV-2 genome.
a, Radial phylogeny of SARS-CoV-2 sequence diversity (611,893 genomes) with the 13,785 accessions subsampled for diversity analysis shown in red. b, Genetic diversity (Nei’s genetic diversity index) at individual nucleotides along the SARS-CoV-2 genomes, together with the density of polymorphic nucleotides over an 100-nucleotide sliding window shown in grey shading (right y-axis) and c, Homoplasies (recurrent mutational emergences) at individual nucleotides, together with the density of the number of homoplasies recorded over an 100-nucleotide sliding window shown in grey shading (right y-axis). d, Mean number of homoplasies across a given protein. Viral proteins not assayed for T cell responses are shown in grey. Source Data
Extended Data Fig 6
Extended Data Fig 6. Cross-reactive coronavirus-specific T cells in seronegative HCWs.
a, Example 2D-mapping matrix after 10-day expansion with NSP12-3 peptide pool in an SN-HCW (antigen-specific, CTVloIFNγ+; percentage of CD4+ or CD8+ shown). b, Alignment of Coronaviridae consensus sequences at immunogenic 15mers peptides (Extended Data Table 4). Conserved amino acids in yellow. c, (left) Example gating (lymphocytes (SSC-A,FSC-A)/singlets(FSC-A,FSC-H)/Live(Live-dead)/CD3+CD19-/CD8+CD4-/CD56-; example of staining in HLA-mismatched donor and fluorescence minus one for pentamer shown) and (right above) pentamer stains of PBMC from SN-HCW at wk16-26 ex vivo (co-staining of pentamers loaded with SARS-CoV-2 peptide KLWAQCVQL and HKU1 peptide KLWQYCSVL) and (right below) after 10-day expansion with SARS-CoV-2 peptide or HKU1 peptide (stained with SARS-CoV-2 peptide loaded pentamer). Percentage of CD8+ shown. d, Alignment of Coronaviridae sequences at HLA-A*02-restricted epitope in NSP7 (left) and magnitude of CD8+ T cell response (CTVloIFNγ+) after 10-day expansion with HCoV variant sequence peptides as a percentage of response with SARS-CoV-2 sequence peptide (middle) or absolute percentage of total CD8+ (right). e, Example plot of CTV vs. IFNγ after 10-day expansion with SARS-CoV-2 or HCoV sequence 9-mer peptides (gated on lymphocytes/singlets/live cells/CD3+/CD56-CD4-/CD8+). f, Alignment of Coronaviridae sequences at B*035-restricted epitope in NSP12 (left), magnitude of CD8+ T cell response (CTVloIFNγ+) after 10-day expansion with HCoV variant sequence peptides as a percentage of response with SARS-CoV-2 sequence peptide (middle) or absolute percentage of total CD8+ (right). d,f, Conserved amino acids in yellow. d-f, SN-HCW wk16. a, c-f, COVIDsortium HCW cohort. d-f, SN-HCW wk16. d,f, Lines, median.
Extended Data Fig. 7
Extended Data Fig. 7. Anti-spike IgG to human endemic coronaviruses.
Anti-spike IgG titres were measured post-infection (wk8, time of peak SARS-CoV-2 S1 IgG seropositivity in COVIDsortium HCW cohort) in HCW with laboratory-confirmed infection (n=20), and post-exposure (wk8) in SN-HCW with weak (<50 SFCs per 106 PBMCs, n=19) or strong RTC-specific T cell response at wk16 (n=19, >50 SFCs per 106 PBMCs). Red lines, geomean. Source Data
Extended Data Fig. 8
Extended Data Fig. 8. In vivo expansion of pre-existing SARS-CoV-2-reactive T cells post-infection or post-exposure.
a, Change in magnitude of T cell response between pre-pandemic and post-infection (upper panel: all proteins, lower panel: NSP12) in seropositive close contacts of cases. b, Summary data for paired pre-pandemic and post-exposure NSP12 and Flu/EBV/CMV (FEC) responses in seronegative close contacts of infections. Below; example ELISpot well images from a seronegative close contact (NSP12-4: pre-pandemic 45 and post-exposure 95 SFCs per 106 PBMCs). c, Change in magnitude of T cell response between pre-pandemic and post-exposure samples (upper panel: all proteins, lower panel: NSP12) from seronegative close contacts of cases. d, Summary data for NSP12 and FEC responses in SN-HCW (sub-group with the top RTC response at wk16, n=19, Extended Data Fig. 4a). e, Summary data and f, change in magnitude of T cell responses for individual HCW to NSP7 (15 peptide pool) or a single subpool from NSP12 and NSP13 between baseline and post-exposure in SN-HCW (wk16-26, 29 responses from 13 SN-HCW). g, Change in magnitude of T cell response to individual 9-15mer peptides pre- and post-exposure in SN-HCW (wk16-26, 11 responses from 9 SN-HCW). h, Example plots of CTVlo IFNγ+ SARS-CoV-2-specific T cells after 10day expansion of PBMC from baseline and wk16 with peptide #166 (YVYLPYPDPSRILGA) or unstimulated in an HLA-B*51+ SN-HCW (gated on CD8+, percentage of CD8+ shown, gating strategy Extended Data Fig. 3a). i, Proportion of SN-HCW with NP1 + NP2-reactive T cells grouped by those with and without newly detected or expanded NSP12 responses at wk16, Fig. 4b. j, Correlation between the fold-change in NSP12 between recruitment and wk16 and total response to RTC or structural proteins at wk16 in SN-HCWs. Dotted line at 2-fold increase. k, The breadth of the NSP12-specific T cell response (number of subpools recognized, pre-pandemic or wk16). l Change in magnitude of the T cell response to NSP12 between baseline (open circles) and wk16 (closed circles) in SN-HCW and HCW with laboratory-confirmed infection. Percentage of responders shown below. m, Change in magnitude of NSP12-specific T cell response between pre-pandemic and post-infection in HCW with laboratory-confirmed infection. a,c,f-g,m, Expanded, >2-fold increase or >35 SFCs per 106 PBMCs increase. a, Red line mean, d-e,I, Red line/bars, geomean. k, red line, median. b,d,e Wilcoxon test. l, Mann-Whitney (unpaired) and Wilcoxon (paired) tests. k, Kruskal-Wallis with Dunn’s correction. j, Spearman r. a-c, Contact cohort, Extended Data Table 5. d-m, COVIDsortium cohort Extended Data Table 1. Source Data

Comment in

Similar articles

Cited by

References

    1. Tan AT, et al. Early induction of functional SARS-CoV-2-specific T cells associates with rapid viral clearance and mild disease in COVID-19 patients. Cell Rep. 2021;34:108728. - PMC - PubMed
    1. Oberhardt V, et al. Rapid and stable mobilization of CD8+ T cells by SARS-CoV-2 mRNA vaccine. Nature. 2021;597:268–273. - PMC - PubMed
    1. Zhao JJ, et al. Airway memory CD4+ T cells mediate protective immunity against emerging respiratory coronaviruses. Immunity. 2016;44:1379–1391. - PMC - PubMed
    1. Sekine T, et al. Robust T cell immunity in convalescent individuals with asymptomatic or mild COVID-19. Cell. 2020;183:158–168. - PMC - PubMed
    1. Mateus J, et al. Selective and cross-reactive SARS-CoV-2 T cell epitopes in unexposed humans. Science. 2020;370:89–94. - PMC - PubMed

Publication types

MeSH terms