

Association of fibroblast growth factor 23 and α-klotho in hemodialysis patients during administration of ferric citrate hydrate: post hoc analysis of ASTRIO study
- PMID: 34758731
- PMCID: PMC8582217
- DOI: 10.1186/s12882-021-02575-9
Association of fibroblast growth factor 23 and α-klotho in hemodialysis patients during administration of ferric citrate hydrate: post hoc analysis of ASTRIO study
Abstract
Background: Fibroblast growth factor-23 (FGF23) and α-klotho are associated with anemia in patients with chronic kidney disease. In this post hoc analysis of the ASTRIO study (UMIN000019176), we investigated the relationship between FGF23 and α-klotho during treatment with an iron-based phosphate binder, ferric citrate hydrate (FC), compared with non-iron-based phosphate binders in hemodialysis (HD) patients. We examined the effect of iron absorption by FC on the relationship between FGF23 and α-klotho. There have been few clinical studies evaluating these biomarkers simultaneously in HD patients.
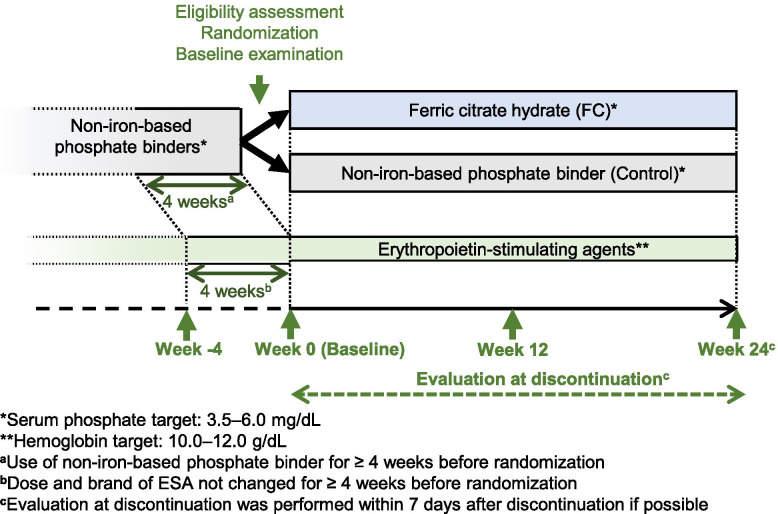
Methods: The ASTRIO study was a 24-week, randomized, open-label, multicenter trial. HD patients taking non-iron-based phosphate binder(s) were randomized at a 1:1 ratio to continue other binder(s) (control group) or switch to FC (FC group). Serum phosphate (P) and hemoglobin (Hb) were maintained within 3.5-6.0 mg/dL and 10-12 g/dL, respectively. Plasma levels of intact FGF23 (i-FGF23), C-terminal FGF23 (c-FGF23), and α-klotho were measured, as were iron-related parameters. Association analyses of FGF23 and α-klotho were conducted.
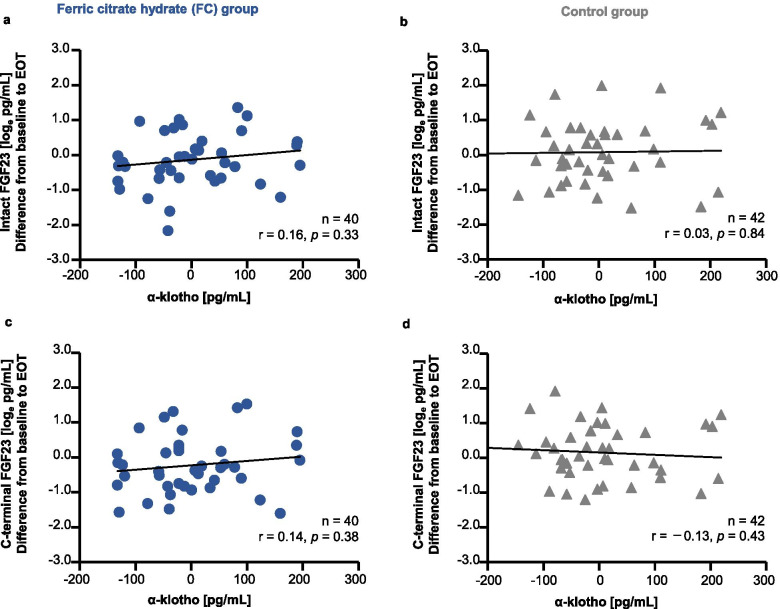
Results: Patients were randomized to FC (n = 48) and control (n = 45) groups. Serum ferritin significantly increased from baseline to end-of-treatment (EOT) in the FC group, compared with the control group (adjusted mean difference [95% confidence interval]: 79.5 [44.7, 114.4] ng/mL; p < 0.001). The mean change from baseline to EOT in c-FGF23 was significantly different between the FC and control groups (mean ± standard deviation (SD): - 0.2 ± 0.8 loge pg/mL vs. 0.2 ± 0.8 loge pg/mL, respectively; p = 0.04). The mean change from baseline to EOT in i-FGF23 and α-klotho were not significantly different between the FC and control groups (mean ± SD: - 0.1 ± 0.8 loge pg/mL vs. 0.1 ± 0.9 loge pg/mL; p = 0.33, and 2.0 ± 91.5 pg/mL vs. - 8.9 ± 145.3; p = 0.58, respectively). However, both forms of FGF23 and α-klotho were not significantly associated with each other in both groups.
Conclusions: Iron absorbed via FC administration in HD patients did not influence the correlation relationship between plasma levels of FGF23 and α-klotho under the condition of serum P and Hb were maintained.
Trial registration: ASTRIO study ( UMIN000019176 , registered at UMIN Clinical Trials Registry on October 1, 2015).
Keywords: ASTRIO study; FGF23; Ferric citrate hydrate; Hemodialysis; iron-based phosphate binder; α-Klotho.
© 2021. The Author(s).
Conflict of interest statement
K.I. is an employee of Torii; K.Y. received consulting fees from Torii, Japan Tobacco Inc. and Kyowa Kirin Co., Ltd.; M.N. received consulting fees from Torii; M.F. received consulting fees from Torii, Japan Tobacco Inc. and Bayer Yakuhin Ltd., and research grant and consulting fees from Kyowa Kirin Co., Ltd. and Chugai Pharmaceutical Co., Ltd.; and H.H. received consulting fees from Torii and Japan Tobacco Inc.
Figures


References
-
- Noordzij M, Cranenburg EM, Engelsman LF, Hermans MM, Boeschoten EW, Brandenburg VM, et al. Progression of aortic calcification is associated with disorders of mineral metabolism and mortality in chronic dialysis patients. Nephrol Dial Transplant. 2011;26:1662–1619. doi: 10.1093/ndt/gfq582. - DOI - PubMed
Publication types
MeSH terms
Substances
LinkOut - more resources
Full Text Sources
Medical
