. 2021 Nov 10;21(1):65.
doi: 10.1186/s12896-021-00724-4.

Optimization of lipase production using fungal isolates from oily residues

Affiliations

Optimization of lipase production using fungal isolates from oily residues

Leticia Miranda Cesário et al. BMC Biotechnol. .

Abstract

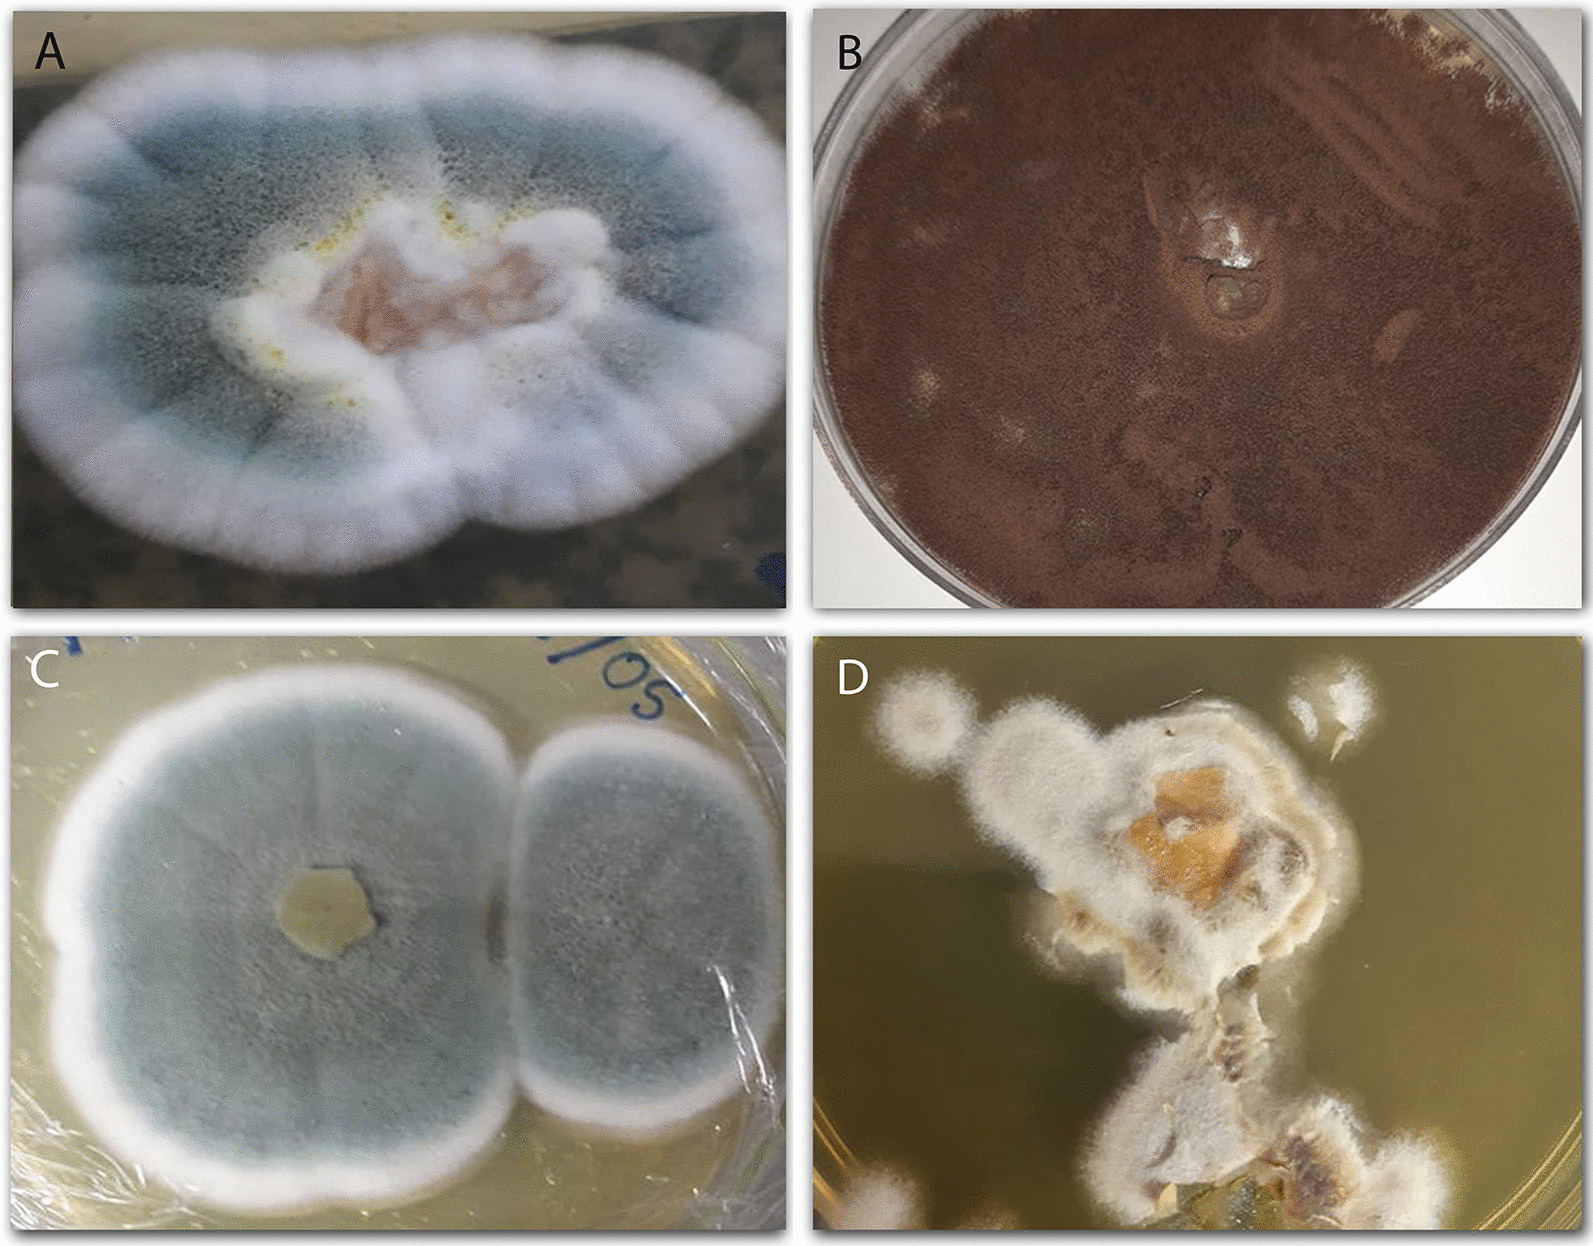
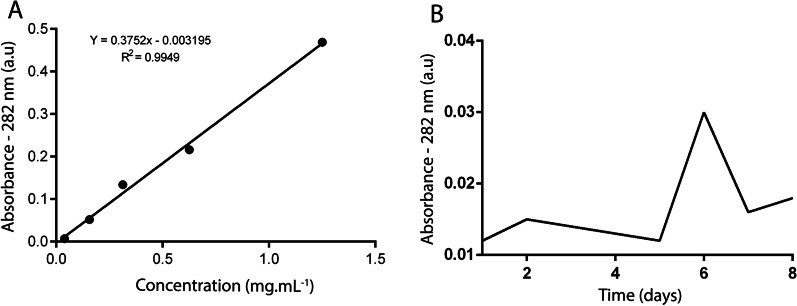
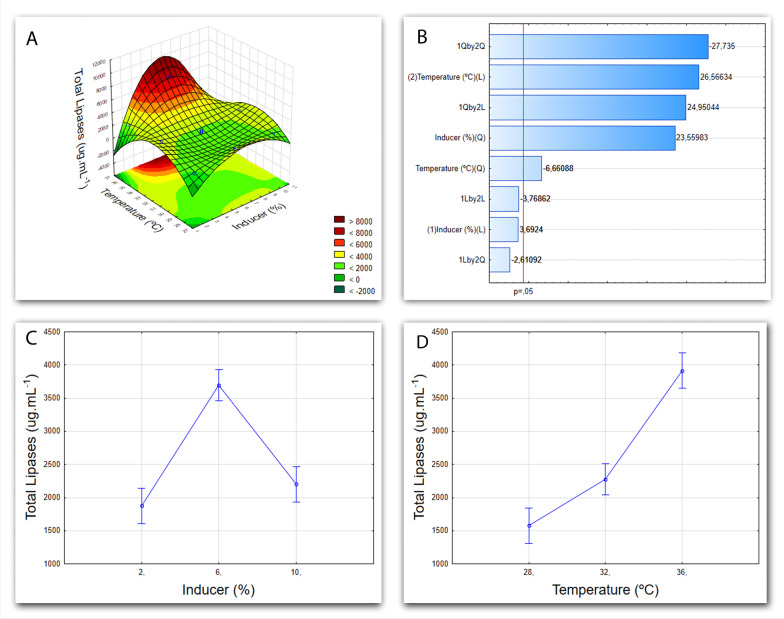
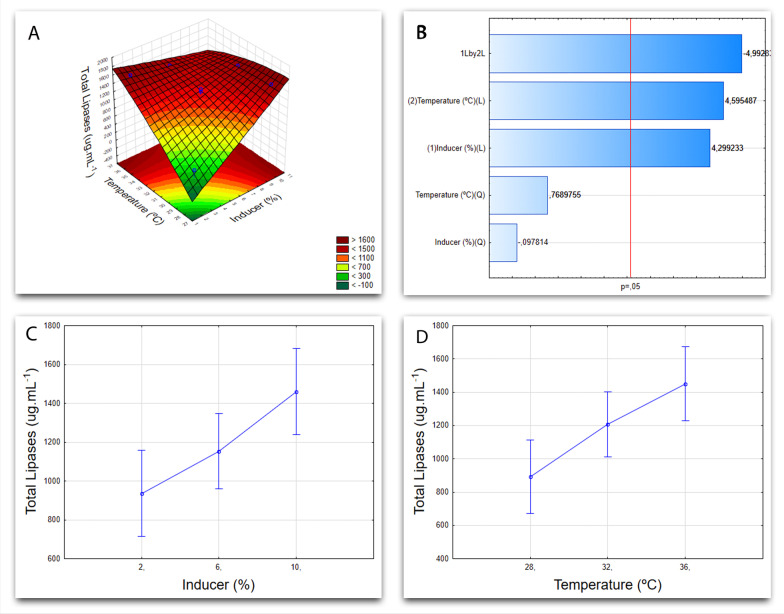
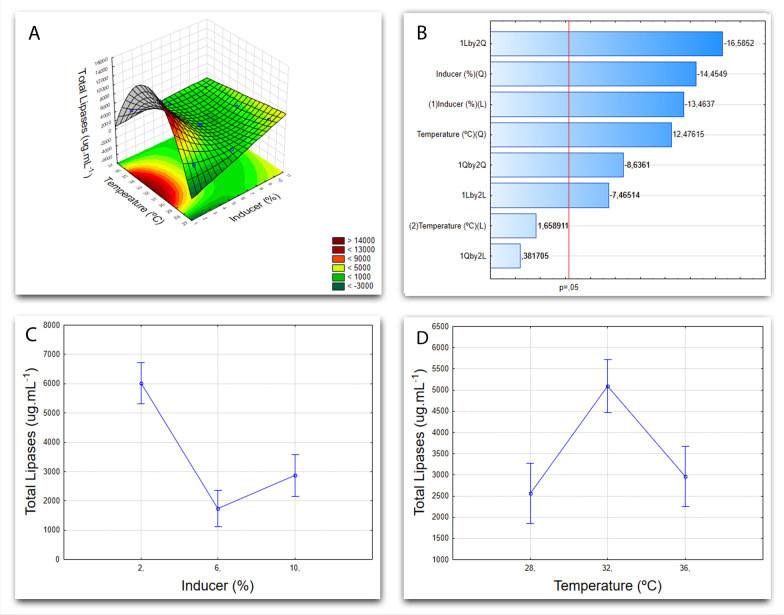
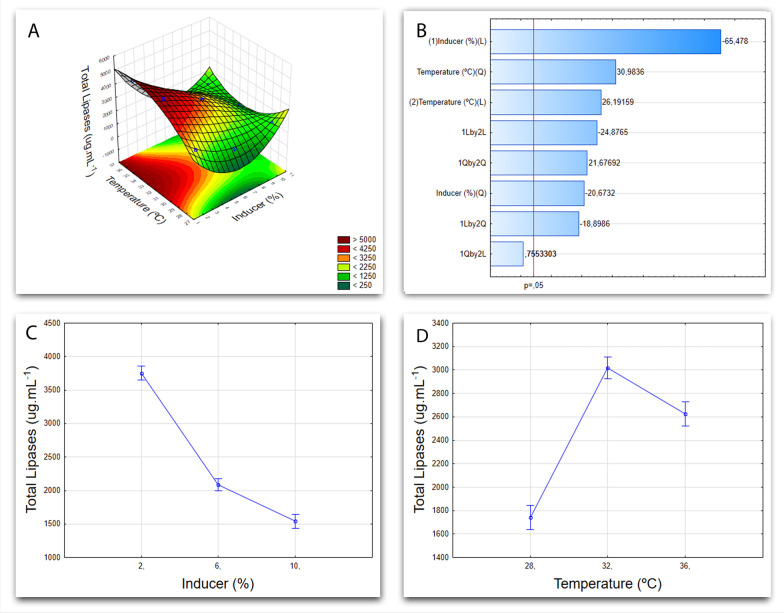
Lipases are triacylglycerol hydrolases that catalyze hydrolysis, esterification, interesterification, and transesterification reactions. These enzymes are targets of several industrial and biotech applications, such as catalysts, detergent production, food, biofuels, wastewater treatment, and others. Microbial enzymes are preferable for large scale production due to ease of production and extraction. Several studies have reported that lipases from filamentous fungi are predominantly extracellular and highly active. However, there are many factors that interfere with enzyme production (pH, temperature, medium composition, agitation, aeration, inducer type, and concentration, etc.), making control difficult and burdening the process. This work aimed to optimize the lipase production of four fungal isolates from oily residues (Penicillium sp., Aspergillus niger, Aspergillus sp., and Aspergillus sp.). The lipase-producing fungi isolates were morphologically characterized by optical and scanning electron microscopy. The optimal lipase production time curve was previously determined, and the response variable used was the amount of total protein in the medium after cultivation by submerged fermentation. A complete factorial design 32 was performed, evaluating the temperatures (28 °C, 32 °C, and 36 °C) and soybean oil inducer concentration (2%, 6%, and 10%). Each lipase-producing isolate reacted differently to the conditions tested, the Aspergillus sp. F18 reached maximum lipase production, compared to others, under conditions of 32 °C and 2% of oil with a yield of 11,007 (µg mL-1). Penicillium sp. F04 achieved better results at 36 °C and 6% oil, although for Aspergillus niger F16 was at 36 °C and 10% oil and Aspergillus sp. F21 at 32 °C and 2% oil. These results show that microorganisms isolated from oily residues derived from environmental sanitation can be a promising alternative for the large-scale production of lipases.

Keywords: Factorial design; Fungal lipases; Oily waste; Optimization.


Conflict of interest statement

The authors declare that they have no competing interests.

Figures

Fig. 1
Fig. 1
Images obtained from low magnification for observation of the coloniesof Penicillium sp.F04 (A), Aspergillus niger F16 (B), Aspergillus sp. F18 (C), and Aspergillus sp. F21 (D)
Fig. 2
Fig. 2
Images obtained through scanning electron microscopy (SEM) to observe the microstructures of the fungalisolates: Penicillium sp. (A), Aspergillus niger (B), Aspergillus sp. (C), and Aspergillus sp. (D)
Fig. 3
Fig. 3
Standard curve for total protein dosing, using BSA as protein model (A); Optimum time curve for production of lipases by Penicillium sp. F04 isolate (B)
Fig. 4
Fig. 4
Cultivation graphs for Penicillium sp. F04. A Factorial design 32 graph of the response surface, demonstrating the influence of the variables (temperature and inducer) on the response variable (total proteins). B Pareto Chart showing the linear (L) and quadratic (Q) effects of each of the variables tested. C Graph of temperature influence as a function of the response variable (total proteins). D Graph showing the influence of the inducer as a function of the response variable (total proteins)
Fig. 5
Fig. 5
Cultivation graphs for Aspergillus niger F16. A Graph of response surface from the factorial design 32, showing the influence of variables, that is, temperature and inducer, on the response variable (total proteins). B Pareto Chart with linear (L) and quadratic (Q) effects of each of the tested variables. C Graph showing the influence of temperature as a function of the response variable (total proteins). D Likewise, the graph shown the influence of the inducer as a function of the response variable (total proteins)
Fig. 6
Fig. 6
Cultivation graphs for Aspergillus sp. F18. A Factorial design 32 graph of the response surface, showing the influence of variables (temperature and inducer) on the response variable (total proteins). B Pareto Chart showing the linear (L) and quadratic (Q) effects of each of the variables tested. C Graph showing the influence of temperature as a function of the response variable (total proteins). D Graph showing the influence of the inductor over the response variable (total proteins)
Fig. 7
Fig. 7
Cultivation graphics for Aspergillus sp. F21. A Response surface graph from the factorial design 32, exhibiting the variables (temperature and inducer) influence on the response variable (total proteins). B Pareto Chart showing the linear (L) and quadratic (Q) effects of each of the variables tested. C Graph showing the influence of temperature over the response variable (total proteins). D Graph showing the influence of the inducer in function of the response variable (total proteins)

References

    1. Gonçalves CCS, Marsaioli AJ. Facts and trends of biocatalysis. Quim Nova. 2013;36:1587–1590. doi: 10.1590/S0100-40422013001000016. - DOI
    1. Alcalde M, Ferrer M, Plou FJ, Ballesteros A. Environmental biocatalysis: from remediation with enzymes to novel green processes. Trends Biotechnol. 2006 doi: 10.1016/j.tibtech.2006.04.002. - DOI - PubMed
    1. Jegannathan KR, Nielsen PH. Environmental assessment of enzyme use in industrial production—a literature review. J Clean Prod. 2013 doi: 10.1016/j.jclepro.2012.11.005. - DOI
    1. Jaeger KE, Eggert T. Lipases for biotechnology. Curr Opin Biotechnol. 2002 doi: 10.1016/S0958-1669(02)00341-5. - DOI - PubMed
    1. Sharma R, Chisti Y, Banerjee UC. Production, purification, characterization, and applications of lipases. Biotech Adv. 2001 doi: 10.1016/S0734-9750(01)00086-6. - DOI - PubMed

Publication types

LinkOut - more resources