. 2021 Nov 10;18(1):263.
doi: 10.1186/s12974-021-02317-6.

DSS-induced inflammation in the colon drives a proinflammatory signature in the brain that is ameliorated by prophylactic treatment with the S100A9 inhibitor paquinimod

Affiliations

DSS-induced inflammation in the colon drives a proinflammatory signature in the brain that is ameliorated by prophylactic treatment with the S100A9 inhibitor paquinimod

Sarah Talley et al. J Neuroinflammation. .

Abstract

Background: Inflammatory bowel disease (IBD) is established to drive pathological sequelae in organ systems outside the intestine, including the central nervous system (CNS). Many patients exhibit cognitive deficits, particularly during disease flare. The connection between colonic inflammation and neuroinflammation remains unclear and characterization of the neuroinflammatory phenotype in the brain during colitis is ill-defined.

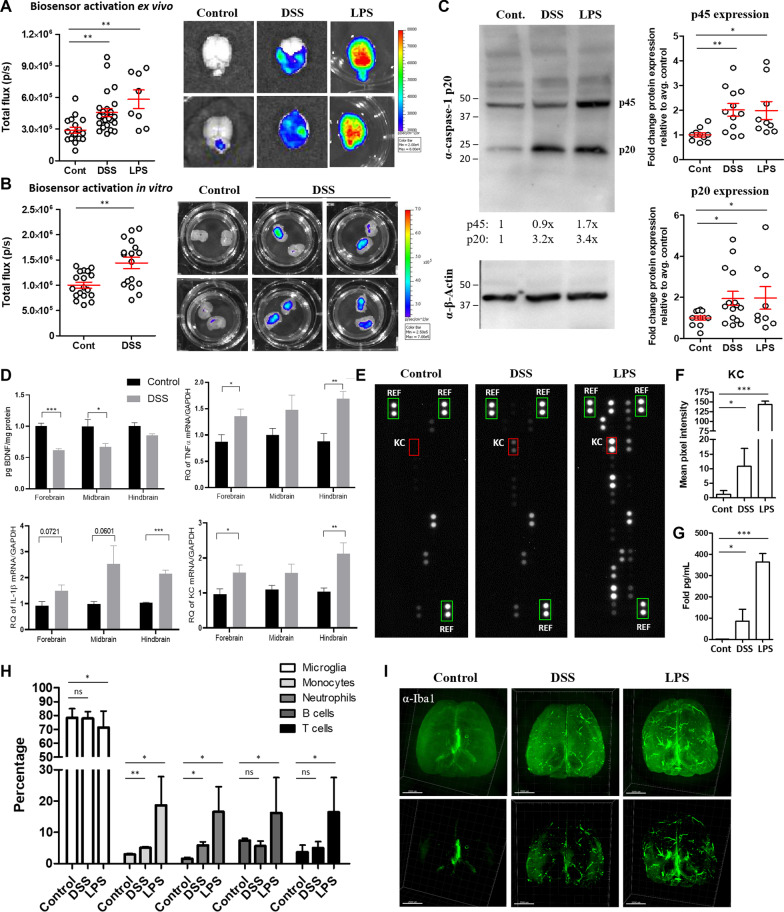
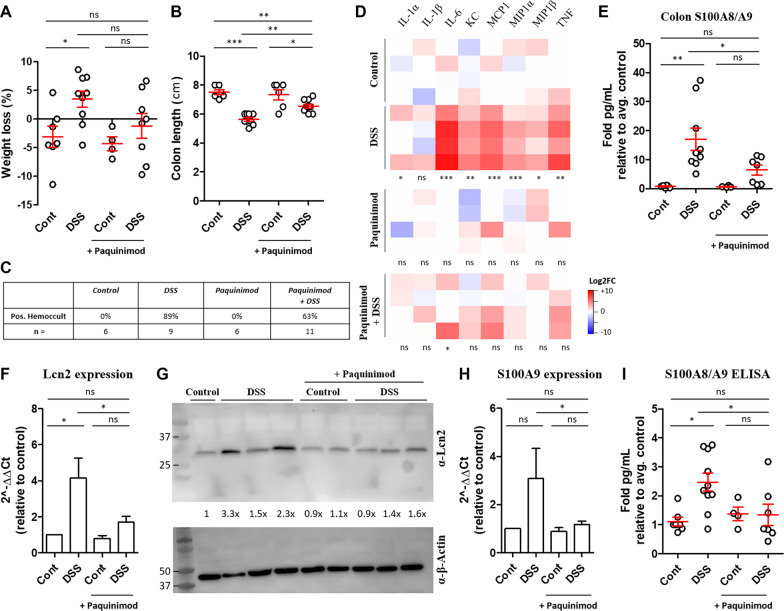
Methods: Transgenic mice expressing a bioluminescent reporter of active caspase-1 were treated with 2% dextran sodium sulfate (DSS) for 7 days to induce acute colitis, and colonic, systemic and neuroinflammation were assessed. In some experiments, mice were prophylactically treated with paquinimod (ABR-215757) to inhibit S100A9 inflammatory signaling. As a positive control for peripheral-induced neuroinflammation, mice were injected with lipopolysaccharide (LPS). Colonic, systemic and brain inflammatory cytokines and chemokines were measured by cytokine bead array (CBA) and Proteome profiler mouse cytokine array. Bioluminescence was quantified in the brain and caspase activation was confirmed by immunoblot. Immune cell infiltration into the CNS was measured by flow cytometry, while light sheet microscopy was used to monitor changes in resident microglia localization in intact brains during DSS or LPS-induced neuroinflammation. RNA sequencing was performed to identify transcriptomic changes occurring in the CNS of DSS-treated mice. Expression of inflammatory biomarkers were quantified in the brain and serum by qRT-PCR, ELISA and WB.

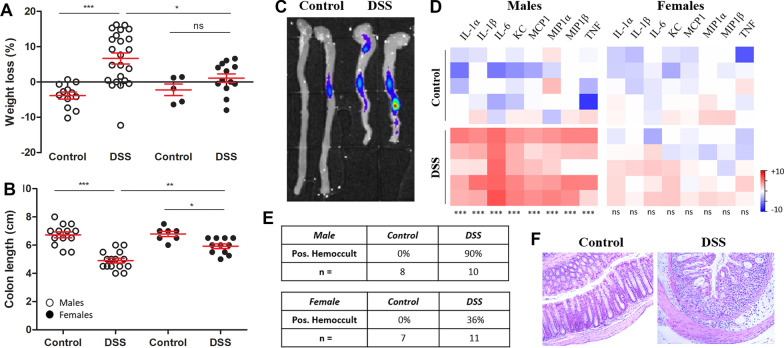
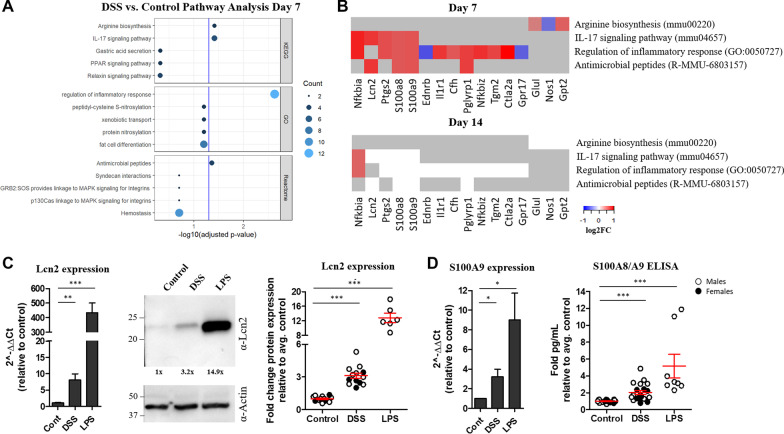
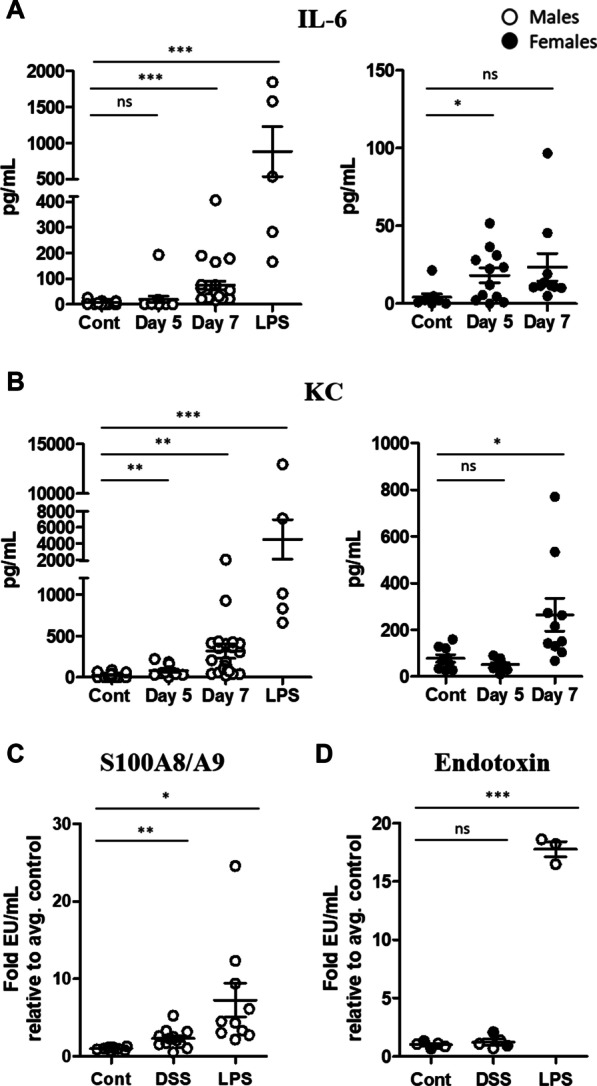
Results: DSS-treated mice exhibited clinical hallmarks of colitis, including weight loss, colonic shortening and inflammation in the colon. We also detected a significant increase in inflammatory cytokines in the serum and brain, as well as caspase and microglia activation in the brain of mice with ongoing colitis. RNA sequencing of brains isolated from DSS-treated mice revealed differential expression of genes involved in the regulation of inflammatory responses. This inflammatory phenotype was similar to the signature detected in LPS-treated mice, albeit less robust and transient, as inflammatory gene expression returned to baseline following cessation of DSS. Pharmacological inhibition of S100A9, one of the transcripts identified by RNA sequencing, attenuated colitis severity and systemic and neuroinflammation.

Conclusions: Our findings suggest that local inflammation in the colon drives systemic inflammation and neuroinflammation, and this can be ameliorated by inhibition of the S100 alarmin, S100A9.

Keywords: Caspase-1; Colitis; Inflammation; Neuroinflammation; S100A8/A9.


Conflict of interest statement

The authors declare that they have no competing interests.

Figures

Fig. 1
Fig. 1
Mice with colitis exhibit inflammation in the colon. Male mice (white circles) and female mice (black circles) were treated with 2% DSS for 7 days. Body weight (A), colon lenghts (B) and caspase biosensor signal (C) were measured. Colon sections isolated from control and DSS mice were homogenized and inflammatory cytokine and chemokine levels were measured by CBA in control or DSS-treated male mice (D). CBA data are expressed as the log2FC in cytokine/chemokine expression, relative to the average cytokine/chemokine levels measured in control mice. Representative expression data from 5 mice in each group are shown (D). Fecal samples were isolated from control and DSS-treated mice and assessed for blood in the stool by Hemoccult (E). Representative colonic H&E sections from one control male and one DSS-treated male mouse (F). One-way ANOVA followed by a Bonferroni (95% CI, p < 0.05) multiple comparisons test (A, B). Student’s t test comparing DSS to respective control for each individual cytokine / chemokine (D). *** = p < 0.0005, ** = p < 0.005, * = p < 0.05
Fig. 2
Fig. 2
DSS-treated mice exhibit increased neuroinflammation but not immune cell infiltration in the brain. Bioluminescence was quantified from brain tissue harvested from caspase reporter mice either treated with normal drinking water (control) or 2% DSS for 7 days, or injected with LPS (100 μg, 24 h) (A). 200 μm organotypic slice cultures were generated from control or DSS brains and after one week in vitro, luciferase signal was measured using the IVIS (B). Brains were isolated from control or DSS mice, or mice injected i.p with 100 μg LPS for 24 h. Tissues were homogenized and caspase-1 expression was measured in lysates by western blot (C). Whole brains were sectioned into the indicated regions and BDNF, TNFα, IL-1β and KC levels were measured by ELISA or qRT-PCR, n = 5–8 animals/group (D). Brains were homogenized, lysed and equal amounts of protein lysates were incubated with the mouse cytokine detection antibodies and applied to nitrocellulose membranes pre-coated with 40 different anti-cytokine antibodies in duplicate and protein expression was measured by chemiluminescence (E). Green boxes indicate reference control. Mean pixel intensity of KC (red box) was quantified using ImageJ (F). CBA was performed on brain homogenates and KC expression was quantified (G). Brains isolated from control, DSS and LPS-treated mice were digested and isolated cells were stained for flow cytometric analysis of the indicated immune cell populations, following the gating strategy depicted in Additional file 4 (specifically live, CD45 + , subgated on markers for the indicated immune cell population) (H). Brains were fixed, stained with anti-Iba1 antibody, clarified and imaged using a light sheet microscope (I). Representative images from each group, low min signal panels on the top and high min signal panels on the bottom (I). Student’s t test comparing DSS or LPS to control. *** = p < 0.0005, ** = p < 0.005, * = p < 0.05
Fig. 3
Fig. 3
Differential gene expression in brain tissue isolated from mice with colitis reveals an inflammatory signature. Pathway analysis was performed on the differentially expressed genes in the brains of mice treated with DSS compared to control. Significantly enriched terms (adjusted p-value < 0.05) in the KEGG, GO, and Reactome databases are shown (A, B). Genes specifically involved in each term are shown in B. Heatmaps depict the log2FC with upregulated genes shown in red, downregulated genes shown in blue, and unchanged genes shown in white (B). Grey represents genes not involved in that pathway (B). Brain tissue was isolated from male and female control mice, mice treated with 2% DSS for 7 days or 100 μg LPS for 24 h. RNA and protein extracted from homogenized tissues were used for qRT-PCR, ELISA or WB to measure Lcn2 (C), S100A9 and S100A8/A9 (D) expression levels in the brain. For qRT-PCR data, n = 4–13 mice per group. Student’s t test comparing DSS or LPS to control. *** = p < 0.0005, ** = p < 0.005, * = p < 0.05.
Fig. 4
Fig. 4
DSS-treated mice exhibit increased inflammatory markers in the serum by day 7 but endotoxin levels remain low. Serum was isolated from male and female control and DSS-treated mice at the indicated time points or mice injected with 100 μg LPS for 24 h. IL-6 and KC levels were quantified by CBA and S100A8/A9 levels were measured by ELISA (AC). Serum isolated on day 7 from DSS-treated mice or 24 h after injection with 0.5 mg/kg LPS was inactivated, diluted 50-fold in endotoxin-free water and endotoxin levels were quantified (D). Student’s t test comparing DSS or LPS to control. *** = p < 0.0005, ** = p < 0.005, * = p < 0.05
Fig. 5
Fig. 5
Prophylactic administration of paquinimod reduces inflammation in DSS-treated mice. Male mice were given paquinimod (10 mg/kg/day) in the drinking water starting one week prior to DSS. Mice were treated with or without 2% DSS in the absence or presence of paquinimod. 7 days later, weight loss (A), colon lengths (B) and Hemoccult (C) were measured. Cytokine/chemokine and S100A8/A9 levels were measured in the colon by CBA (D) and ELISA (E). RNA and protein were isolated from brain tissue homogenates and qRT-PCR was performed to quantify the upregulation of the indicated transcripts (F, H) and proteins (G, I). One-way ANOVA followed by a Bonferroni (90% CI, * = p < 0.1) (A) or Tukey (95% CI) (B, E, F, H, I) multiple comparisons test. Student’s t test comparing each cytokine/chemokine to respective control (D). *** = p < 0.0005, ** = p < 0.005, * = p < 0.05

References

    1. Ananthakrishnan AN. Epidemiology and risk factors for IBD. Nat Rev Gastroenterol Hepatol. 2015;12(4):205–217. - PubMed
    1. Molodecky NA, et al. Increasing incidence and prevalence of the inflammatory bowel diseases with time, based on systematic review. Gastroenterology. 2012;142(1):46–54 e42; quiz e30. - PubMed
    1. Hendrickson BA, Gokhale R, Cho JH. Clinical aspects and pathophysiology of inflammatory bowel disease. Clin Microbiol Rev. 2002;15(1):79–94. - PMC - PubMed
    1. Vavricka SR, et al. Extraintestinal manifestations of inflammatory bowel disease. Inflamm Bowel Dis. 2015;21(8):1982–1992. - PMC - PubMed
    1. Levine JS, Burakoff R. Extraintestinal manifestations of inflammatory bowel disease. Gastroenterol Hepatol (N Y) 2011;7(4):235–241. - PMC - PubMed