

Longitudinal Copy-Number Alteration Analysis in Plasma Cell-Free DNA of Neuroendocrine Neoplasms is a Novel Specific Biomarker for Diagnosis, Prognosis, and Follow-up
- PMID: 34759042
- PMCID: PMC9401546
- DOI: 10.1158/1078-0432.CCR-21-2291
Longitudinal Copy-Number Alteration Analysis in Plasma Cell-Free DNA of Neuroendocrine Neoplasms is a Novel Specific Biomarker for Diagnosis, Prognosis, and Follow-up
Abstract
Purpose: As noninvasive biomarkers are an important unmet need for neuroendocrine neoplasms (NEN), biomarker potential of genome-wide molecular profiling of plasma cell-free DNA (cfDNA) was prospectively studied in patients with NEN.
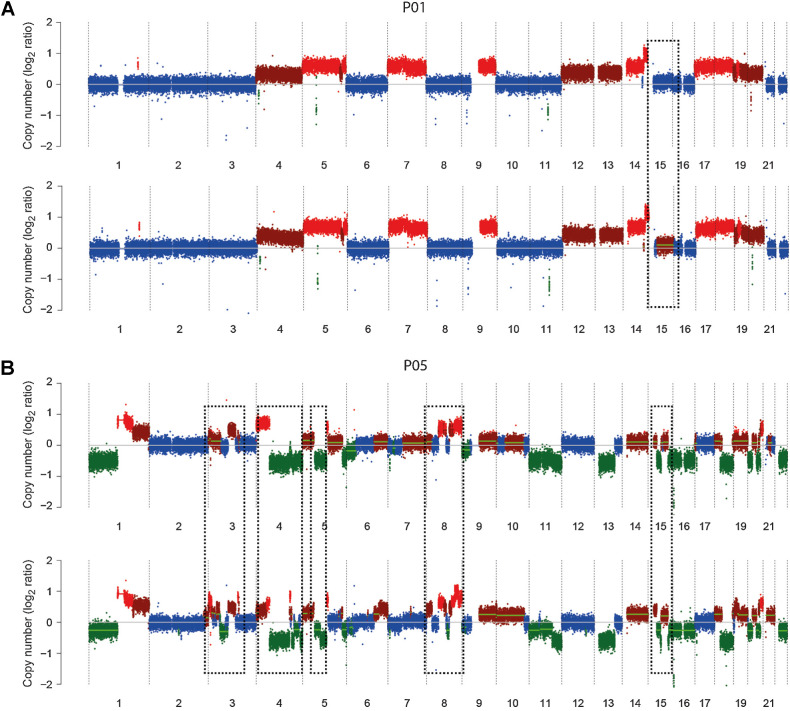
Experimental design: Longitudinal plasma samples were collected from patients with well-differentiated, metastatic gastroenteropancreatic and lung NEN. cfDNA was subjected to shallow whole-genome sequencing to detect genome-wide copy-number alterations (CNA) and estimate circulating tumor DNA (ctDNA) fraction, and correlated to clinicopathologic and survival data. To differentiate pancreatic NENs (PNEN) from pancreatic adenocarcinomas (PAAD) using liquid biopsies, a classification model was trained using tissue-based CNAs and validated in cfDNA.
Results: One hundred and ninety-five cfDNA samples from 43 patients with NEN were compared with healthy control cfDNA (N = 100). Plasma samples from patients with PNEN (N = 21) were used for comparison with publicly available PNEN tissue (N = 98), PAAD tissue (N = 109), and PAAD cfDNA (N = 96). Thirty percent of the NEN cfDNA samples contained ctDNA and 44% of the patients had at least one ctDNA-positive (ctDNA+) sample. CNAs detected in cfDNA were highly specific for NENs and the classification model could distinguish PAAD and PNEN cfDNA samples with a sensitivity, specificity, and AUC of 62%, 86%, and 79%, respectively. ctDNA-positivity was associated with higher World Health Organization (WHO) grade, primary tumor location, and higher chromogranin A and neuron-specific enolase values. Overall survival was significantly worse for ctDNA+ patients and increased ctDNA fractions were associated with poorer progression-free survival.
Conclusions: Sequential genome-wide profiling of plasma cfDNA is a novel, noninvasive biomarker with high specificity for diagnosis, prognosis, and follow-up in metastatic NENs.
©2021 The Authors; Published by the American Association for Cancer Research.
Figures


Comment on
-
Selected Articles from This Issue.Clin Cancer Res. 2022 Jan 15;28(2):247. doi: 10.1158/1078-0432.CCR-28-2-HI. Clin Cancer Res. 2022. PMID: 35045957 No abstract available.
References
-
- Rindi G, Klimstra DS, Abedi-Ardekani B, Asa SL, Bosman FT, Brambilla E, et al. A common classification framework for neuroendocrine neoplasms: an International Agency for Research on Cancer (IARC) and World Health Organization (WHO) expert consensus proposal. Mod Pathol 2018;31:1770–86. - PMC - PubMed
-
- Marotta V, Zatelli MC, Sciammarella C, Ambrosio MR, Bondanelli M, Colao A, et al. Chromogranin A as circulating marker for diagnosis and management of neuroendocrine neoplasms: more flaws than fame. Endocr Relat Cancer 2018;25:R11–29. - PubMed
-
- Hofland J, Zandee WT, de Herder WW. Role of biomarker tests for diagnosis of neuroendocrine tumours. Nat Rev Endocrinol 2018;14:656–69. - PubMed
-
- van Adrichem RCS, Kamp K, Vandamme T, Peeters M, Feelders RA, de Herder WW. Serum neuron-specific enolase level is an independent predictor of overall survival in patients with gastroenteropancreatic neuroendocrine tumors. Ann Oncol 2015;27:746–7. - PubMed
Publication types
MeSH terms
Substances
LinkOut - more resources
Full Text Sources
Medical
Research Materials
