. 2021 Nov 10;7(1):346.
doi: 10.1038/s41420-021-00746-z.

Moderate-intensity exercise alleviates pyroptosis by promoting autophagy in osteoarthritis via the P2X7/AMPK/mTOR axis

Affiliations

Moderate-intensity exercise alleviates pyroptosis by promoting autophagy in osteoarthritis via the P2X7/AMPK/mTOR axis

Zihao Li et al. Cell Death Discov. .

Abstract

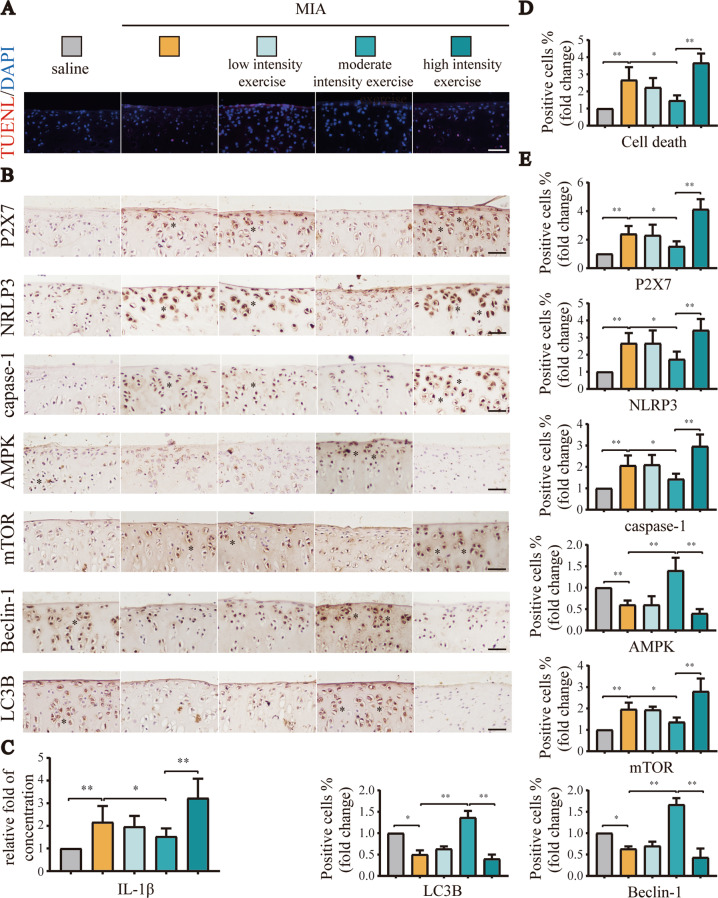
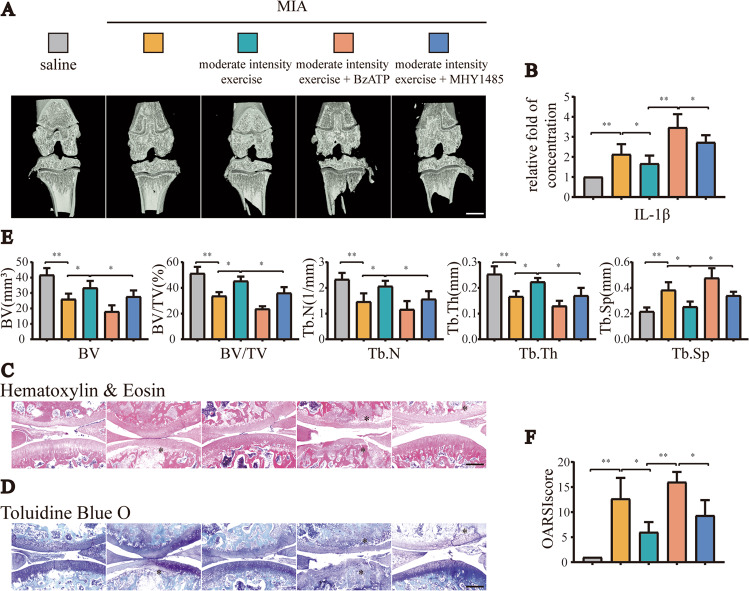
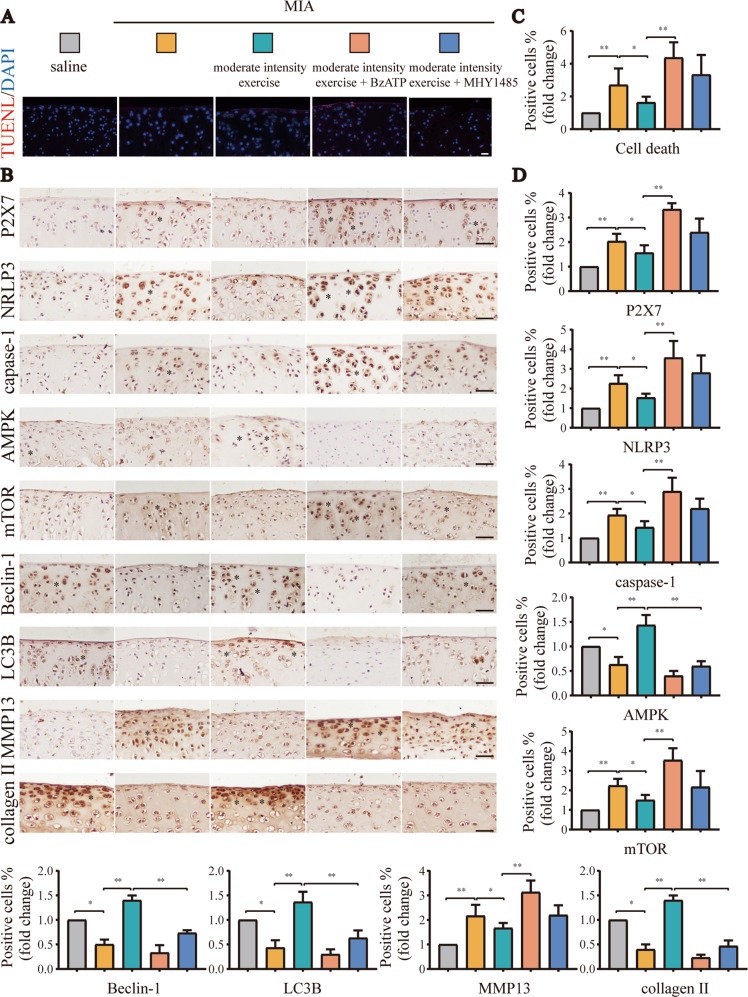
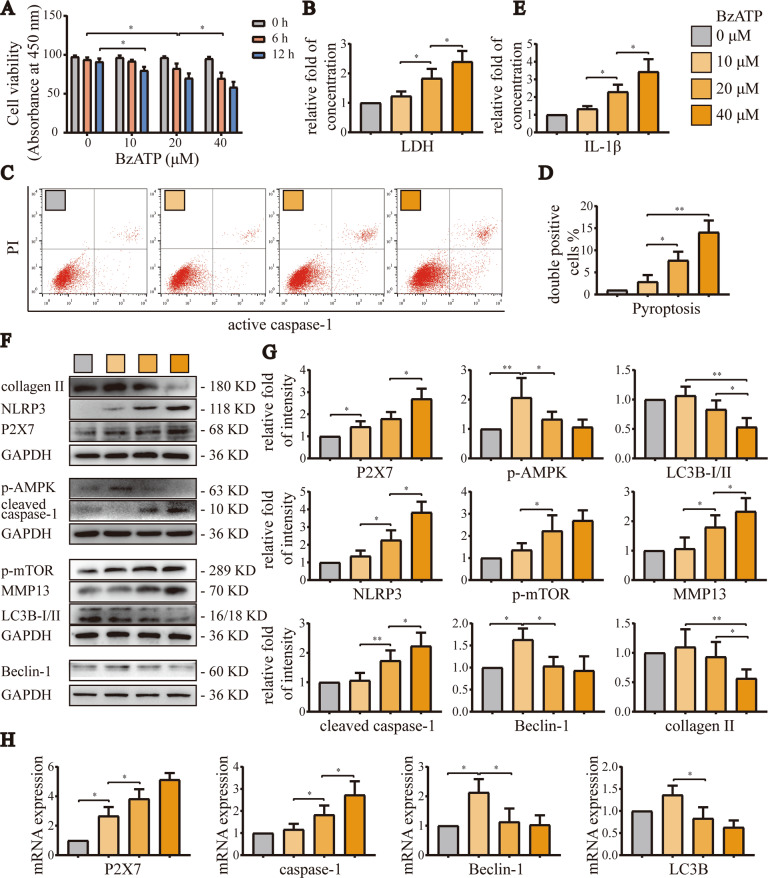
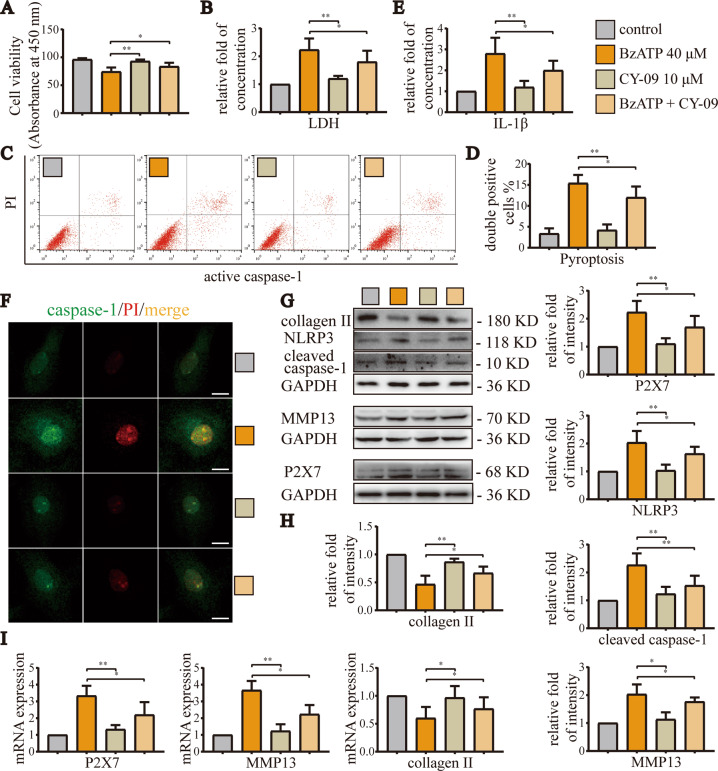
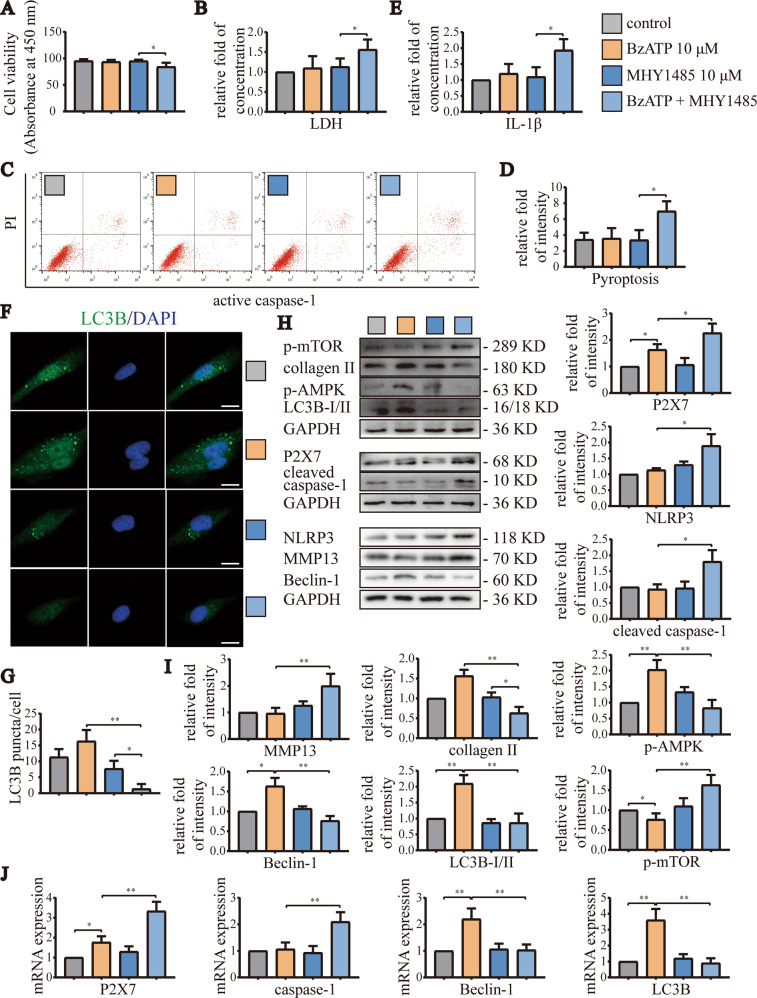
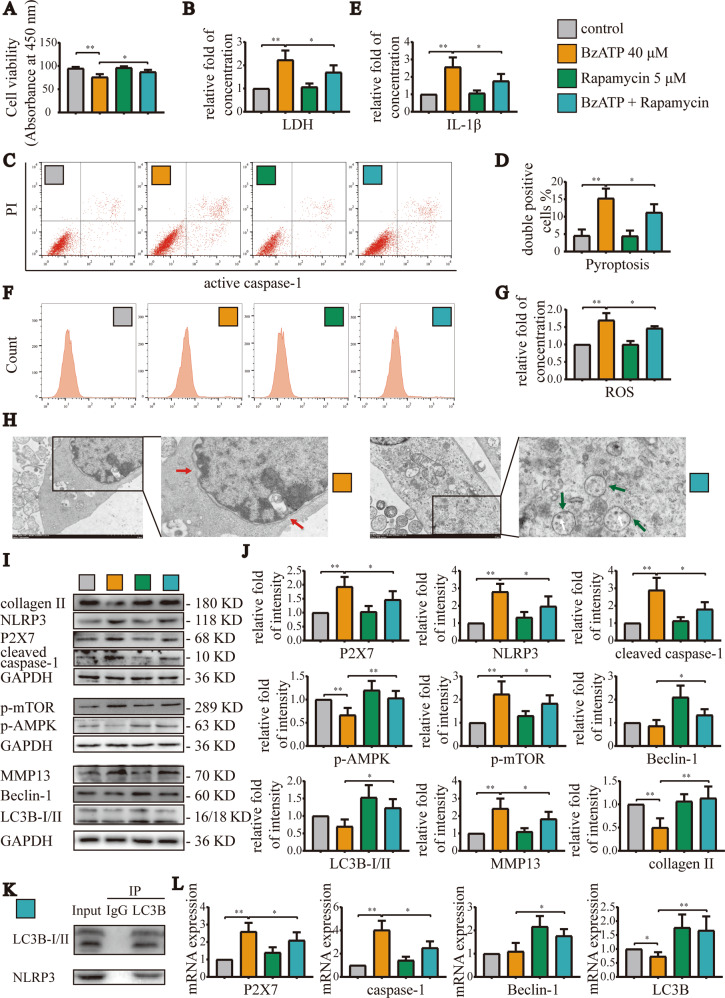
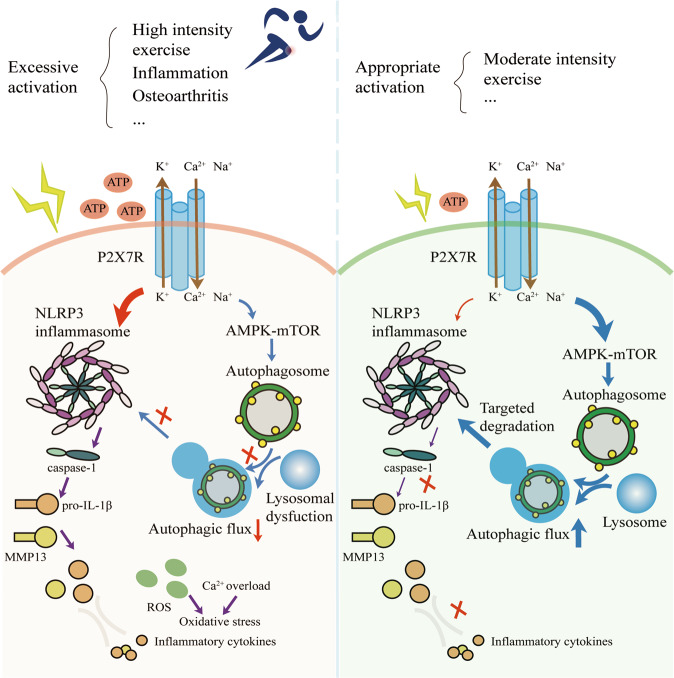
Instability and excessive use of the knee joint can cause osteoarthritis (OA). Reasonable exercise can enhance the stability of the knee joint and prevent and relieve the occurrence and development of OA. As a key switch for inflammation, P2X purinoceptor 7 (P2X7) has attracted much attention in studies of OA. Exercise can regulate P2X7 expression and activation. However, the role of P2X7 in exercise-based prevention and treatment of OA is unknown. We previously showed that moderate-intensity exercise can significantly alleviate OA symptoms. Accordingly, in this study, we evaluated the effects of exercise on P2X7 expression and activation in chondrocytes. Micro-computed tomography, hematoxylin, and eosin staining, Toluidine Blue O staining, immunohistochemistry, and terminal deoxynucleotidyl transferase dUTP nick-end labeling experiments showed that P2X7 expression was lower in the moderate-intensity exercise group than in the inflammation and low- and high-intensity exercise groups. Additionally, chondrocyte death, cartilage destruction, and the degree and severity of pyroptosis were significantly reduced, whereas autophagy levels were significantly increased in the moderate-intensity exercise group. Cell Counting Kit-8 assay, lactate dehydrogenase release, flow cytometry, enzyme-linked immunosorbent assay, cell fluorescence, western blot, reverse transcription-quantitative polymerase chain reaction, and transmission electron microscopy experiments showed that moderate activation of P2X7 promoted autophagy through the AMP-activated protein kinase (AMPK)/mammalian target of rapamycin (mTOR) signaling pathway and promoted autolysosome targeting for degradation of the inflammasome component NLRP3, thereby inhibiting pyroptosis. Additionally, the use of AMPK and mTOR activators and inhibitors indicated that the AMPK-mTOR signaling pathway, as the downstream of P2X7, played a key role in delaying the occurrence and development of OA. We propose that moderate-intensity exercise promoted chondrocyte autophagy through the P2X7/AMPK/mTOR signal axis to alleviate pyroptosis. Our findings provide novel insights into the positive and preventative effects of exercise on OA.


Conflict of interest statement

The authors declare no conflict of interest.

Figures

Fig. 1
Fig. 1. Moderate-intensity exercise downregulated P2X7, promoted autophagy, and inhibited pyroptosis.
We set the following five groups: saline, MIA, MIA + low-intensity exercise, MIA + moderate-intensity exercise, MIA + high-intensity exercise. A total of 50 rats were randomly assigned, with 10 rats in each group. The animal tissues in this part, such as paraffin sections and joint cavity lavage fluid, came from previous experiments of our research group [23]. A TUNEL assays were used to evaluate cell death in tissue sections from each group. Red: dead cells; blue: nuclei stained by DAPI (scale bar: 50 μm). B IHC was used to evaluate P2X7, NLRP3, caspase-1, mTOR, AMPK, LC3B, and Beclin-1 expression in tissue sections from each group. Brown: stained cells; blue: hematoxylin-stained nuclei (scale bar: 500 μm). C ELISA were used to detect IL-1β content in the articular cavity lavage fluid from each group. D Statistical data for cell death in TUNEL assays. E Statistical data for stained cells in IHC analysis. The * in the histochemical images represents the positively stained cells. Data are presented as means ± standard deviations of at least three independent experiments. *p < 0.05, **p < 0.01.
Fig. 2
Fig. 2. Increased expression of P2X7 or inhibition of autophagy offset the anti-inflammatory effects of moderate-intensity exercise.
We set the following five groups: saline, MIA, MIA + moderate-intensity exercise, MIA + moderate-intensity exercise + BzATP, MIA + moderate-intensity exercise + MHY1485. A total of 50 rats were randomly assigned, with 10 rats in each group. A Micro-CT scanning of knee joints in each group was used to obtain imaging data for the tibial plateau and subchondral bone (scale bar: 1 mm). B ELISA was used to determine IL-1β levels in the articular cavity lavage fluid of rats in each group. C H&E staining and D TB staining were used to analyze the degree of cartilage loss and the development of inflammation. E Knee joint bone-related parameters, including BV, BV/TV, Tb.N, Tb.Th, and Tb.Sp, as evaluated by micro-CT. F OARSI scores were used to determine the development stage of OA in the knee joint tissues of rats in each group. The * in the HE and TB staining images represents the cartilage damage site. Data are presented as means ± standard deviations of at least three independent experiments. *p < 0.05, **p < 0.01.
Fig. 3
Fig. 3. Supplement to Fig. 2.
A TUNEL assays were used to detect cell death in tissue sections from each group. Red: dead cells; blue: nuclei stained by DAPI (scale bar: 50 μm). B IHC was used to detect the expression levels of P2X7, NLRP3, caspase-1, mTOR, AMPK, LC3B, and Beclin-1 in tissue sections from each group. Brown: stained cells; blue: hematoxylin-stained nuclei (scale bar: 500 μm). C Statistical data for cell death in TUNEL assays. D Statistical data for stained cells in IHC analyses. The * in the histochemical images represents the positively stained cells. Data are presented as means ± standard deviations of at least three independent experiments. *p < 0.05, **p < 0.01.
Fig. 4
Fig. 4. Activation of P2X7 with increasing concentrations of BzATP first promoted autophagy and then induced pyroptosis.
A CCK-8 assays were used to evaluate cell viability in each group. Absorbance was measured at a wavelength of 450 nm. B LDH release assays were used to detect the degree of cell damage. C Flow cytometry was used to detect the number and ratio of caspase-1/PI-stained cells, reflecting the severity of cell pyroptosis. D Statistical data for stained cells. E ELISA was used to detect IL-1β levels in cell culture supernatants from each group. F, G Western blotting and H RT-qPCR were used to detect protein and mRNA expression levels of P2X7, NLRP3, caspase-1, mTOR, AMPK, LC3B, Beclin-1, MMP13, and collagen II. Data are presented as means ± standard deviations of at least three independent experiments. *p < 0.05, **p < 0.01.
Fig. 5
Fig. 5. Inhibition of NLRP3 alleviated OA caused by overactivation of P2X7.
A CCK-8 assays were used to detect cell viability. Absorbance was measured at a wavelength of 450 nm. B LDH release assays were used to detect the degree of cell damage. C Flow cytometry was used to detect the number and ratio of caspase-1/PI-stained cells, reflecting the severity of cell pyroptosis. D Statistical data for stained cells. E ELISA was used to detect IL-1β levels in cell culture supernatants for each group. F Cell fluorescence experiments were used to determine the fluorescence intensity and location of caspase-1/PI staining in cells, reflecting the severity of cell damage and pyroptosis (scale bar: 10 μm). G, H Western blotting and I RT-qPCR were used to detect the protein and mRNA expression levels of P2X7, NLRP3, caspase-1, MMP13, and collagen II. Data are presented as means ± standard deviations of at least three independent experiments. *p < 0.05, **p < 0.01.
Fig. 6
Fig. 6. Moderate activation of P2X7 reduced pyroptosis through AMPK/mTOR-induced autophagy.
A CCK-8 assays were used to evaluate cell viability in each group. Absorbance was measured at a wavelength of 450 nm. B LDH release assays were used to detect the degree of cell damage. C Flow cytometry was used to detect the number and ratio of caspase-1/PI-stained cells, reflecting the severity of cell pyroptosis. D Statistical data for stained cells. E ELISA was used to detect IL-1β content in cell culture supernatants for each group. F Cell fluorescence experiments were used to detect the fluorescence intensity and puncta number of cell LC3B staining, reflecting the level of autophagy (scale bar: 10 μm). G Statistical data for LC3B puncta/cell. H, I Western blotting and J RT-qPCR were used to detect protein and mRNA expression levels of P2X7, NLRP3, caspase-1, mTOR, AMPK, LC3B, Beclin-1, MMP13, and collagen II. Data are presented as means ± standard deviations of at least three independent experiments. *p < 0.05, **p < 0.01.
Fig. 7
Fig. 7. Increasing the level of autophagy effectively blocked pyroptosis induced by excessive activation of P2X7.
A CCK-8 assays were used to detect cell viability for each group. Absorbance was measured at a wavelength of 450 nm. B LDH release assays were used to detect the degree of cell damage. C, F Flow cytometry was used to detect the number and ratio of caspase-1/PI- and ROS-stained cells, reflecting the severity of cell pyroptosis and ROS production. D, G Statistical data for stained cells. In the statistical analysis of ROS, we used the control group as a reference to normalize the absorbance value and expressed the results as the fold change. E ELISA was used to detect IL-1β content in cell culture supernatants for each group. H TEM analysis of cell morphology, including cell membrane rupture, nuclear membrane atrophy (red arrow), and autolysosome number (white arrow), reflecting the level of cell pyroptosis and autophagy (green arrow, autophagosome) (scale bar: 2 μm). K Co-IP experiments demonstrating the binding of LC3B and NLRP3. I, J Western blotting and L RT-qPCR were used to detect the protein and mRNA expression levels of P2X7, NLRP3, caspase-1, mTOR, AMPK, LC3B, Beclin-1, MMP13, and collagen II. Data are presented as means ± standard deviations of at least three independent experiments. *p < 0.05, **p < 0.01.
Fig. 8
Fig. 8. Mechanisms through which variations in P2X7 activation and expression affect autophagy and pyroptosis.
Based on our findings, we established a model for the mechanisms through which P2X7 affects autophagy and pyroptosis. Briefly, when rats perform high-intensity exercise or chondrocytes receive high-intensity stimulation, P2X7 is overactivated, and the ion flow mediated by P2X7 activates the inflammasome pathway, causing the activation of caspase-1 and the release of active IL-1β. The AMPK/mTOR pathway mediated by P2X7 is insufficient to resist the damage caused by pyroptosis. By contrast, when rats perform moderate-intensity exercise or chondrocytes receive an appropriate intensity of stimulation, P2X7 is moderately activated, and the ion flow mediated by P2X7 mainly activates the AMPK/mTOR pathway, resulting in increased autophagy and enabling the induced autolysosomes to target the degradation of inflammasome components, thereby inhibiting pyroptosis and maintaining chondrocyte activity.

Similar articles

Cited by

References

    1. Carr AJ, Robertsson O, Graves S, Price AJ, Arden NK, Judge A, et al. Knee replacement. Lancet. 2012;379:1331–40. - PubMed
    1. Surprenant A, Rassendren F, Kawashima E, North RA, Buell G. The cytolytic P2Z receptor for extracellular ATP identified as a P2X receptor (P2X7) Science. 1996;272:735–38. - PubMed
    1. Pelegrin P, Surprenant A. Pannexin-1 mediates large pore formation and interleukin-1beta release by the ATP-gated P2X7 receptor. EMBO J. 2006;25:5071–82. - PMC - PubMed
    1. North RA. Molecular physiology of P2X receptors. Physiol Rev. 2002;82:1013–67. - PubMed
    1. Pétrilli V, Papin S, Dostert C, Mayor A, Martinon F, Tschopp J. Activation of the NALP3 inflammasome is triggered by low intracellular potassium concentration. Cell Death Differ. 2007;14:1583–9. - PubMed