. 2021 Nov 10;11(1):22012.
doi: 10.1038/s41598-021-01050-7.

Identifying autism spectrum disorder symptoms using response and gaze behavior during the Go/NoGo game CatChicken

Affiliations

Identifying autism spectrum disorder symptoms using response and gaze behavior during the Go/NoGo game CatChicken

Prasetia Utama Putra et al. Sci Rep. .

Erratum in

Abstract

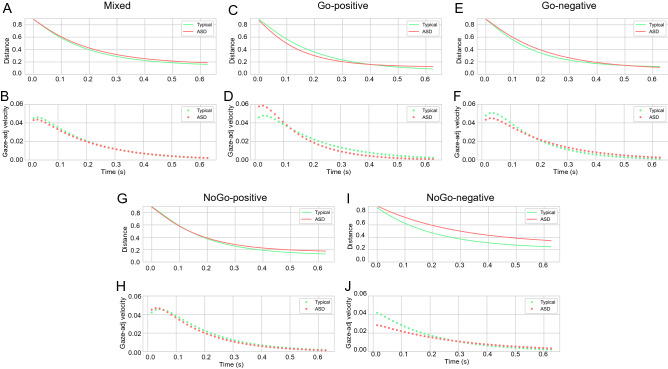
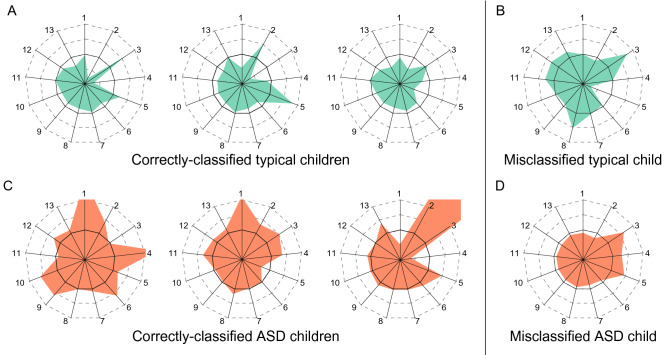
Previous studies have found that Autism Spectrum Disorder (ASD) children scored lower during a Go/No-Go task and faced difficulty focusing their gaze on the speaker's face during a conversation. To date, however, there has not been an adequate study examining children's response and gaze during the Go/No-Go task to distinguish ASD from typical children. We investigated typical and ASD children's gaze modulation when they played a version of the Go/No-Go game. The proposed system represents the Go and the No-Go stimuli as chicken and cat characters, respectively. It tracks children's gaze using an eye tracker mounted on the monitor. Statistically significant between-group differences in spatial and auto-regressive temporal gaze-related features for 21 ASD and 31 typical children suggest that ASD children had more unstable gaze modulation during the test. Using the features that differ significantly as inputs, the AdaBoost meta-learning algorithm attained an accuracy rate of 88.6% in differentiating the ASD subjects from the typical ones.


Conflict of interest statement

The authors declare no competing interests.

Figures

Figure 1
Figure 1
Extrapolating results of Auto-regressive model using the average of parameters. Gaze extrapolation results using mixed (A), Go positive (C) and negative (E), and NoGo positive (G) and negative (I) coefficients. (B,D,F,H,J) show respectively the extrapolated gaze-to-obj distance and velocity results for mixed (typical-avg: 0.0161, ASD-avg: 0.0156), Go positive (typical-avg: 0.0178, ASD-avg: 0.0165) and negative (typical-avg: 0.0169, ASD-avg: 0.0173), and NoGo positive (typical-avg: 0.0170, ASD-avg: 0.0158) and negative (typical-avg: 0.0141, ASD-avg: 0.0124) coefficients. Solid and dotted green lines represent, respectively, typical children’s extrapolated gaze-to-obj distance and the negative of its first derivative (gaze-adjustment velocity) over time. ASD children’s extrapolated gaze-to-obj distance and gaze-adjustment velocity are represented by sold and dotted orange lines, respectively.
Figure 2
Figure 2
Extrapolating results of Auto-regressive model using the average of parameters. Gaze extrapolation results using mixed (A), Go positive (C) and negative (E), and NoGo positive (G) and negative (I) coefficients. (B,D,F,H,J) show respectively the extrapolated gaze-to-obj distance and velocity results for mixed (typical-avg: 0.0161, ASD without ADHD-avg: 0.0150, ASD with ADHD-avg: 0.0160), Go positive (typical-avg: 0.0178, ASD without ADHD-avg: 0.0162, ASD with ADHD-avg: 0.0162) and negative (typical-avg: 0.0169, ASD without ADHD-avg: 0.0175, ASD with ADHD-avg: 0.0170), and NoGo positive (typical-avg: 0.0170, ASD without ADHD-avg: 0.0165, ASD with AD-avg: 0.0152) and negative (typical-avg: 0.0141, ASD without ADHD-avg: 0.0111, ASD with ADHD-avg: 0.0140) coefficients. Solid and dotted green lines represent, respectively, typical children’s extrapolated gaze-to-obj distance and the negative of its first derivative (gaze-adjustment velocity) over time. Extrapolated gaze-to-obj distance and gaze-adjustment velocity of ASD children with and without ADHD symptoms are represented by purple and pink colors, respectively.
Figure 3
Figure 3
Star plots depicting four subjects’ response-type-gaze and significant spatial features.(A,B) Features representing correctly-classified and misclassified typical children. (C,D) Features representing correctly-classified and misclassified ASD children. Black-line indicates zero values. 13 indexes represent reduced gaze-adjustment features (1–5), velocity-sen, acceleration-avg, fixation-var, distance-sen, angle-sen, gaze-obj-en, gaze-obj-sen, and gaze-obj-spe.
Figure 4
Figure 4
Game interface of the CatChicken system. (A) Nine red flowers representing the locations in which a stimulus can appear; (B) Go and (C) NoGo characters.
Figure 5
Figure 5
Information measured by the CatChicken system. While playing the Go/NoGo game, CatChicken records children’s response types and times, and locations of stimulus and gaze over time. The response types are Go-positive (green), NoGo-positive (blue), Go-negative (orange), and NoGo-negative (red). The values of object and gaze locations are normalized to range from 0 to 1.
Figure 6
Figure 6
Experimental protocol of this study. The distance between the child and the monitor was about 60 cm. The notebook was equipped with a web camera and an eye tracker.
Figure 7
Figure 7
Features extraction pipeline used in this study. The inputs consists of gaze and object locations, response, and response time.

References

    1. Chiarotti F, Venerosi A. Epidemiology of autism spectrum disorders: A review of worldwide prevalence estimates since 2014. Brain Sci. 2020;10:274–294. doi: 10.3390/brainsci10050274. - DOI - PMC - PubMed
    1. Maenner MJ, Shaw KA, Baio J, et al. Prevalence of autism spectrum disorder among children aged 8 years-autism and developmental disabilities monitoring network, 11 sites, united states, 2016. MMWR Surveill. Summ. 2020;69:1. doi: 10.15585/mmwr.ss6904a1. - DOI - PMC - PubMed
    1. Danielson ML, et al. Prevalence of parent-reported adhd diagnosis and associated treatment among us children and adolescents, 2016. J. Clin. Child Adolesc. Psychol. 2018;47:199–212. doi: 10.1080/15374416.2017.1417860. - DOI - PMC - PubMed
    1. Mohammadi MR, et al. Eeg classification of adhd and normal children using non-linear features and neural network. Biomed. Eng. Lett. 2016;6:66–73. doi: 10.1007/s13534-016-0218-2. - DOI
    1. Peng X, Lin P, Zhang T, Wang J. Extreme learning machine-based classification of adhd using brain structural mri data. PloS one. 2013;8:e79476. doi: 10.1371/journal.pone.0079476. - DOI - PMC - PubMed

Publication types