. 2021 Dec;600(7887):138-142.
doi: 10.1038/s41586-021-04054-5. Epub 2021 Nov 10.

Self-guarding of MORC3 enables virulence factor-triggered immunity

Affiliations

Self-guarding of MORC3 enables virulence factor-triggered immunity

Moritz M Gaidt et al. Nature. 2021 Dec.

Abstract

Pathogens use virulence factors to inhibit the immune system1. The guard hypothesis2,3 postulates that hosts monitor (or 'guard') critical innate immune pathways such that their disruption by virulence factors provokes a secondary immune response1. Here we describe a 'self-guarded' immune pathway in human monocytes, in which guarding and guarded functions are combined in one protein. We find that this pathway is triggered by ICP0, a key virulence factor of herpes simplex virus type 1, resulting in robust induction of anti-viral type I interferon (IFN). Notably, induction of IFN by ICP0 is independent of canonical immune pathways and the IRF3 and IRF7 transcription factors. A CRISPR screen identified the ICP0 target MORC34 as an essential negative regulator of IFN. Loss of MORC3 recapitulates the IRF3- and IRF7-independent IFN response induced by ICP0. Mechanistically, ICP0 degrades MORC3, which leads to de-repression of a MORC3-regulated DNA element (MRE) adjacent to the IFNB1 locus. The MRE is required in cis for IFNB1 induction by the MORC3 pathway, but is not required for canonical IFN-inducing pathways. As well as repressing the MRE to regulate IFNB1, MORC3 is also a direct restriction factor of HSV-15. Our results thus suggest a model in which the primary anti-viral function of MORC3 is self-guarded by its secondary IFN-repressing function-thus, a virus that degrades MORC3 to avoid its primary anti-viral function will unleash the secondary anti-viral IFN response.


Conflict of interest statement

Competing interests

REV consults for Ventus Therapeutics and Tempest Therapeutics. A provisional patent application covering these findings has been submitted.

Figures
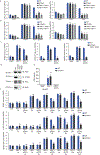
Extended Data Figure 1:
Extended Data Figure 1:. Redundancy between DNA- and ICP0-triggered sensing of HSV-1 in BLaER1 monocytes
(a-c) BLaER1 monocytes were infected with HSV-1 at MOI=1 for 24h or transfected with DNA for 3h. Gene-expression analysis is depicted as mean + SEM of three independent experiments. (d) Immunoblot of BLaER1 monocytes of indicated genotypes. (e) BLaER1 monocytes were infected with HSV-1 at MOI=1 for 24h and IFNβ secretion was measured by ELISA. Data is depicted as mean + SEM of four independent experiments. (f) BLaER1 monocytes were infected with HSV-1 at MOI=5. Gene-expression is depicted as mean + SEM of three independent experiments. * p < 0.05; ** p < 0.01; *** p < 0.001; ns = not significantly different than WT, tested by two-way ANOVA and Dunnett’s or Bonferroni’s post hoc test. See Source Data for exact p values.
Extended Data Figure 2:
Extended Data Figure 2:. Redundancy between DNA- and ICP0-triggered sensing of HSV-1 in THP1 and U937 cells
PMA-differentiated THP1 (a, c) or U937 (b) human myeloid-like cells were infected with HSV-1 at MOI=1 or indicated MOI for 24h (a, b) or indicated timepoints (c) or transfected with 2ʹ-3ʹ-cGAMP for 4h. Gene-expression analysis is depicted as mean + SEM of three independent experiments. ND = not detected. * p < 0.05; ** p < 0.01; *** p < 0.001; ns = not significantly different than WT, tested by two-way ANOVA or Mixed-effects model and Bonferroni’s post hoc test. See Source Data for exact p values.
Extended Data Figure 3:
Extended Data Figure 3:. HSV-1 ΔICP0 is attenuated in BLaER1 monocytes
(a) BLaER1 monocytes were infected with HSV-1 at indicated MOI and protein expression was analyzed by immunoblot at indicated timepoints. Data is depicted as one representative of two experiments. (b) BLaER1 monocytes were infected with HSV-1 at MOI=1 and viral progeny was quantified in the supernatant. Mean of five independent experiments is shown. (c) BLaER1 monocytes were infected with HSV-1 at indicated MOI and analyzed by flow cytometry. Mean + SEM of three independent experiments is depicted. Data is duplicated in Fig. 3b. * p < 0.05; *** p < 0.001; ns = not significantly different than HSV-1 WT, tested by two-way ANOVA and Bonferroni’s post hoc test. See Source Data for exact p values.
Extended Data Figure 4:
Extended Data Figure 4:. Virulence factors induce IFN in monocytes independently of PRR-signaling hubs
BLaER1 monocytes (a), PMA-differentiated THP1 (b) or U937 (c) cells expressing doxycycline-inducible virulence factors were stimulated with doxycycline for 24h, left untreated or stimulated with DNA for 3h. Gene-expression as quantified by q-RT-PCR is depicted as mean + SEM of three independent experiments. IFNB1 expression levels in a) are partially duplicated from Fig. 1c. * p < 0.05; ** p < 0.01; *** p < 0.001; ns = not significantly different than the corresponding mCherry-expressing condition, tested by two-way ANOVA or Mixed-effects model and Dunnett’s post hoc test. ND = not detected. See Source Data for exact p values.
Extended Data Figure 5:
Extended Data Figure 5:. Virulence factor activity is required for IFN induction
(a, b) BLaER1 monocytes expressing doxycycline-inducible virulence factors were stimulated with doxycycline for 24h. Gene-expression as quantified by q-RT-PCR is depicted as mean ± SEM of three independent experiments and protein expression by immunoblot is depicted from one representative experiment of two. *** p < 0.001; ns = not significantly different than the corresponding mCherry-expressing condition, tested by two-way ANOVA or Mixed-effects model and Dunnett’s post hoc test. See Source Data for exact p values. (c-f) BLaER1 monocytes expressing doxycycline-inducible virulence factors were stimulated with doxycycline for 24h. Transcriptomic changes in BLaER1 monocytes as detected by RNA-seq were analyzed by PCA of variance stabilizing transformed counts. Top 10 genes that contribute to individual PC directions are depicted (c). Heatmap of log normalized counts of the top 40 most variable genes (column normalized) from three independent RNA-seq experiments is shown (e). Modules from the Molecular Signatures Database that were found to be enriched in differentially expressed genes upon virulence factor expression in BLaER1 monocytes (f). Genes contributing to individual modules can be found in Supplementary Table 1.
Extended Data Figure 6:
Extended Data Figure 6:. Validation of MORC3 as a repressor of IFN
(a) Schematic of a genome wide CRISPR screen to identify negative regulators of IFN. (b) PinAPL.py analysis of the CRISPR screen to identify negative regulators of IFN. Significantly enriched genes are labeled. Raw data can be found in Supplementary Table 2. (c) U2OS cells were infected with HSV-1 for 24h. One representative immunoblot of two is shown. (d, e) Gene expression of BLaER1 monocytes is shown as mean + SEM of 3 independent experiment from one representative clone or two (multiple KOs) or one clone (WT and MORC3−/−) except CXCL10 quantification in (d) which is shown as mean of 2 independent experiments. *** p < 0.001; significantly different than the corresponding WT condition, tested by two-way ANOVA and Dunnett’s post hoc test. See Source Data for exact p values. (f-i) Immunoblot of BLaER1 monocytes of indicated genotypes.
Extended Data Figure 7:
Extended Data Figure 7:. Characterization of MORC3 deficiency in THP1, U937 and BLaER1 cells
(a-d) Gene-expression in PMA-differentiated THP1-Cas9 or PMA-differentiated U937-Cas9 human myeloid-like cells expressing indicated sgRNAs is depicted as mean + SEM of three independent experiments. Protein expression in the same cells was analyzed by immunoblot. ND = not detected. *** p < 0.001; ns = not significantly different than the corresponding scramble sgRNA-expressing condition, tested by two-way ANOVA and Bonferroni’s post hoc test. See Source Data for exact p values. (e) Transcriptional changes in BLaER1 monocytes as detected by RNA-seq in three independent experiments are depicted by PCA. These data are partially duplicated from Extended Data Fig. 5d. (f) Modules from the Molecular Signatures Database that were found to be enriched in differentially expressed genes in MORC3−/− BLaER1 monocytes. Background gene set includes all genes that have base mean expression of at least 1 in MORC3−/− BLaER1 monocytes. Genes contributing to individual modules can be found in Supplementary Table 1.
Extended Data Figure 8:
Extended Data Figure 8:. PML is not required for IFNB1 regulation by MORC3
(a) Gene expression of BLaER1 monocytes of indicated genotype is depicted as mean + SEM of three independent experiments. (b) Protein expression of BLaER1 monocytes was analyzed by immunoblot. (c) BLaER1 monocytes expressing doxycycline-inducible virulence factors were stimulated with doxycycline for 24h. Gene-expression as quantified by q-RT-PCR is depicted as mean + SEM of three independent experiments. (d, e) Gene-expression in HCT116-Cas9 cells expressing indicated sgRNAs is depicted as mean + SEM of three independent experiments. Protein expression in the same cells was analyzed by immunoblot. ND = not detected. ns = not significantly different than the corresponding scramble sgRNA-expressing condition, tested by Mixed-effects model and Bonferroni’s post hoc test. See Source Data for exact p values. (f) BLaER1 monocytes of indicated genotype were infected with ΔICP0 HSV-1 at indicated MOI for 6h and analyzed by flow cytometry. Mean + SEM of three independent experiment is depicted. * p < 0.05 ; ns = not significantly different than the IFNAR1−/−IFNAR2−/− condition, tested by two-way ANOVA and Bonferroni’s post hoc test. See Source Data for exact p values.
Extended Data Figure 9:
Extended Data Figure 9:. Quantification of expression of ERV families
ERV family expression was quantified with RepEnrich2 in IFNAR1−/−IFNAR2−/− mCherry vs MORC3−/−IFNAR1−/−IFNAR2−/− monocytes. ERVs with an FDR <0.05 are highlighted in red. The recommended RepEnrich2-EdgeR pipeline did not detect any regulation of ERVs upon MORC3 deficiency. RepEnrich2-DeSeq2 analysis suggested minimal up- and down-regulation of ERV families. The only strongly de-repressed ERV family upon MORC3 deficiency includes members within the MORC3-repressed region on chromosome 9, consistent with a positional rather than an ERV-specific de-repression.
Extended Data Figure 10:
Extended Data Figure 10:. MORC3 deficiency leads to de-repression of a gene cluster at chromosome 9
(a) Column-normalized heatmap analysis of transcriptomic changes in BLaER1 monocytes as detected by RNA-seq in three independent experiments. (b) Transcriptional changes in BLaER1 monocytes as detected by RNA-seq in three independent experiments are depicted by PCA. These data are partially duplicated from Extended Data Fig. 7e. (c) Log transcripts per million (TPM) of genes in BLaER1 monocytes of genes clustered near IFNB1 on chromosome 9 as detected by RNA-seq from three independent experiments. All protein coding genes within this region are depicted. (d) BLaER1 monocytes were stimulated with indicated PAMPs for 3h or 24h. Gene-expression analysis is depicted as mean + SEM of five independent experiments. (e) Log transcripts per million (TPM) of IFN genes in BLaER1 monocytes were detected by RNAseq in three independent experiments. (f, g) BLaER1 monocytes were stimulated with DNA for 12h or left untreated. Cytokine secretion or gene expression from one representative clone of two per genotype except WT is shown as mean + SEM of four (f) or three (g) independent experiments. * p < 0.05 ; *** p < 0.001; ns = not significantly different than WT (unless otherwise indicated), tested by two-way ANOVA and Bonferroni’s post hoc test. See Source Data for exact p values. (h) Gene expression from BLaER1 monocytes of indicated genotypes is depicted as mean + SEM of three independent experiments. *** p < 0.001; ns = not significantly different than WT, tested by two-way ANOVA and Dunnett’s post hoc test. See Source Data for exact p values. (i, j) Transcriptomic changes in BLaER1 monocytes as detected by RNA-seq in three independent experiments are depicted by PCA. The data in (i) is partially duplicated from (b). The distance on PC1-axis between samples and the mean of mCherry-expressing cells was calculated and is depicted as mean + SEM from three independent experiments. *** p < 0.001 significantly different than WT, tested by two-way ANOVA and Dunnett’s post hoc test. See Source Data for exact p values.
Extended Data Figure 11:
Extended Data Figure 11:. Positional de-repression of IFNB1 explains IFN induction by virulence factors
(a) BLaER1 monocytes were infected with HSV-1 at MOI=1 for 24h. MLLT3 expression is depicted as mean + SEM of n=3 independent experiments. *** p < 0.001; ns = not significantly different than mock infection, tested by two-way ANOVA and Dunnett’s post hoc test. See Source Data for exact p values. (b) Mean log transcripts per million (TPM) of a gene cluster at chromosome 9 in BLaER1 monocytes. Mean TPM is calculated for each condition across three independent experiments. All protein coding genes within this region are depicted. (c) Log transcripts per million (TPM) of IFN genes in BLaER1 monocytes upon virulence factor expression were detected by RNAseq in three independent experiments. (d) BLaER1 monocytes expressing doxycycline-inducible virulence factors were stimulated with doxycycline for 24h. Gene expression is shown as mean + SEM of n=3 independent experiments. ** p < 0.01; *** p < 0.001; ns = not significantly different than WT, tested by two-way ANOVA and Dunnett’s post hoc test. See Source Data for exact p values. Note that IFNB1−/− cells harbor small indels within IFNB1 that allow detection of mRNA by q-RT-PCR. (e,f) BLaER1 monocytes expressing doxycycline-inducible virulence factors were stimulated with doxycycline for 24h. Transcriptomic changes as detected by RNA-seq in three independent experiments were analyzed PCA. Data is partially duplicated from Extended Data Fig. 10i. The distance on PC1-axis between samples and the mean of mCherry-expressing cells was calculated and is depicted as mean + SEM from three independent experiments. *** p < 0.001 significantly different than WT, tested by two-way ANOVA and Dunnett’s post hoc test. See Source Data for exact p values.
Extended Data Figure 12:
Extended Data Figure 12:. Validation of the MORC3-regulated DNA element
(a, b) STAT1−/−STAT2−/−BLaER1-Cas9 expressing a randomly integrated IFNB1-promoter-Luciferase reporter were transduced with the indicated sgRNAs and stimulated with cytosolic DNA for 24h. Luciferase signal and IFNβ secretion is depicted as mean + SEM of n=3 independent experiments. * p < 0.05; ns = not significantly different, tested by paired, two-sided t-test. See Source Data for exact p values. (c) Protein expression of indicated BLaER1 monocytes was analyzed by immunoblot. This experiment was performed once. (d) Consensus sequences of amplicon sequencing at the MRE locus from STAT1−/−STAT2−/− MREΔ/Δ BLaER1 Cas9 cells were aligned to the WT reference. 3166bp were omitted from the reference sequence. (e) Protein expression of indicated BLaER1 monocytes was analyzed by immunoblot. One representative experiment of two is depicted. (f) Gene expression of indicated BLaER1 monocytes is depicted as mean + SEM of three independent experiments from one representative clone of two (MORC3−/− MLLT3−/− IFNAR1−/− IFNAR2−/− and MORC3−/− FOCAD−/− IFNAR1−/− IFNAR2−/−) or one (IFNAR1−/−IFNAR2−/− and MORC3−/−IFNAR1−/−IFNAR2−/−) per genotype. ns = not significantly different than the IFNAR1−/−IFNAR2−/− condition, tested by two-way ANOVA and Dunnett’s post hoc test. See Source Data for exact p values. (g) Protein expression of indicated BLaER1 monocytes was analyzed by immunoblot. This experiment was performed once. (h) Log transcripts per million (TPM) of high-confidence MORC3 targets (genes de-repressed in MORC3−/− IFNAR1−/−IFNAR2−/−, MORC3−/− IFNB1−/− and MORC3−/− STAT1−/−STAT2−/− Cas9) in WT = MORC3−/− STAT1−/−STAT2−/− Cas9 or indicated genotypes are depicted as mean of two independent RNA-seq experiments. (i) STAT1−/−STAT2−/− Cas9 (“WT”) or STAT1−/−STAT2−/− MREΔ/Δ BLaER1 Cas9 were infected with HSV-1 at indicated MOI for 4–5h. One representative immunoblot of two is depicted. (j) Peripheral blood human monocytes were nucleofected with indicated sgRNA:Cas9 complexes and differentiated with M-CSF for 5 days. Gene expression from three independent donors is depicted as mean + SEM. * p < 0.05; ** p < 0.01; *** p < 0.001; significantly different than the scramble sgRNA condition, tested by two-way ANOVA and Bonferroni’s post hoc test. ND = not detected. Source Data for exact p values.
Figure 1:
Figure 1:. Virulence factor-triggered immune sensing
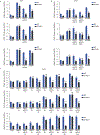
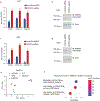
(a, b) BLaER1 monocytes were infected with HSV-1 at MOI=1 for 24h or transfected with DNA for 3h. (c) BLaER1 monocytes expressing doxycycline-inducible virulence factors were stimulated with doxycycline for 24h. Gene-expression is depicted as mean + SEM of three independent experiments.* p < 0.05; *** p < 0.001; ns = not significantly different than WT/mCherry, tested by two-way ANOVA and Dunnett’s post hoc test. ND = not detected. See Source Data for exact p values.
Figure 2:
Figure 2:. MORC3 is a novel negative regulator of IFN
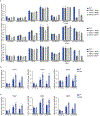
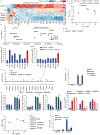
(a) Hypothesized mechanism in which ICP0 degrades a negative regulator of IFN. (b) FACS-analysis of Cas9-BLaER1 cells expressing sgRNAs. Mean + SEM of n=4 independent experiments. (c) IFNAR1−/−IFNAR2−/−STING−/−SP100−/− BLaER1 monocytes (lacking factors that restrict ΔICP0 HSV-1) were infected with HSV-1 for 3h. One representative immunoblot of two is shown. (d) STING−/− BLaER1 monocytes were infected with HSV-1 at MOI=5. One representative immunoblot of two is shown. (e, f) Gene expression of BLaER1 monocytes is shown as mean + SEM of n=3 independent experiments from one representative clone of two (multiple KOs) or one clone (WT and MORC3−/−). (g) Heatmap analysis (column normalized) of gene expression in BLaER1 monocytes as detected by RNA-seq in three independent experiments. *** p < 0.001; ** p < 0.01; ns = not significantly different than scramble sgRNA or WT, tested by one-way or two-way ANOVA and Dunnett’s post hoc test. See Source Data for exact p values.
Figure 3:
Figure 3:. Locus-specific repression of IFNB1 by MORC3 allows self-guarding
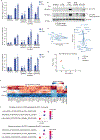
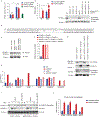
(a) The titer of HSV-1 stocks at 2.5×10⁵ U2OS-FFU/ml was determined on HCT116-Cas9 cells expressing sgRNAs. Mean + SEM of n=6 independent experiments. (b) BLaER1 monocytes were infected with HSV-1 for 6h and analyzed by flow cytometry. Mean + SEM of n=3 independent experiments. (c) Two proposed functions of MORC3 that allow self-guarding. (d) Upregulated genes in RNA-seq of MORC3−/− IFNAR1−/−IFNAR2−/− vs IFNAR1−/−IFNAR2−/− BLaER1 monocytes are shown according to their genomic location. (e, f) CXCL10 secretion of BLaER1 monocytes stimulated with DNA for 12h or left untreated. Mean + SEM of four (e) or three (f) independent experiments. (g) BLaER1 monocytes were infected with HSV-1 for 6h and analyzed by flow cytometry. Mean + SEM of n=3 independent experiments are depicted. This data is from the same experiments as shown in (b). * p < 0.05; ** p < 0.01; *** p < 0.001; ns = not significantly different than WT (unless otherwise indicated), tested by paired, two-sided t-test (a) or by two-way ANOVA and Bonferroni’s or Dunnett’s post hoc test (b, e-g). See Source Data for exact p values.
Figure 4:
Figure 4:. A MORC3-regulated DNA element explains positional IFNB1 activation
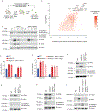
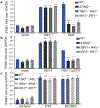
(a) Non-promoter-associated ATAC-seq peaks of increased accessibility in MORC3−/− IFNAR1−/−IFNAR2−/− vs IFNAR1−/−IFNAR2−/− BLaER1 monocytes. Peaks overlapping with the MRE are highlighted in red. (b) A MORC3-regulated DNA element located in an intron of FOCAD. Sum of normalized ATAC-seq reads from three independent experiments is depicted. Alignment of sequencing reads indicating a MREΔ allele are indicated. (c) BLaER1 monocytes were stimulated with PAMPs for 3h or left untreated. Gene expression is shown as mean + SEM of three independent experiments. (d, e) Allele-specific IFNB1 expression was determined in BLaER1 monocytes expressing sgRNAs and/or stimulated with DNA for 3h. Data is depicted as mean + SEM of three independent clones (harboring different IFNB1 indels) as the average from three experiments. (f) Heatmap analysis (column normalized) of gene expression in BLaER1 monocytes as detected by RNA-seq in two independent experiments. The six high-confidence MORC3-regulated genes (de-repressed in MORC3−/− IFNAR1−/−IFNAR2−/−, MORC3−/− IFNB1−/− and MORC3−/− STAT1−/−STAT2−/− Cas9) cells are depicted. (g, h) BLaER1 monocytes expressing doxycycline-inducible virulence factors were stimulated with doxycycline for 24h. Gene expression is shown as mean + SEM of four independent experiments. (i) BLaER1 were infected with HSV-1 at indicated MOI for 4–5h. Gene expression is shown as mean + SEM of five independent experiments. (j) Overview of the self-guarded MORC3 pathway that detects virulence factors from DNA viruses via genomic location-dependent de-repression of IFNB1. ** p < 0.01; *** p < 0.001; ns = not significantly different than WT tested by two-way ANOVA and Bonferroni’s post hoc test. See Source Data for exact p values.

References

    1. Lopes Fischer N, Naseer N, Shin S & Brodsky IE Effector-triggered immunity and pathogen sensing in metazoans. Nat Microbiol 5, 14–26, doi: 10.1038/s41564-019-0623-2 (2020). - DOI - PMC - PubMed
    1. Jones JD & Dangl JL The plant immune system. Nature 444, 323–329, doi: 10.1038/nature05286 (2006). - DOI - PubMed
    1. Van der Biezen EA & Jones JD Plant disease-resistance proteins and the gene-for-gene concept. Trends Biochem Sci 23, 454–456, doi: 10.1016/s0968-0004(98)01311-5 (1998). - DOI - PubMed
    1. Sloan E et al. Analysis of the SUMO2 Proteome during HSV-1 Infection. PLoS Pathog 11, e1005059, doi: 10.1371/journal.ppat.1005059 (2015). - DOI - PMC - PubMed
    1. Sloan E, Orr A & Everett RD MORC3, a Component of PML Nuclear Bodies, Has a Role in Restricting Herpes Simplex Virus 1 and Human Cytomegalovirus. J Virol 90, 8621–8633, doi: 10.1128/JVI.00621-16 (2016). - DOI - PMC - PubMed

Publication types

MeSH terms