. 2021 Dec;600(7888):339-343.
doi: 10.1038/s41586-021-04084-z. Epub 2021 Nov 10.

Structures of the HER2-HER3-NRG1β complex reveal a dynamic dimer interface

Affiliations

Structures of the HER2-HER3-NRG1β complex reveal a dynamic dimer interface

Devan Diwanji et al. Nature. 2021 Dec.

Erratum in

Abstract

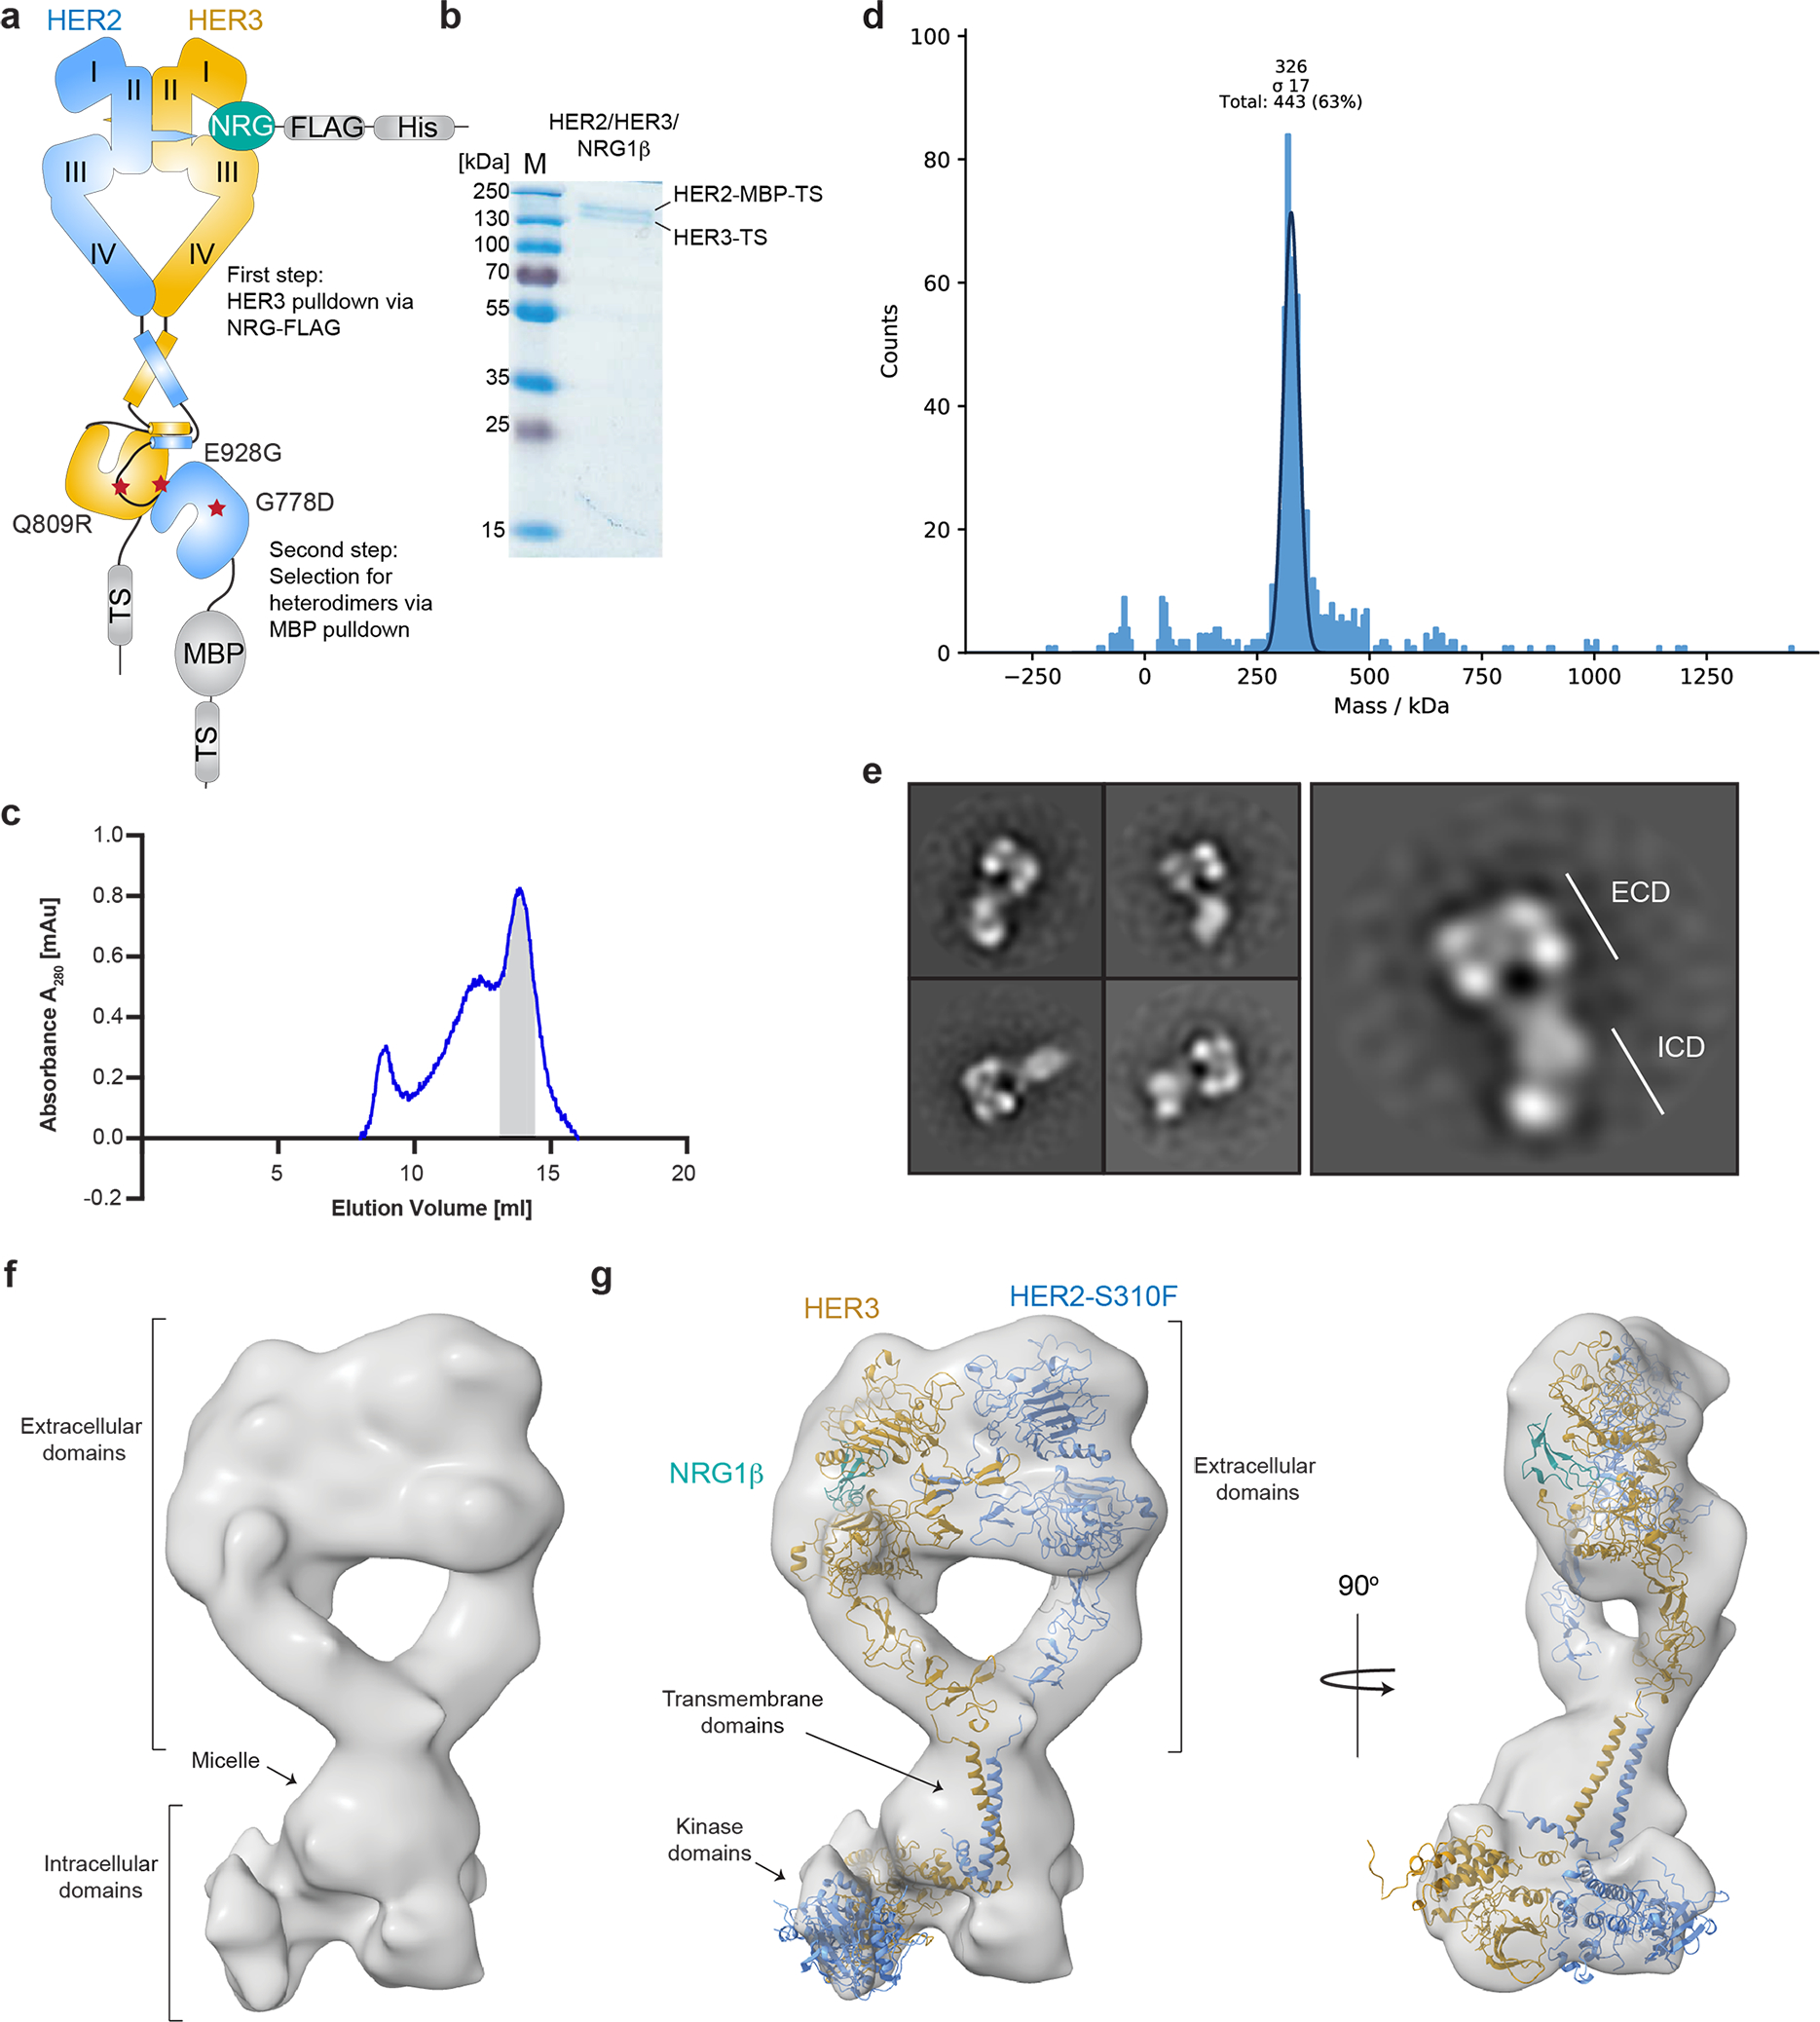
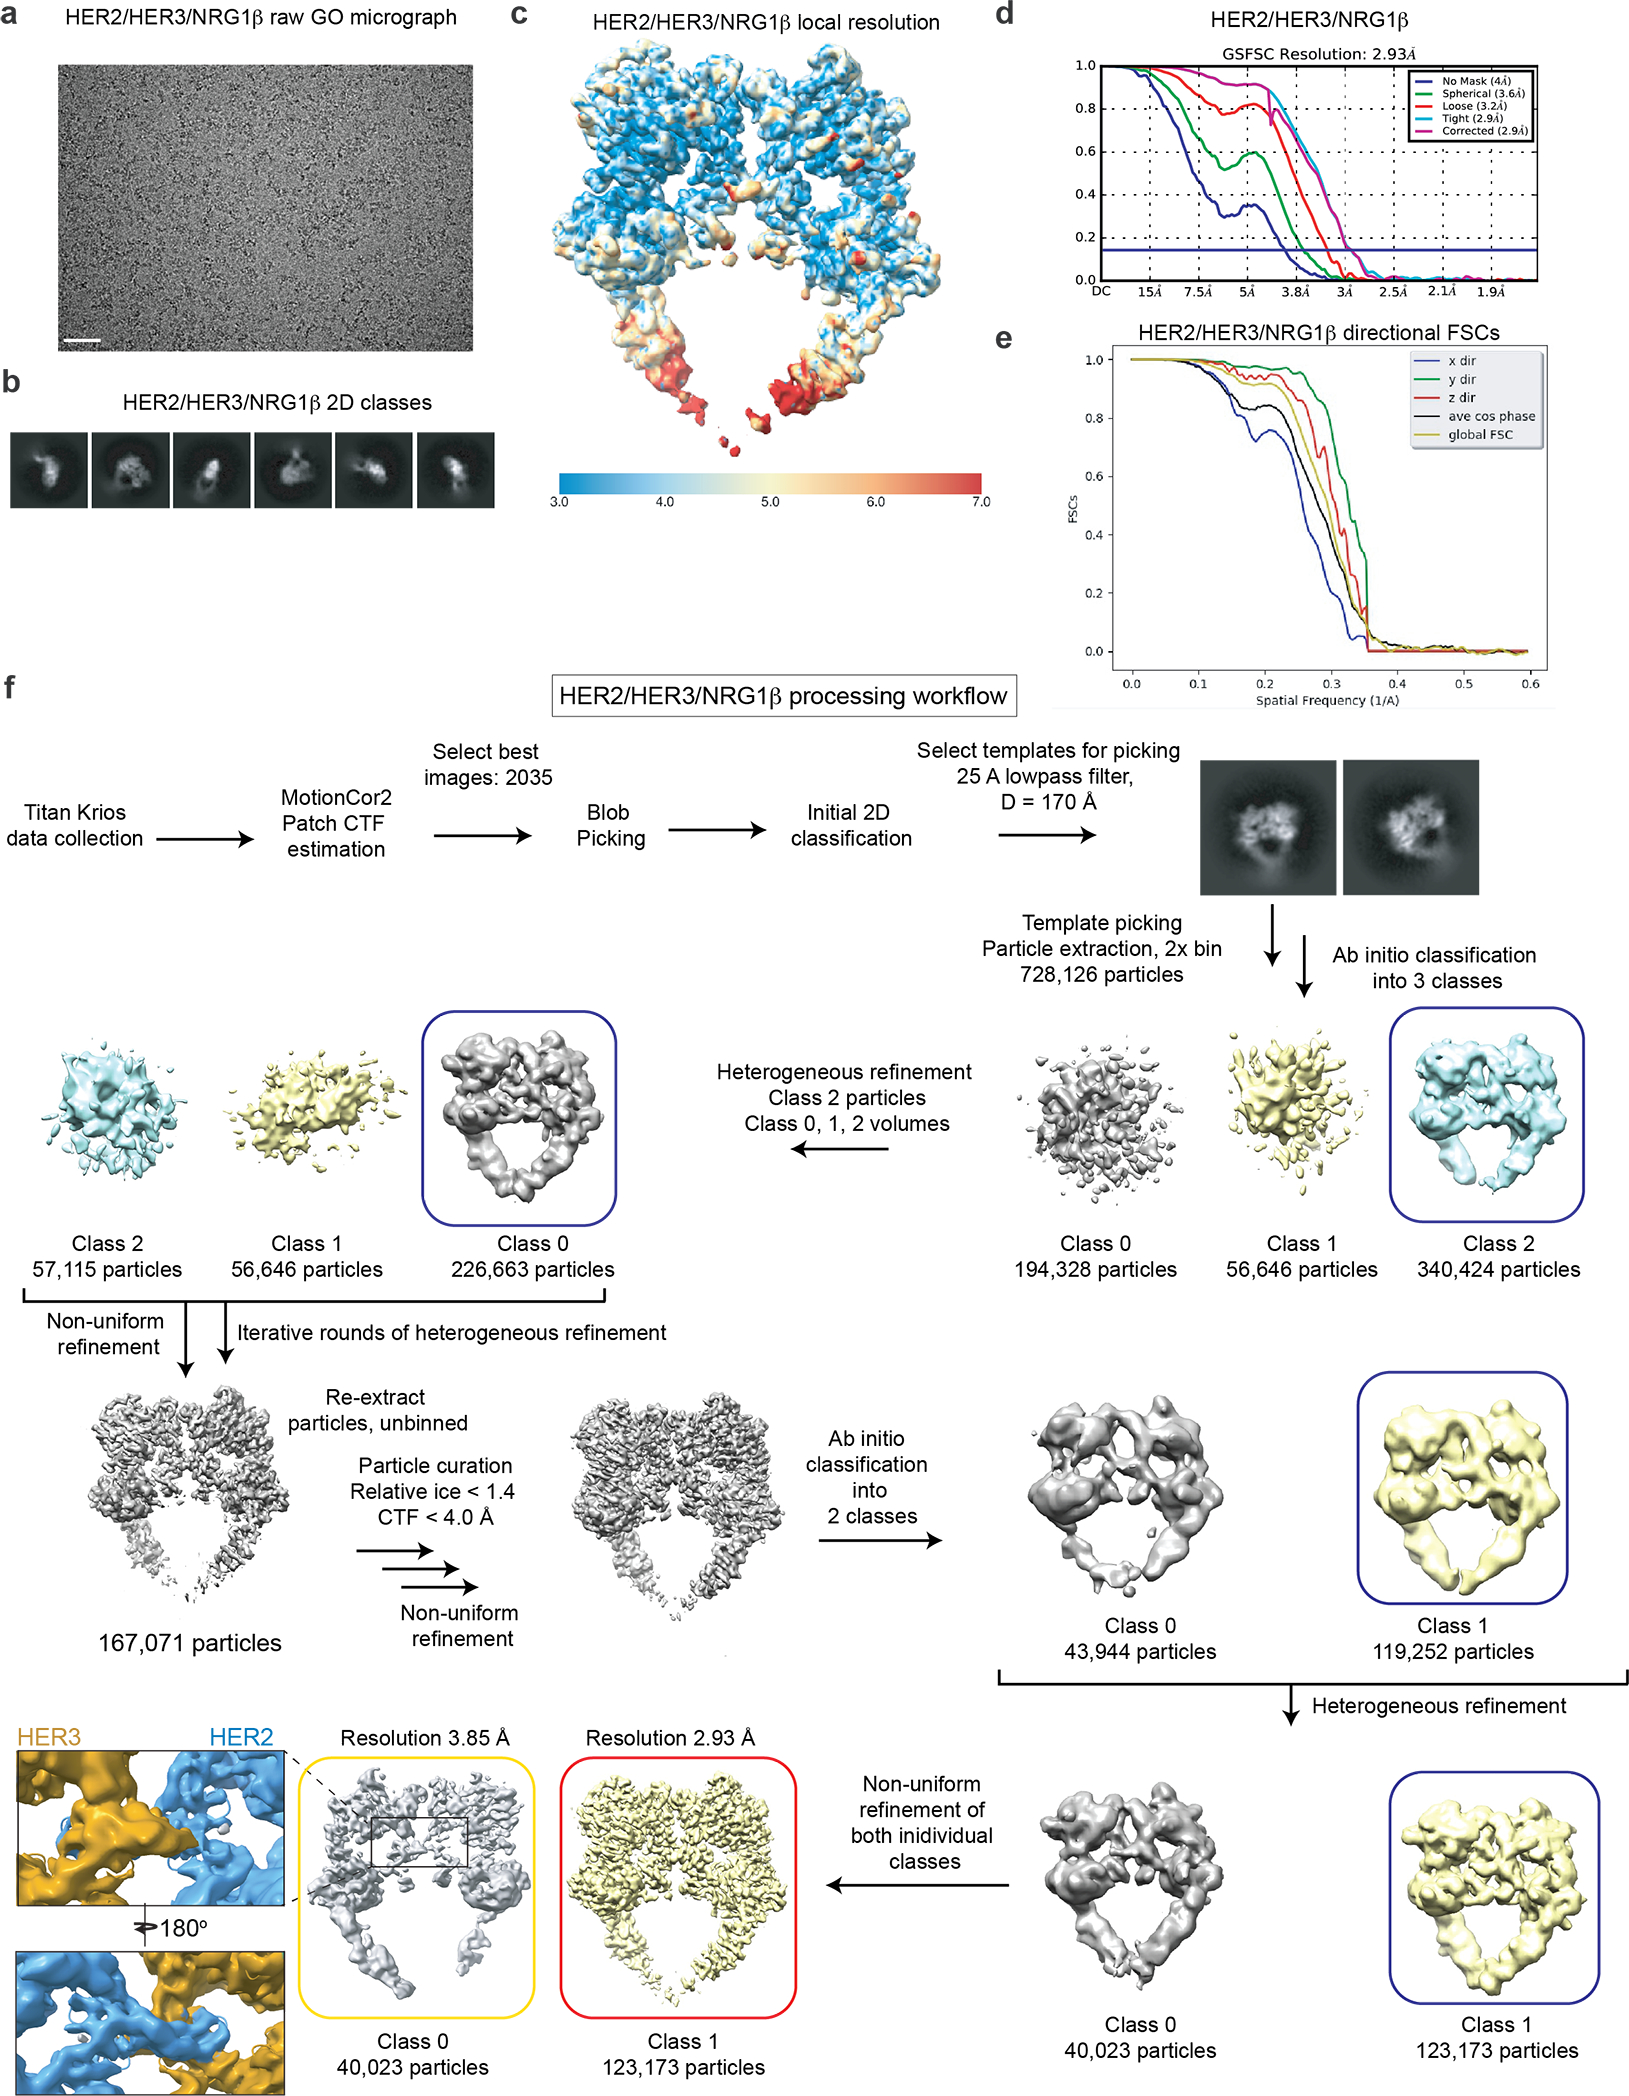
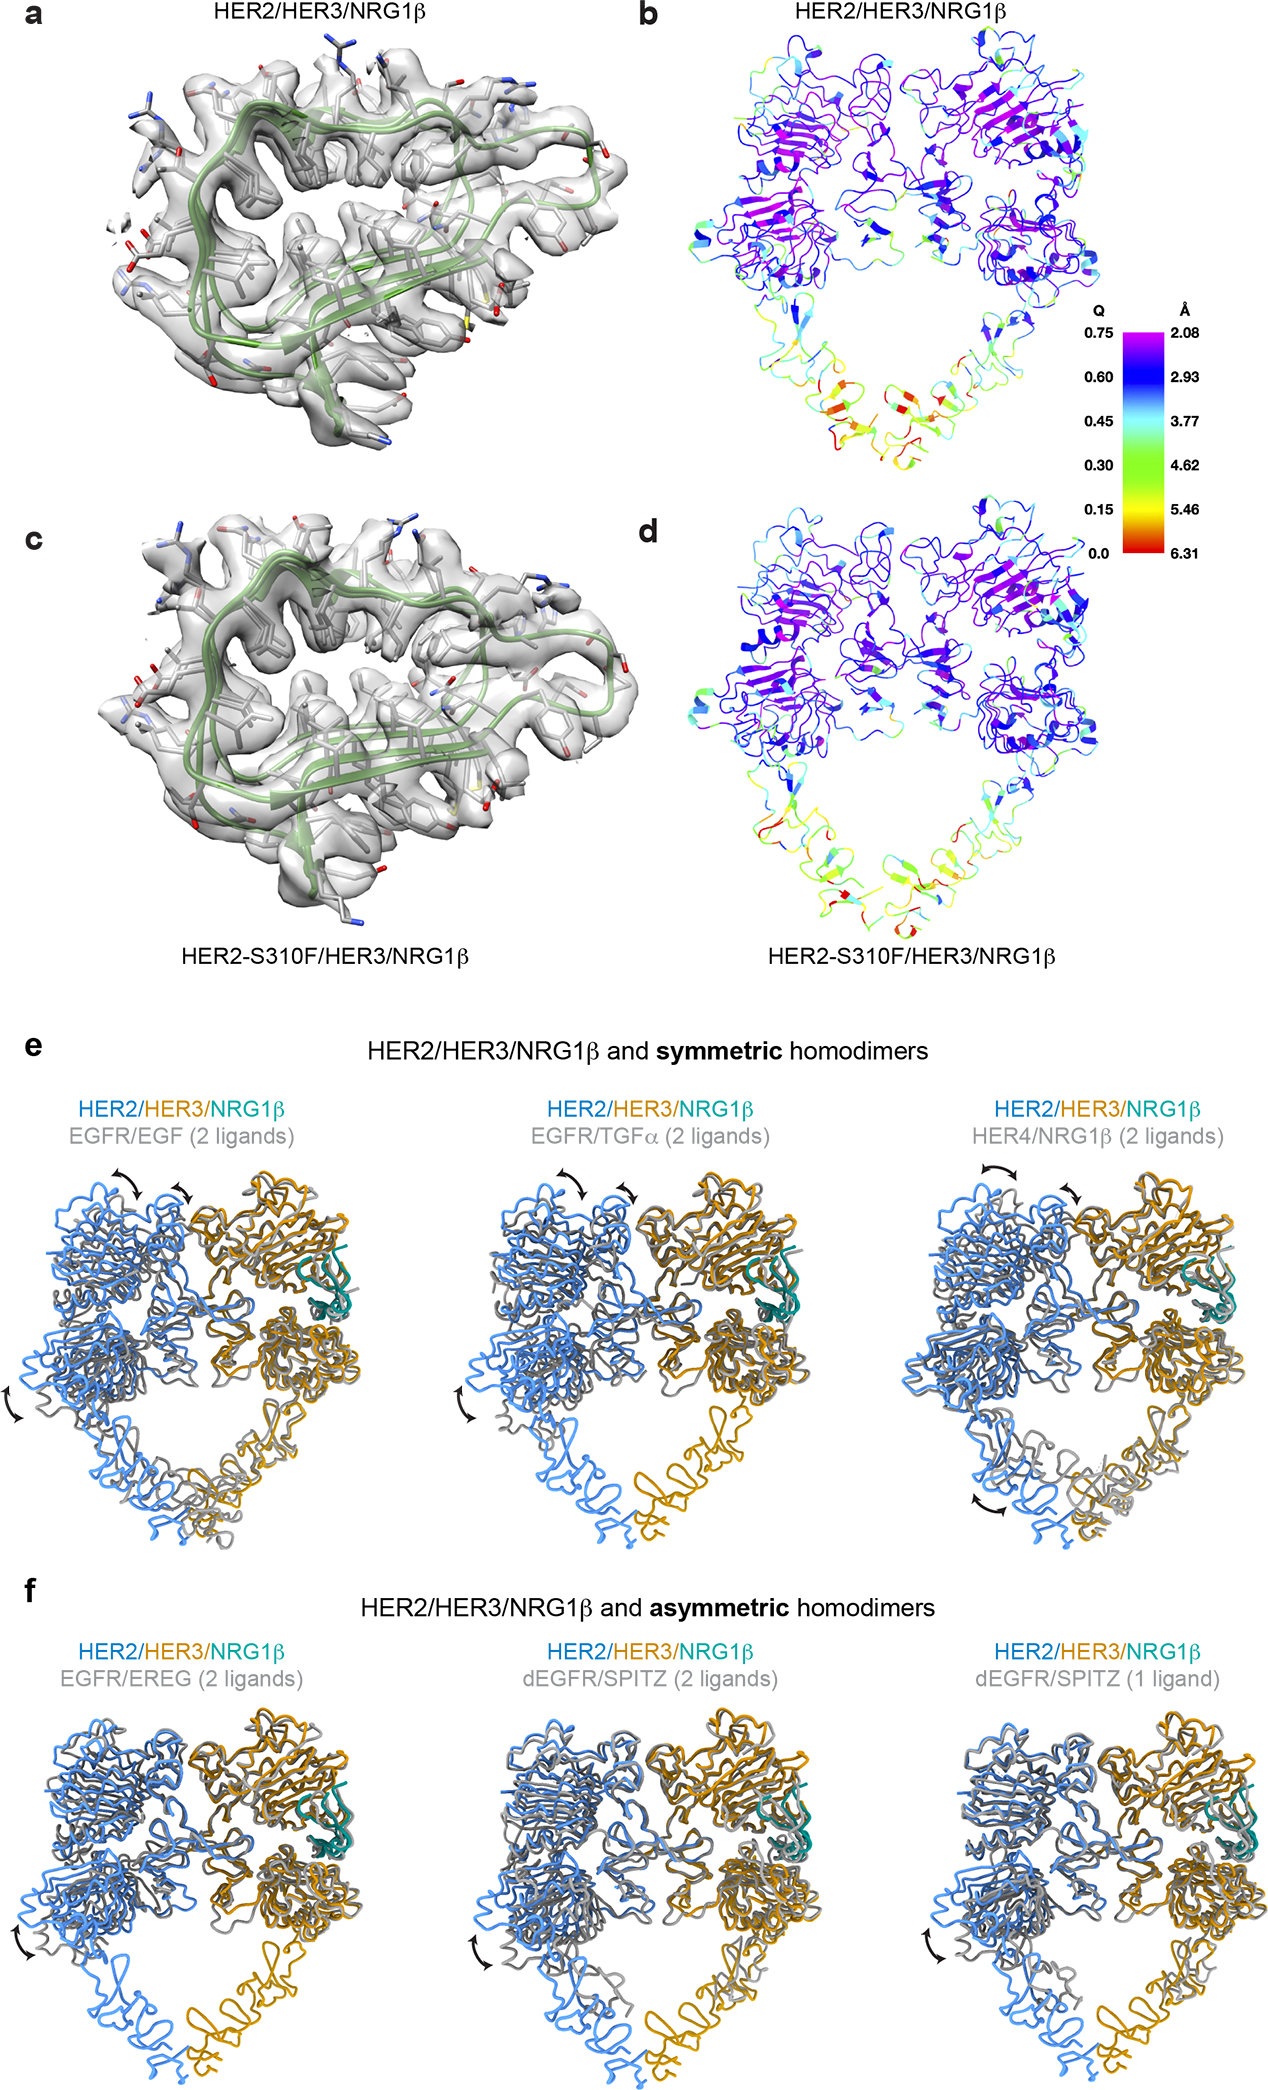
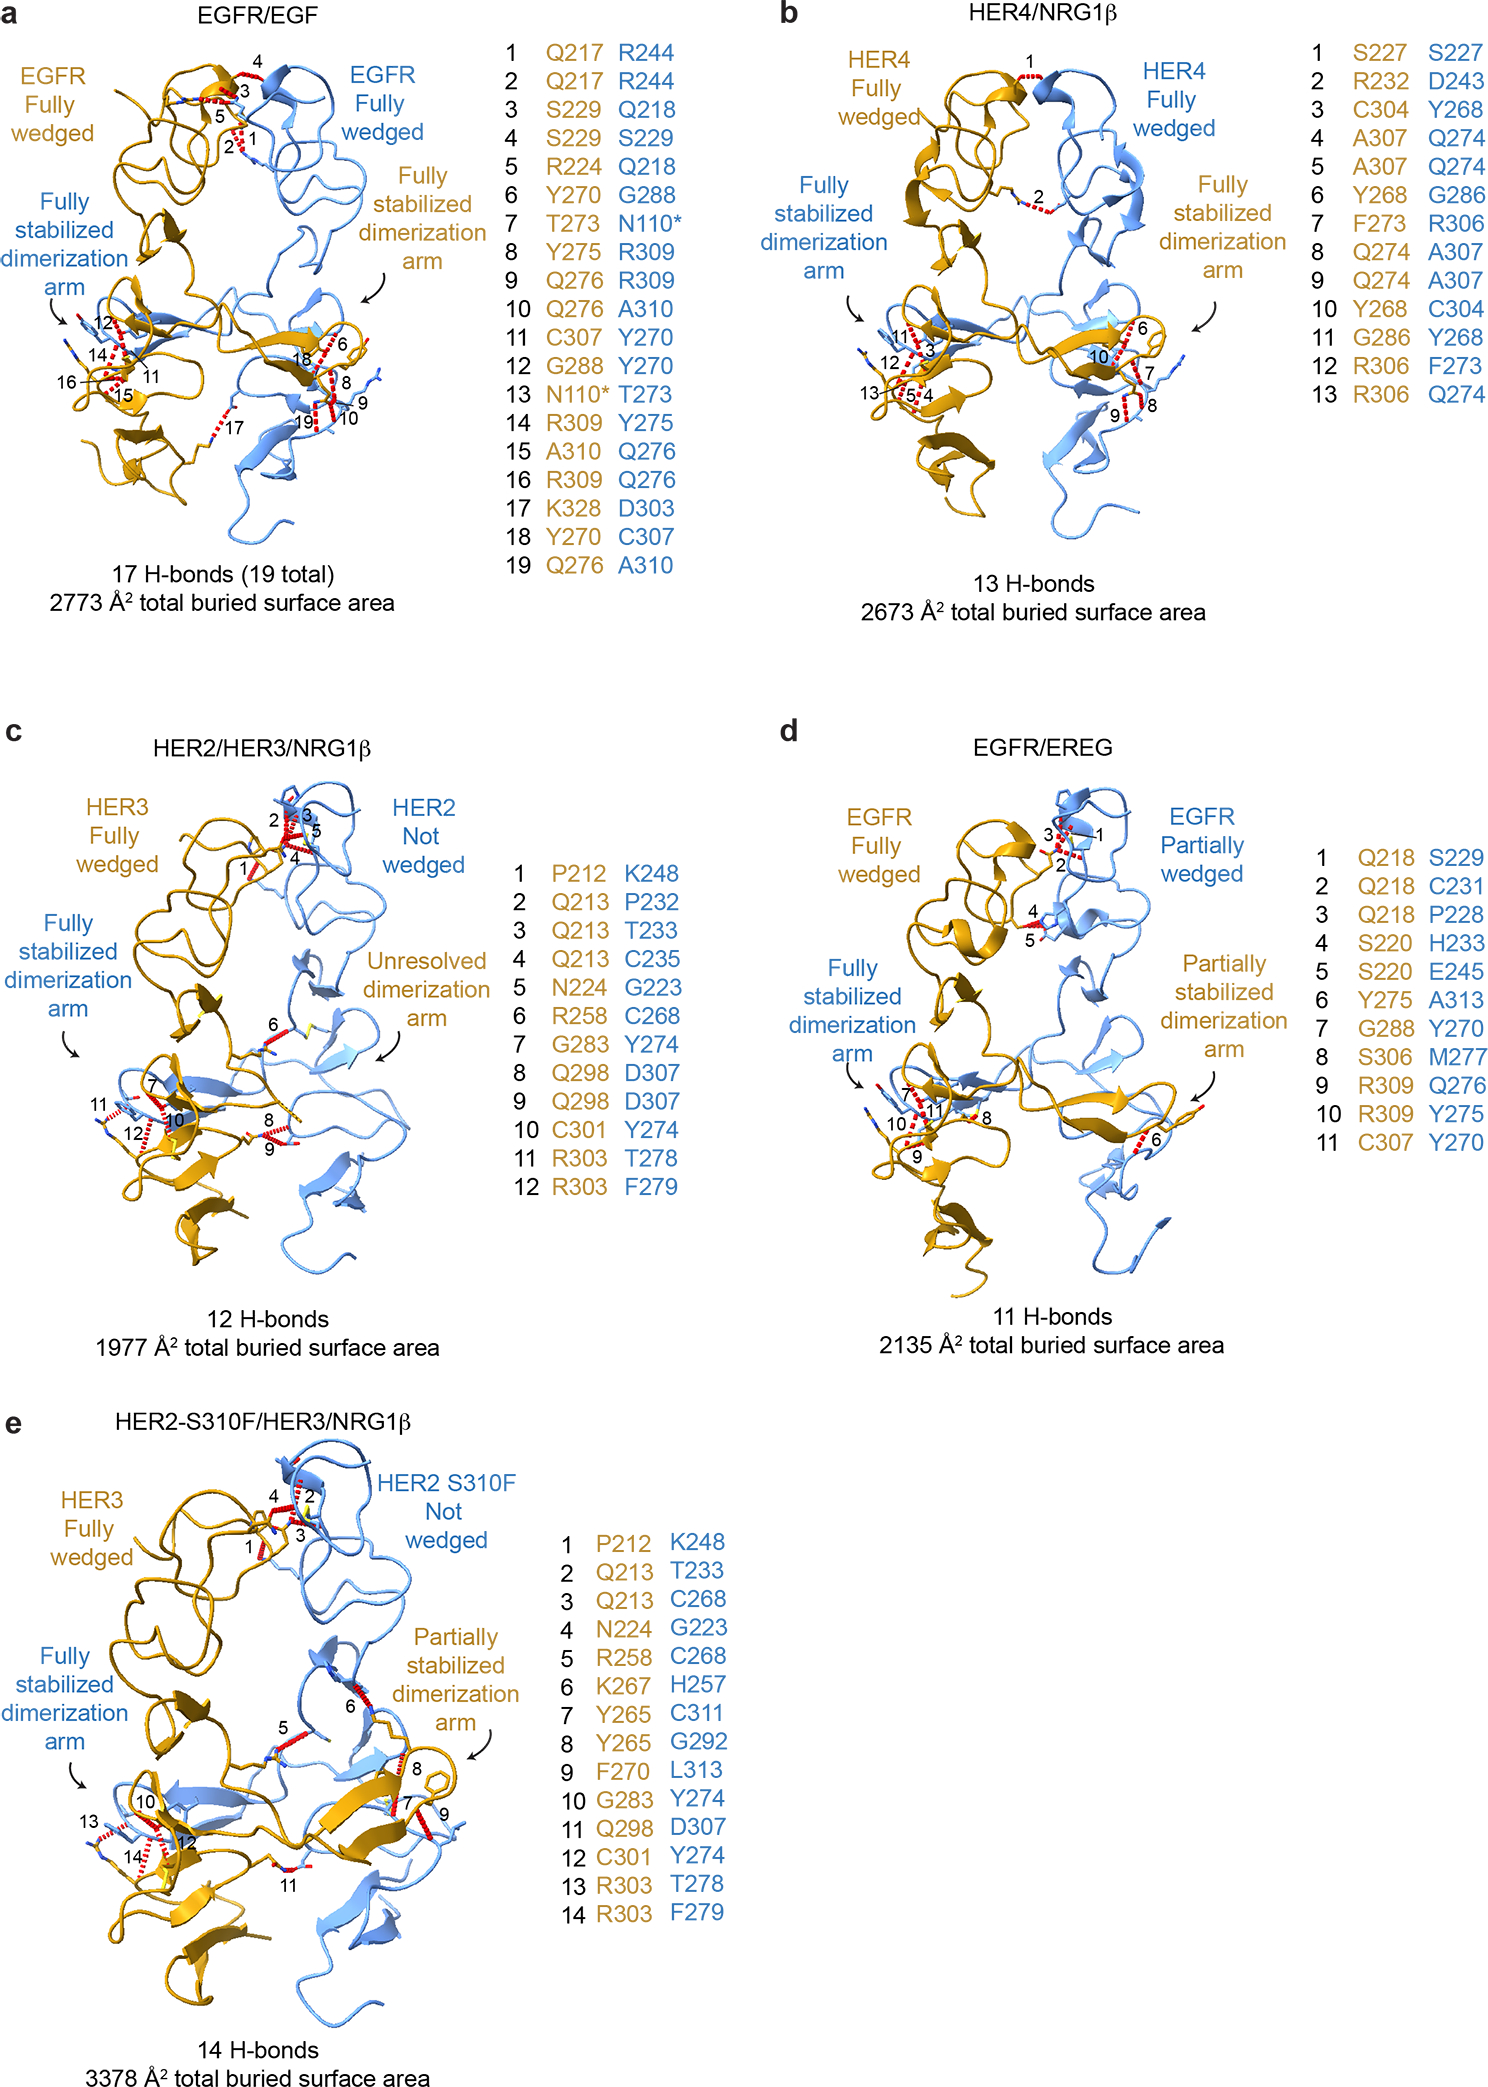
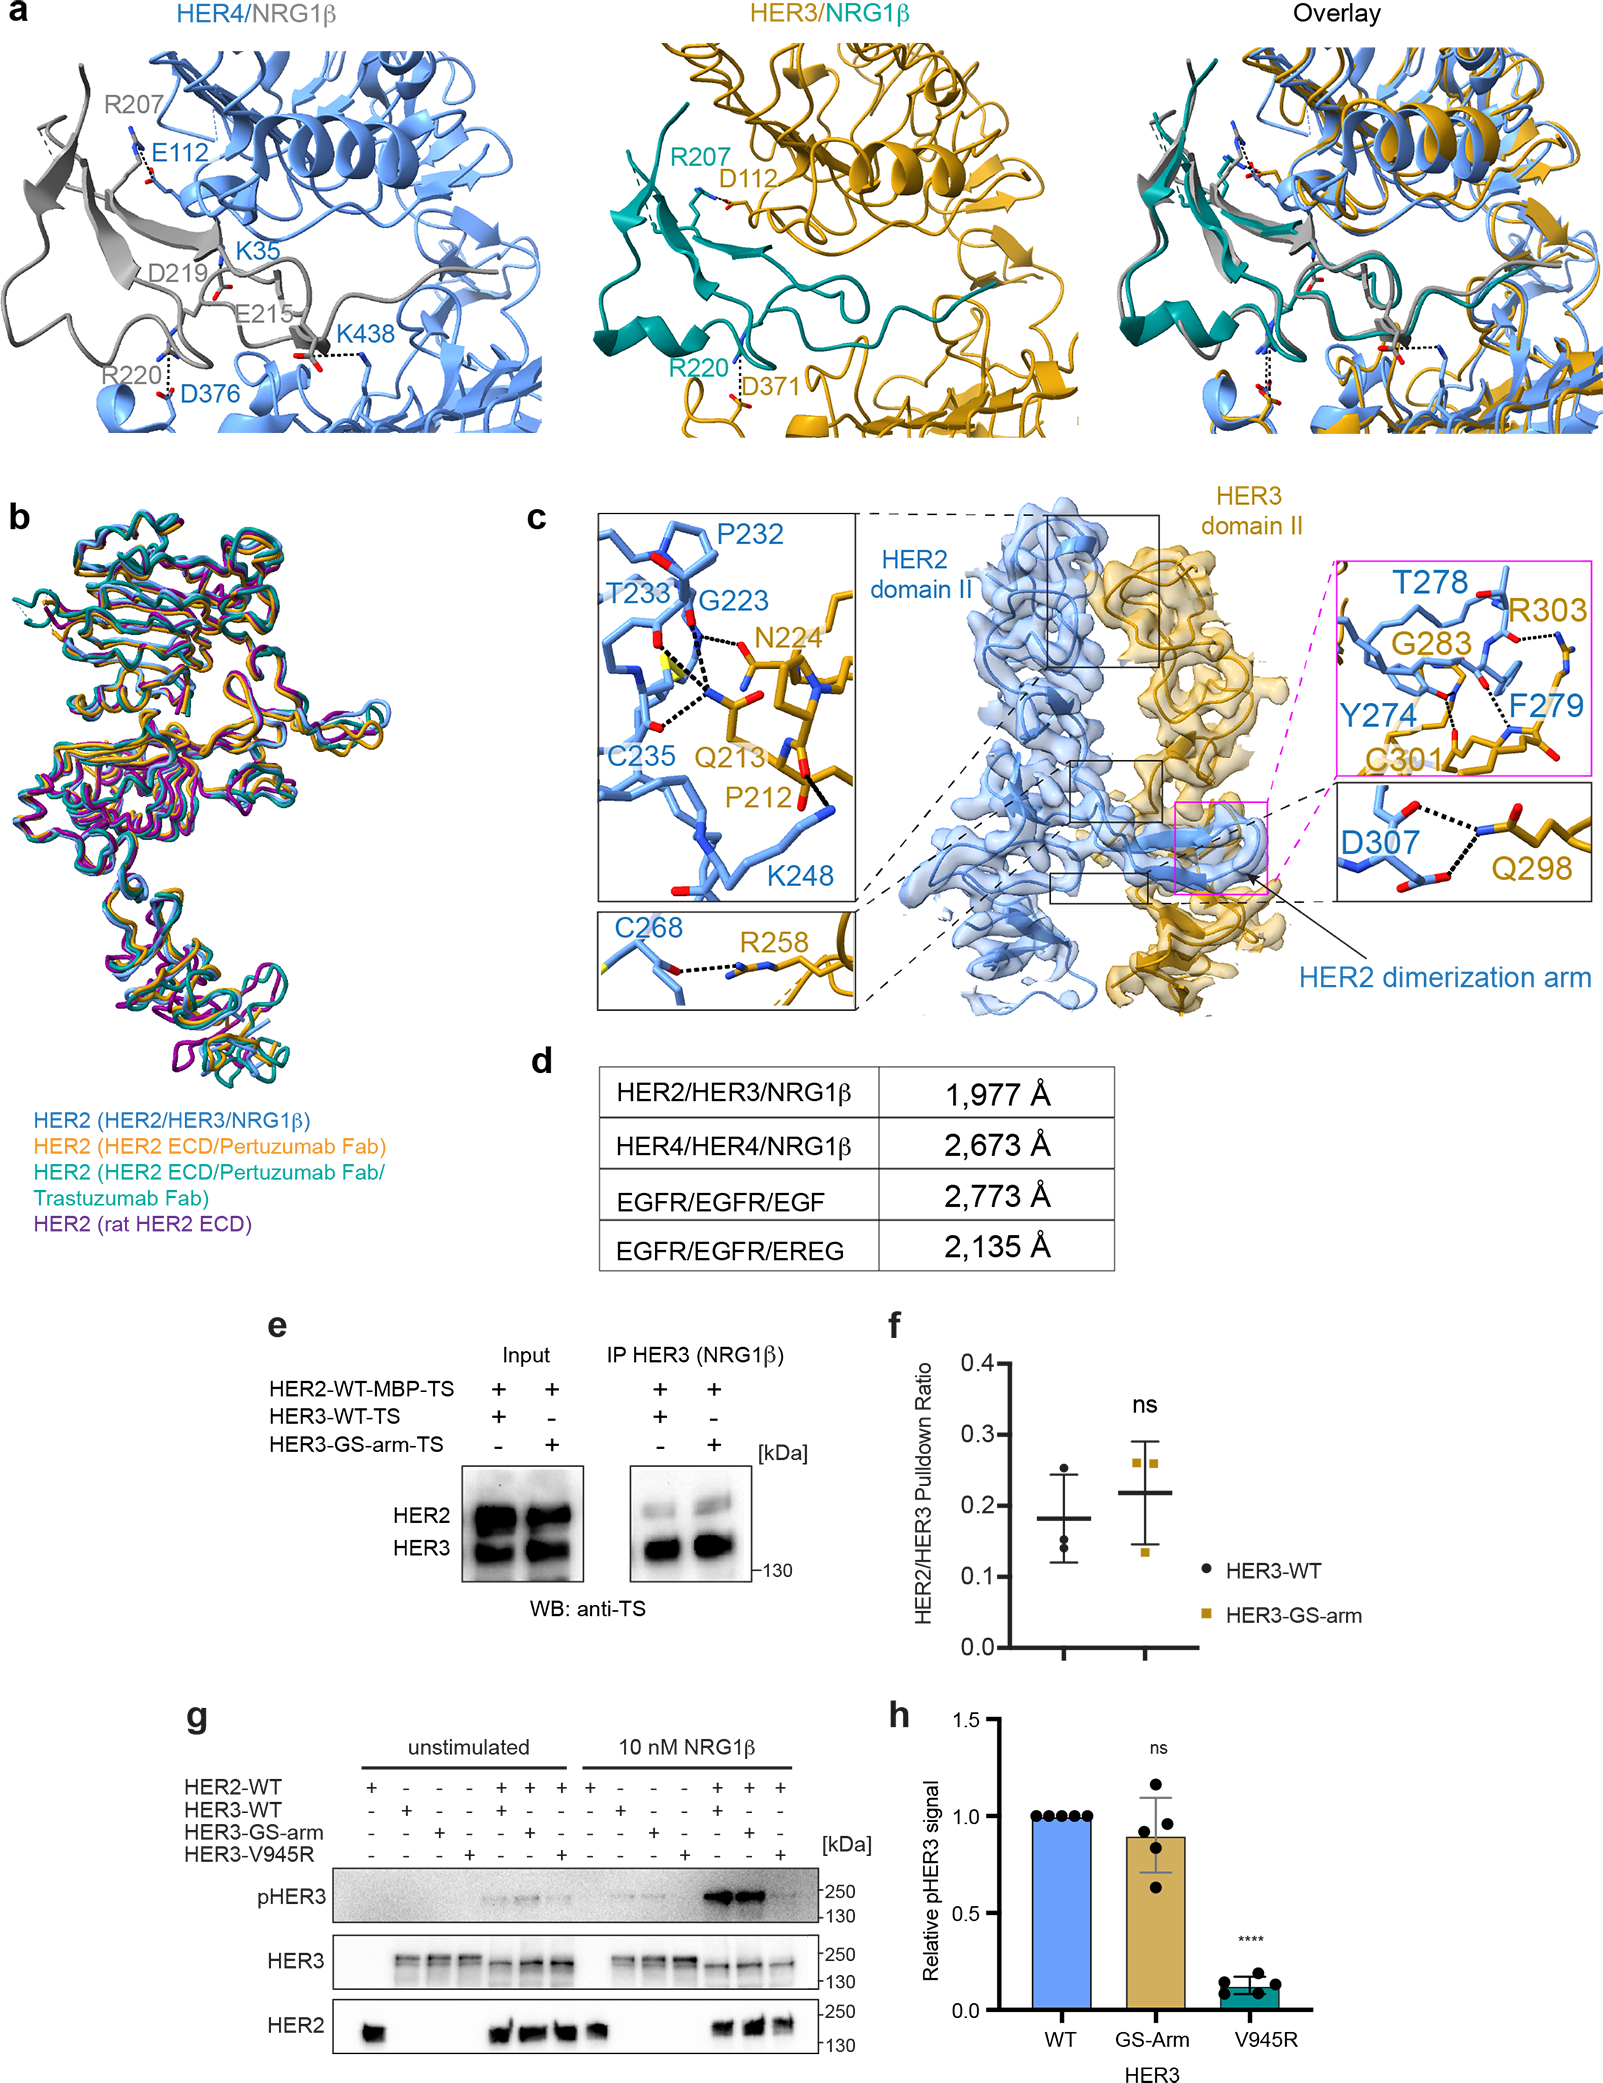
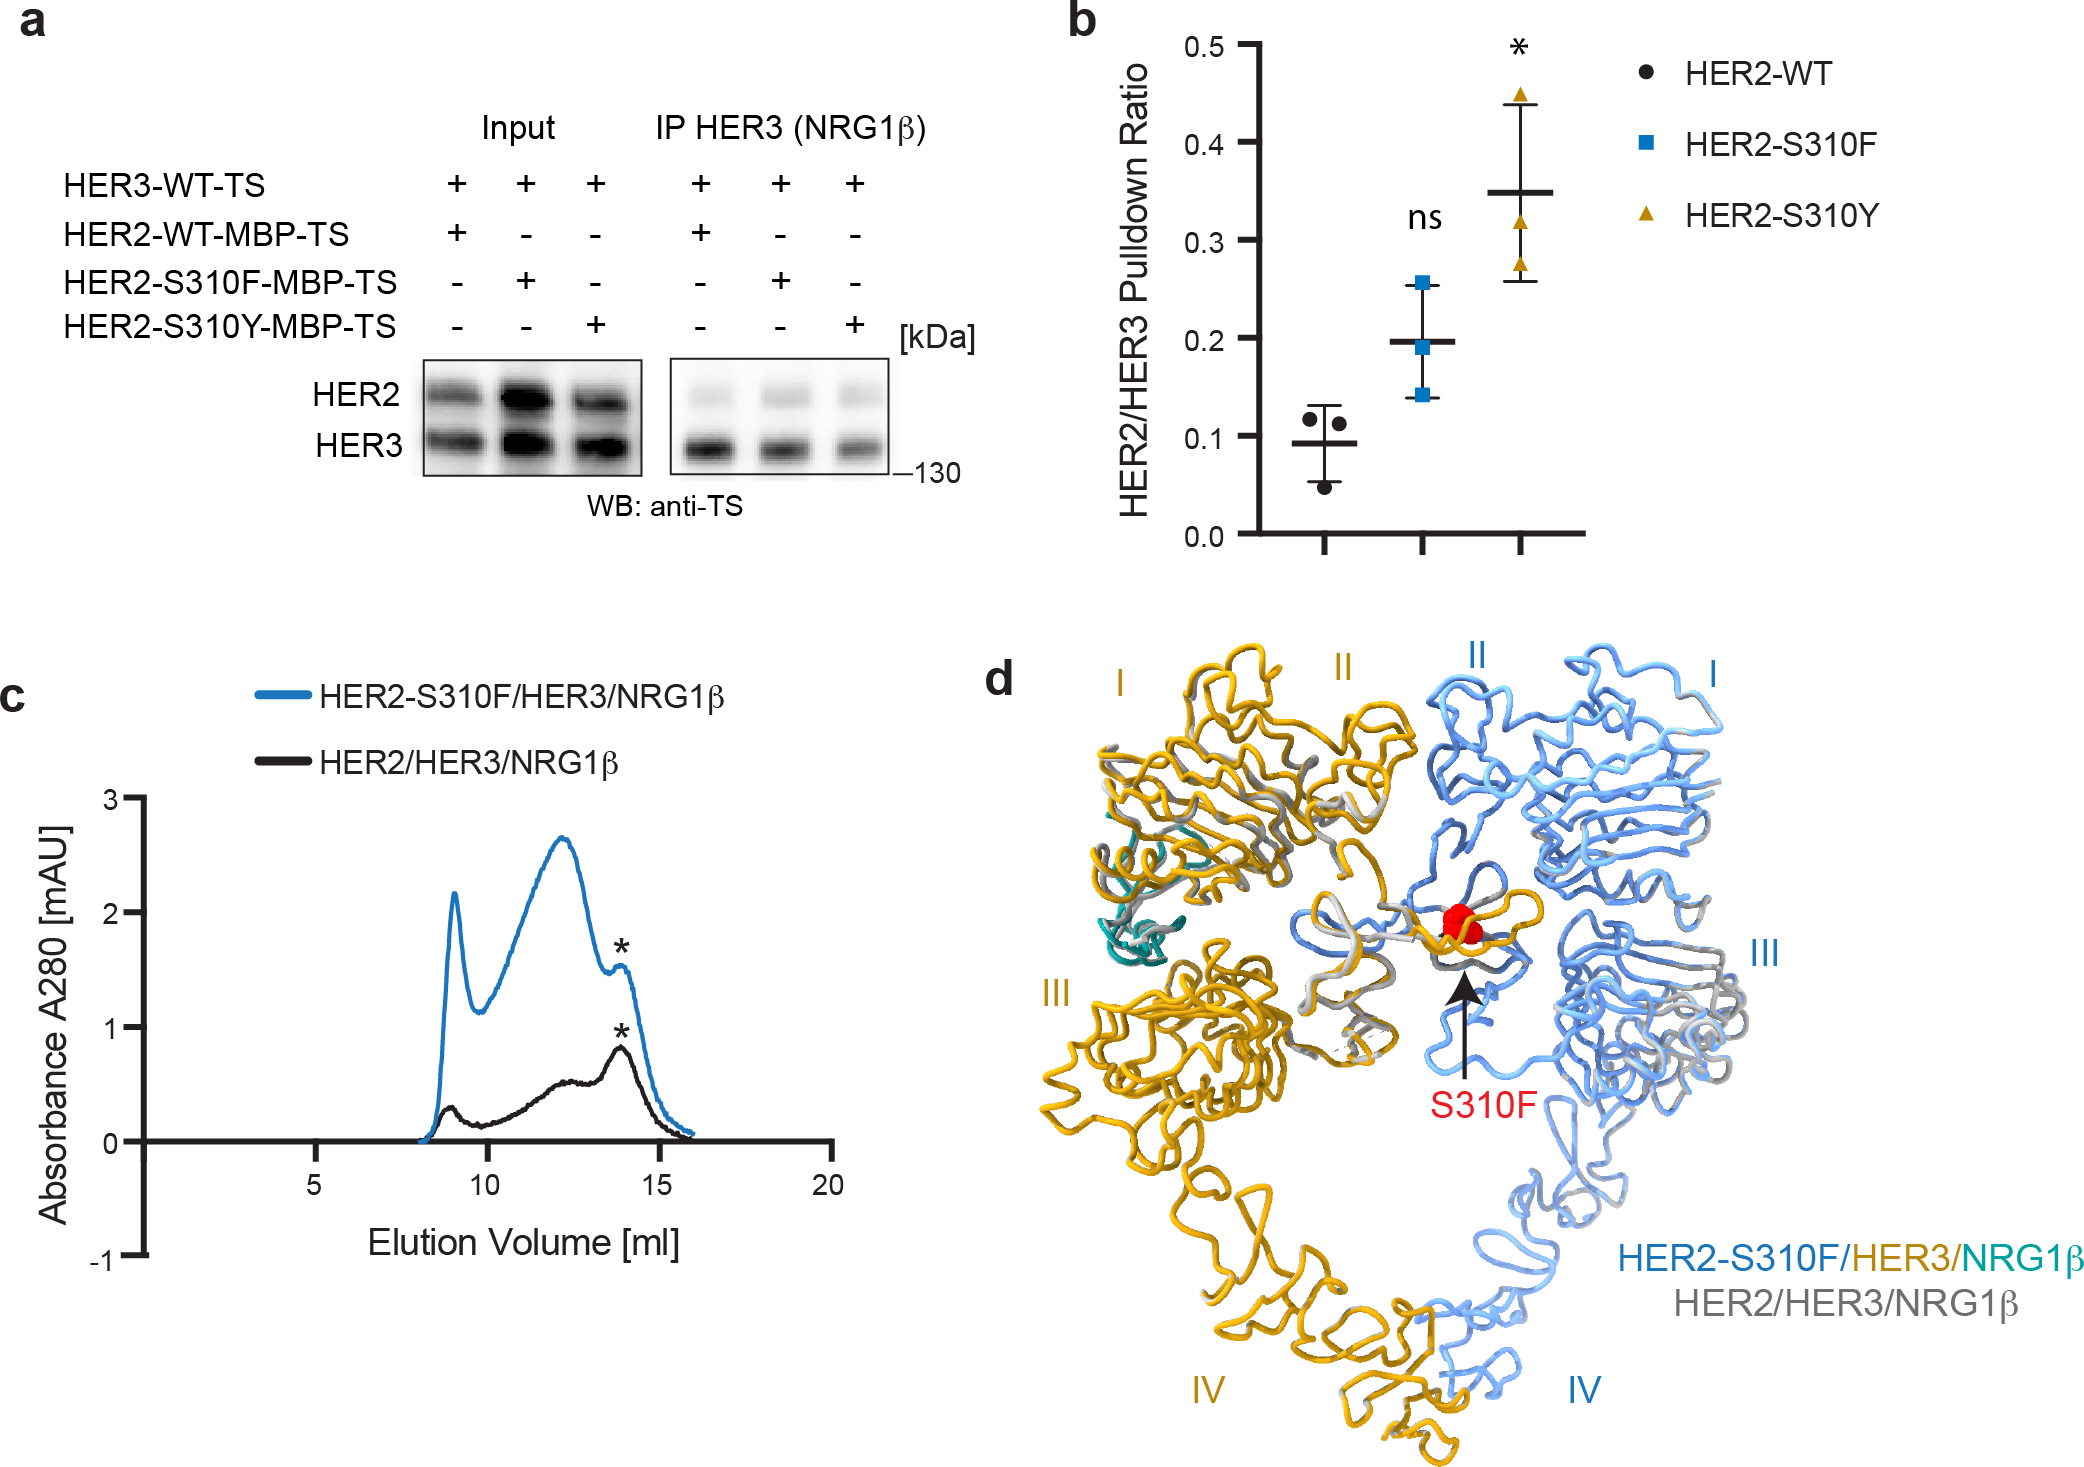
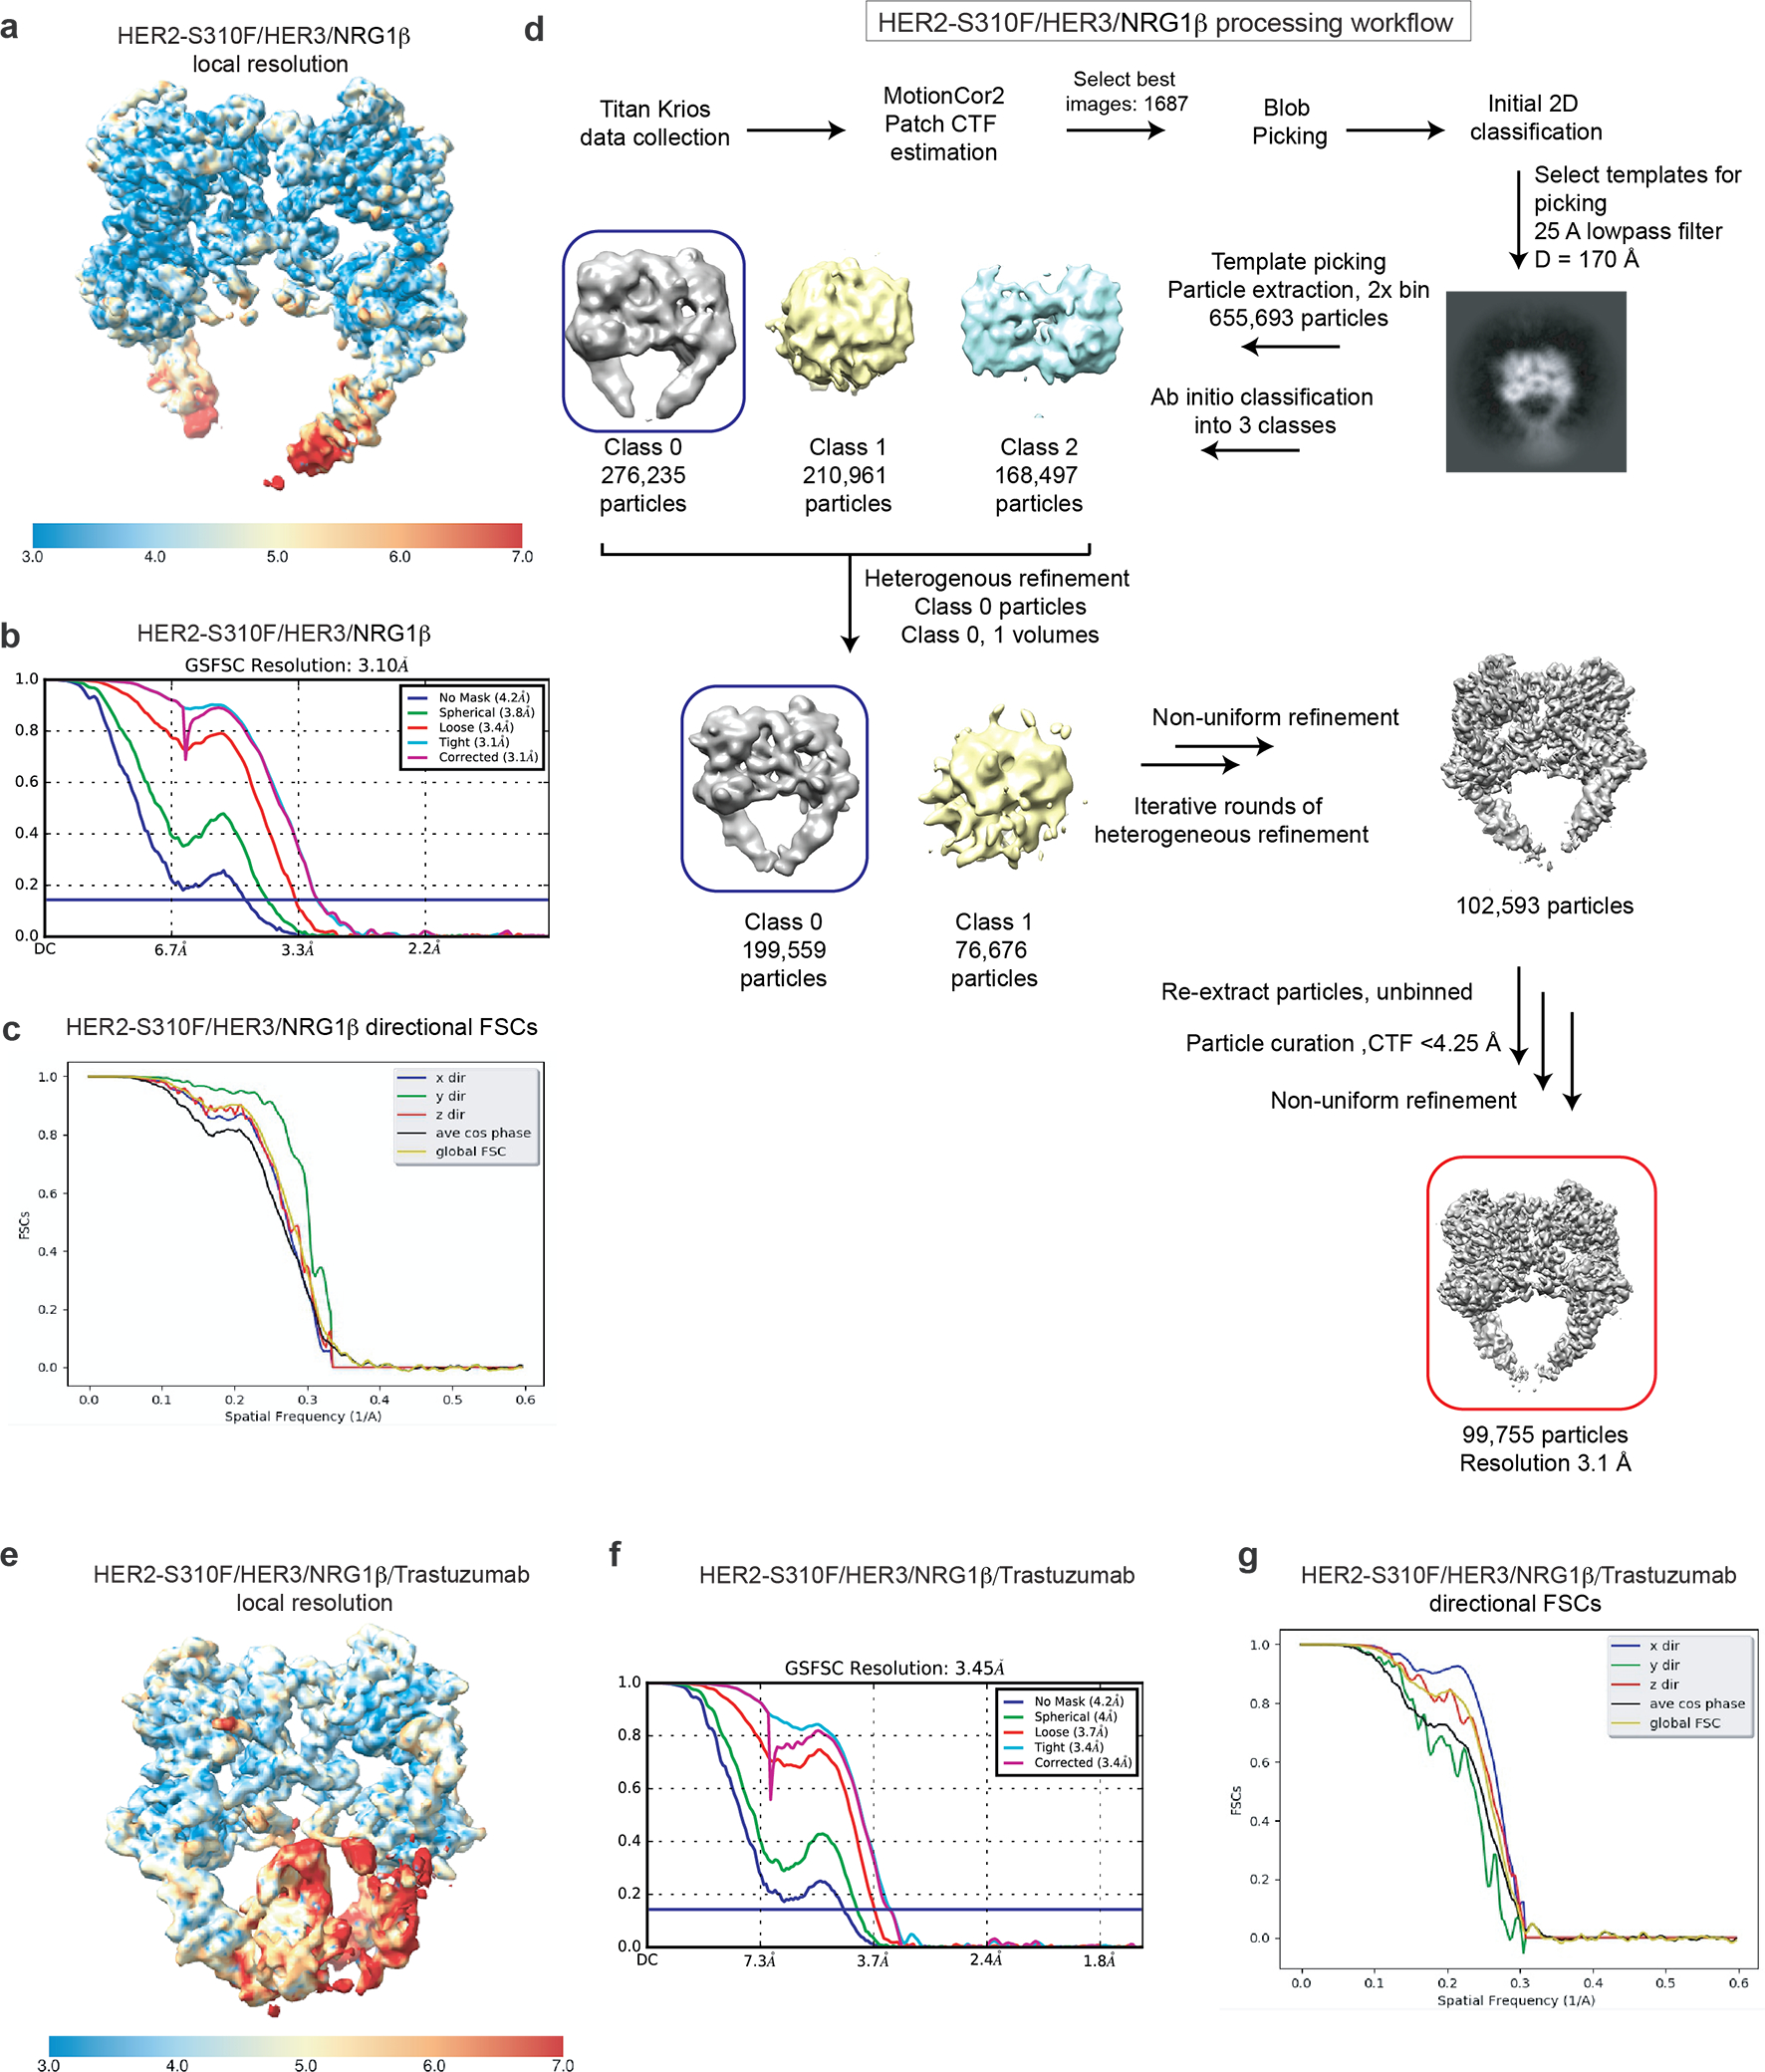
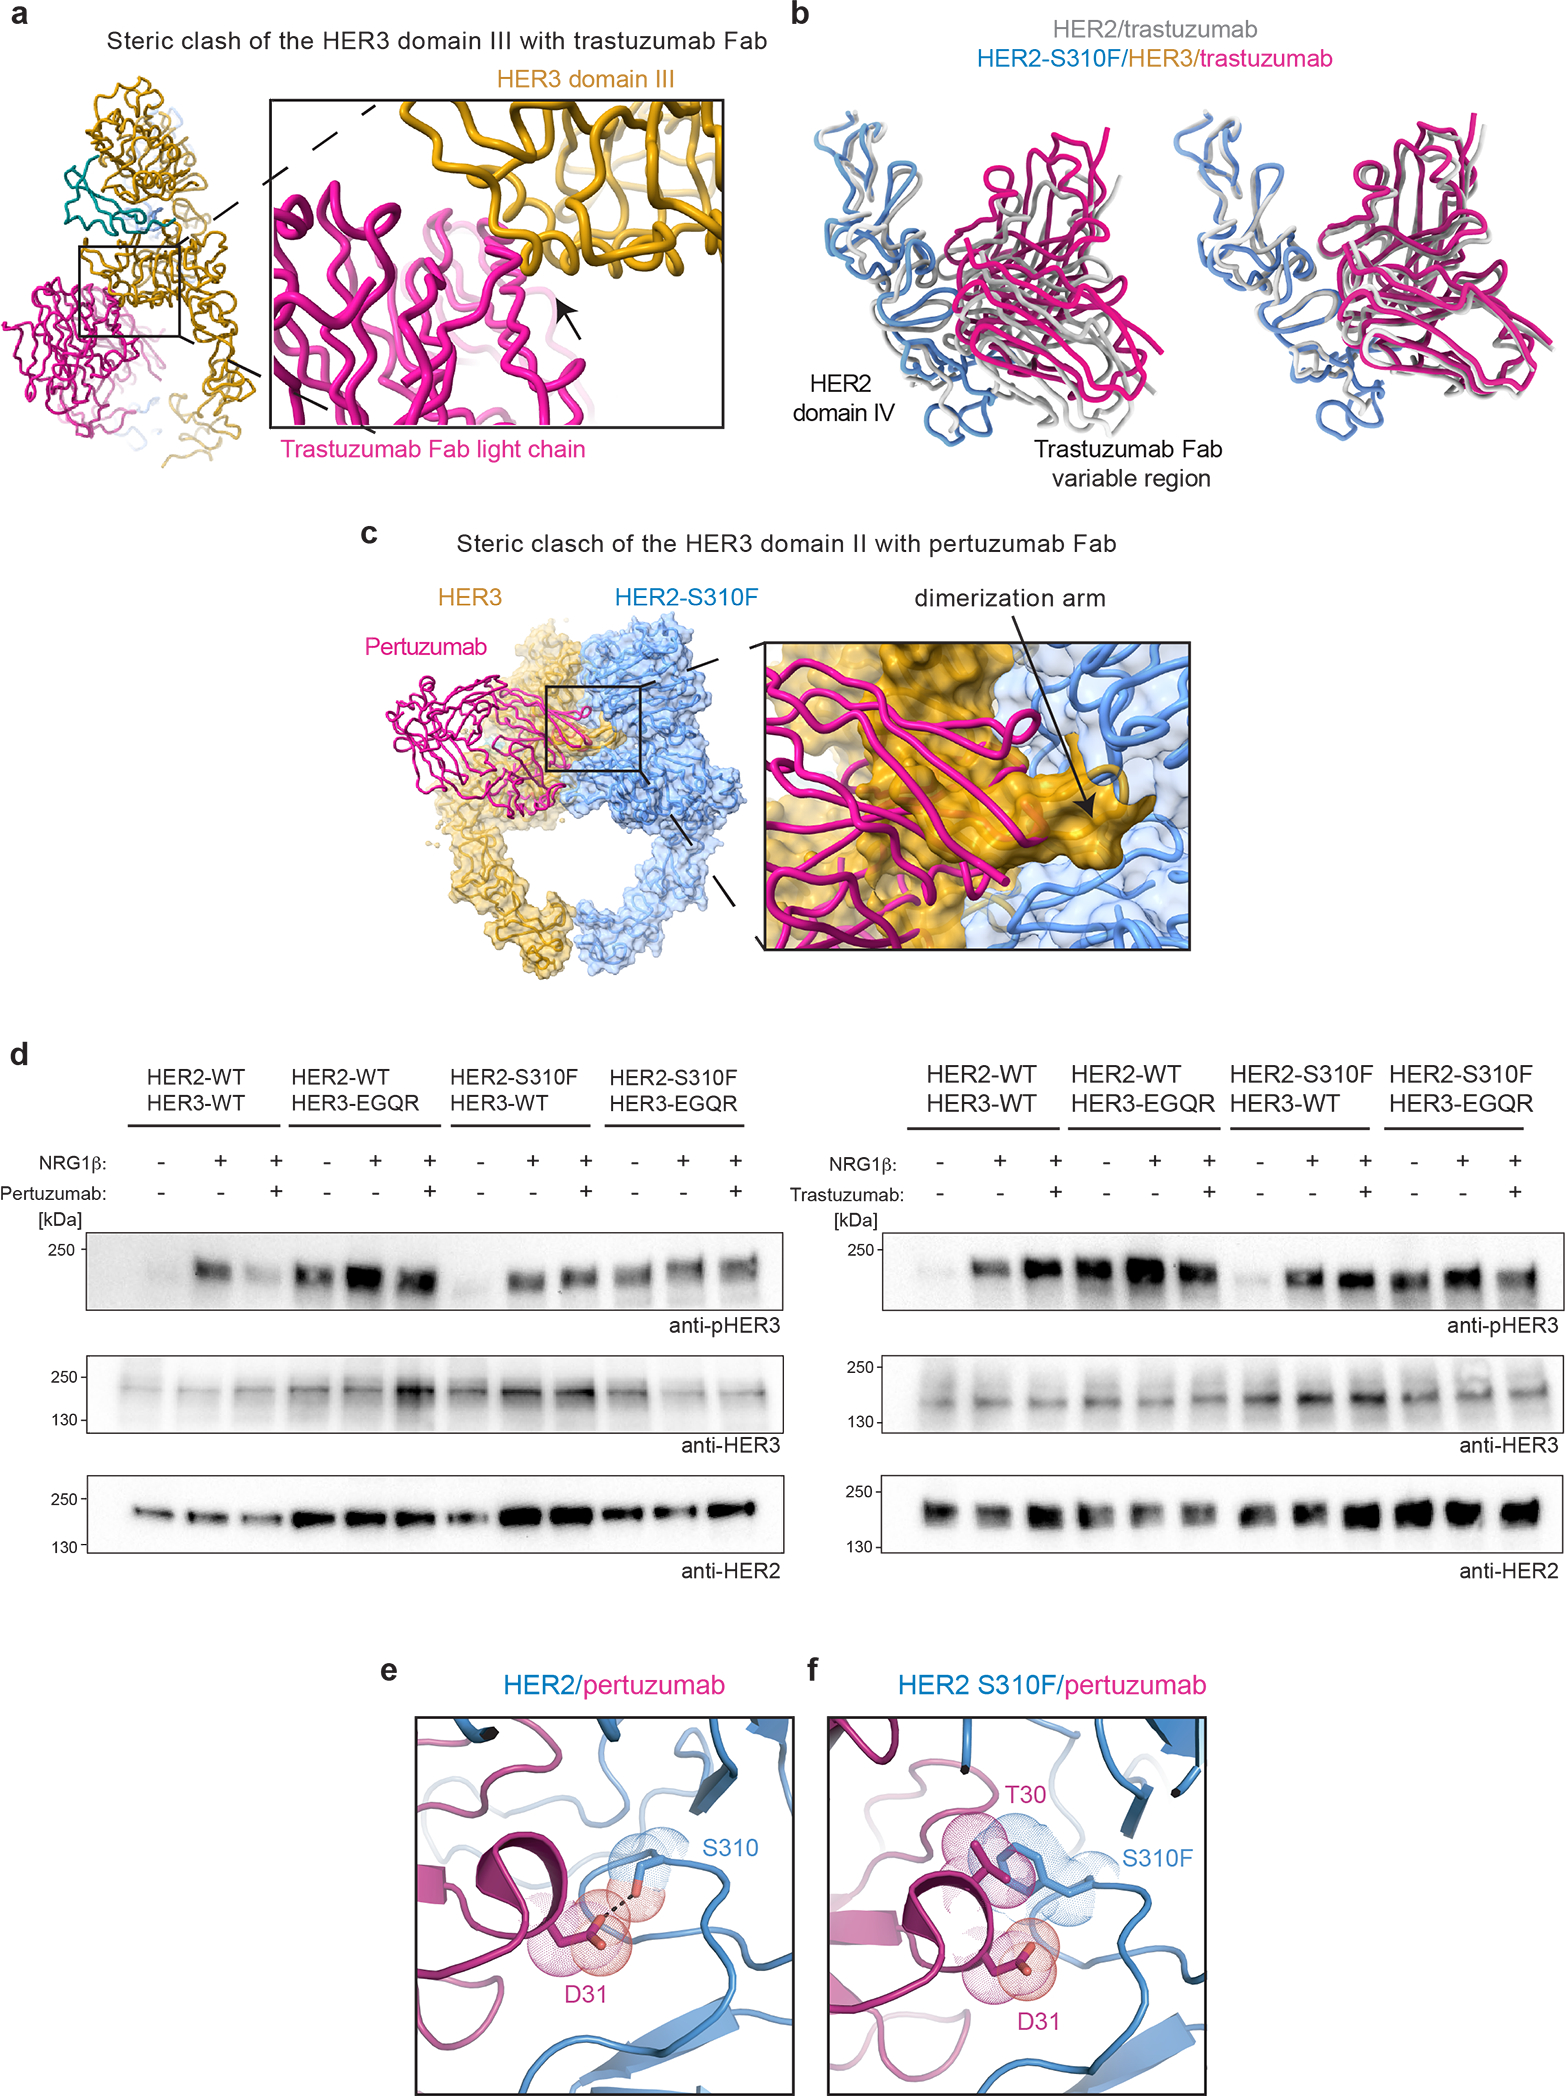
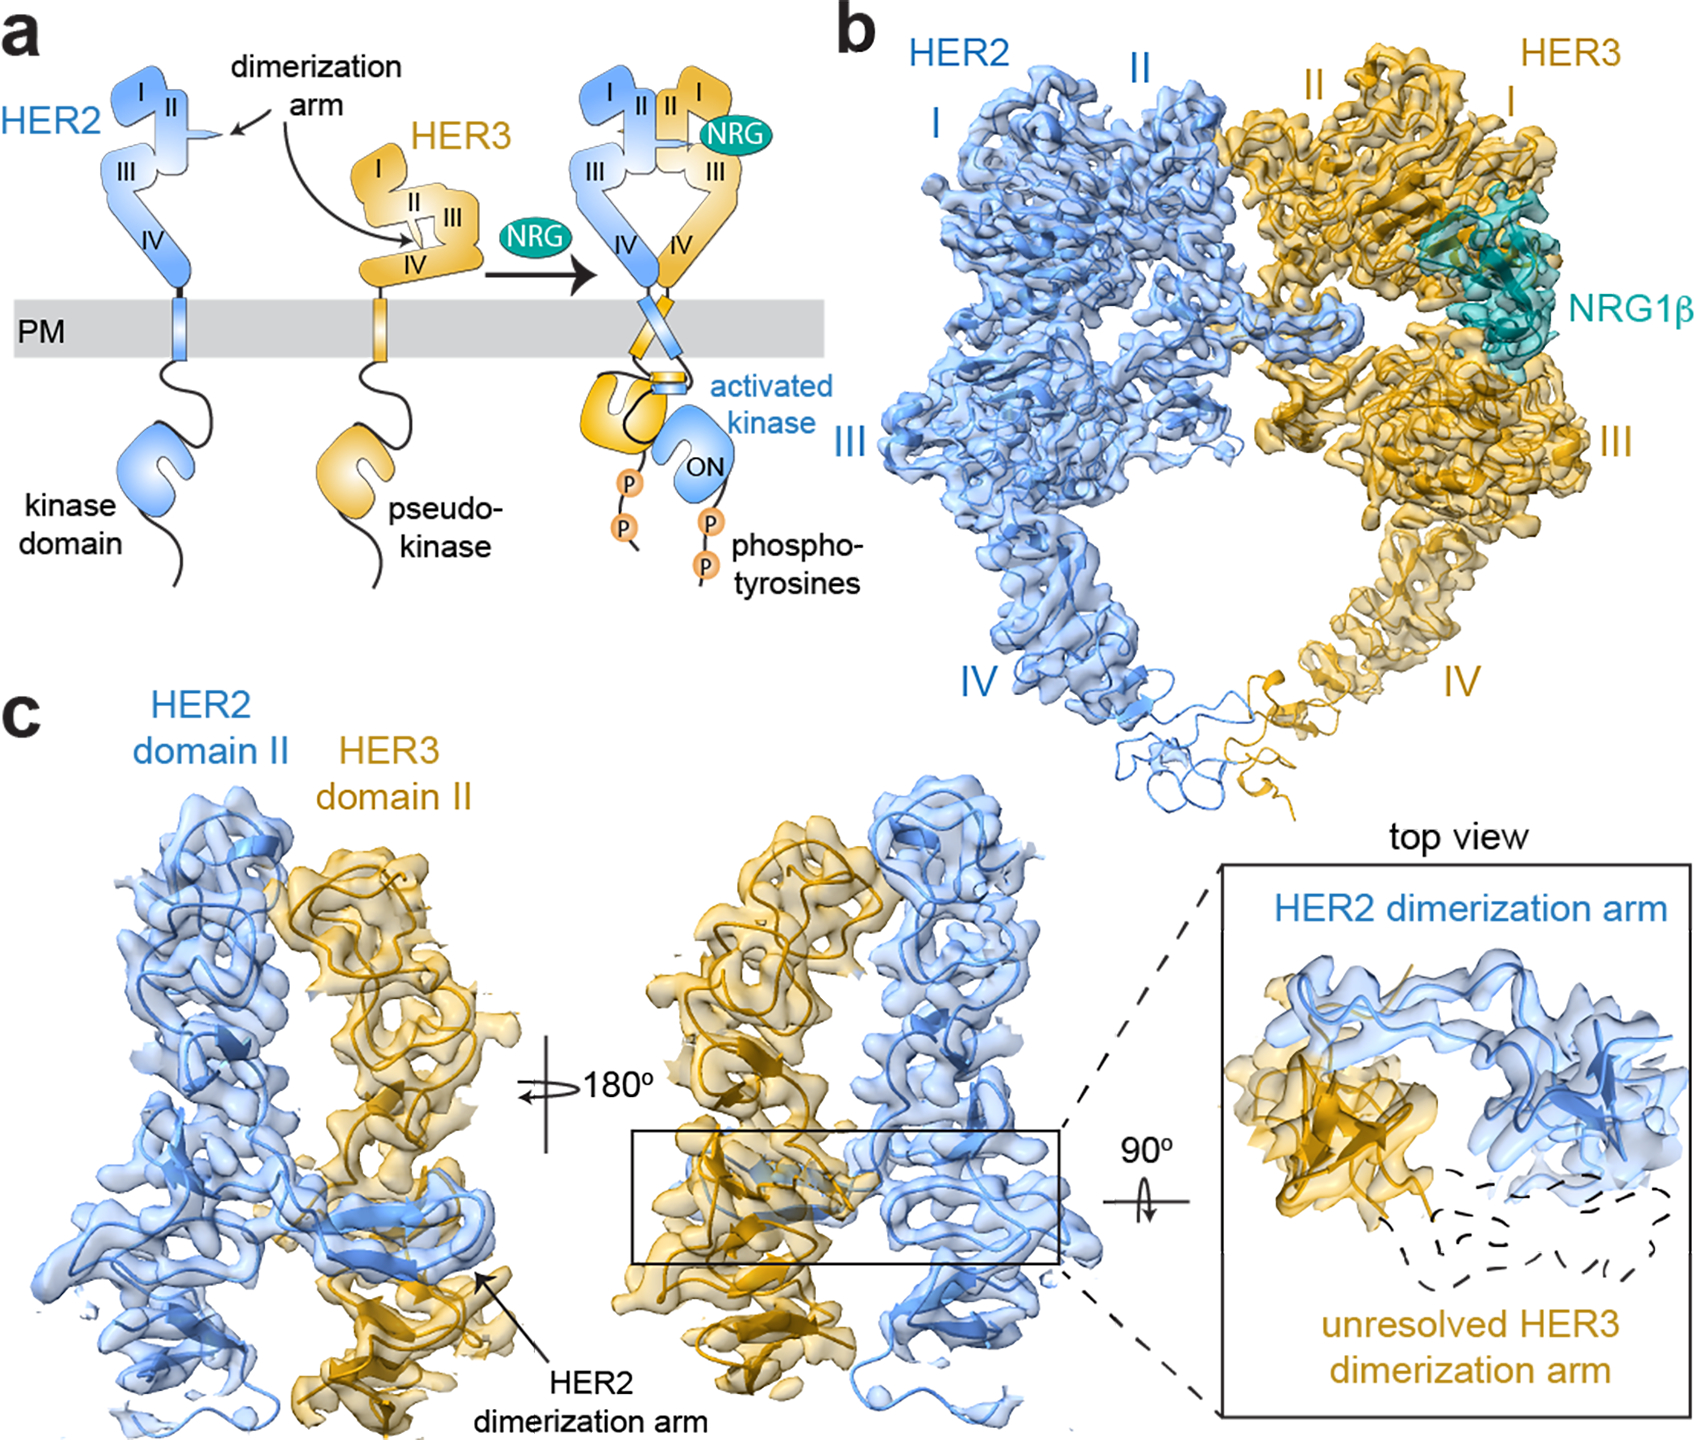
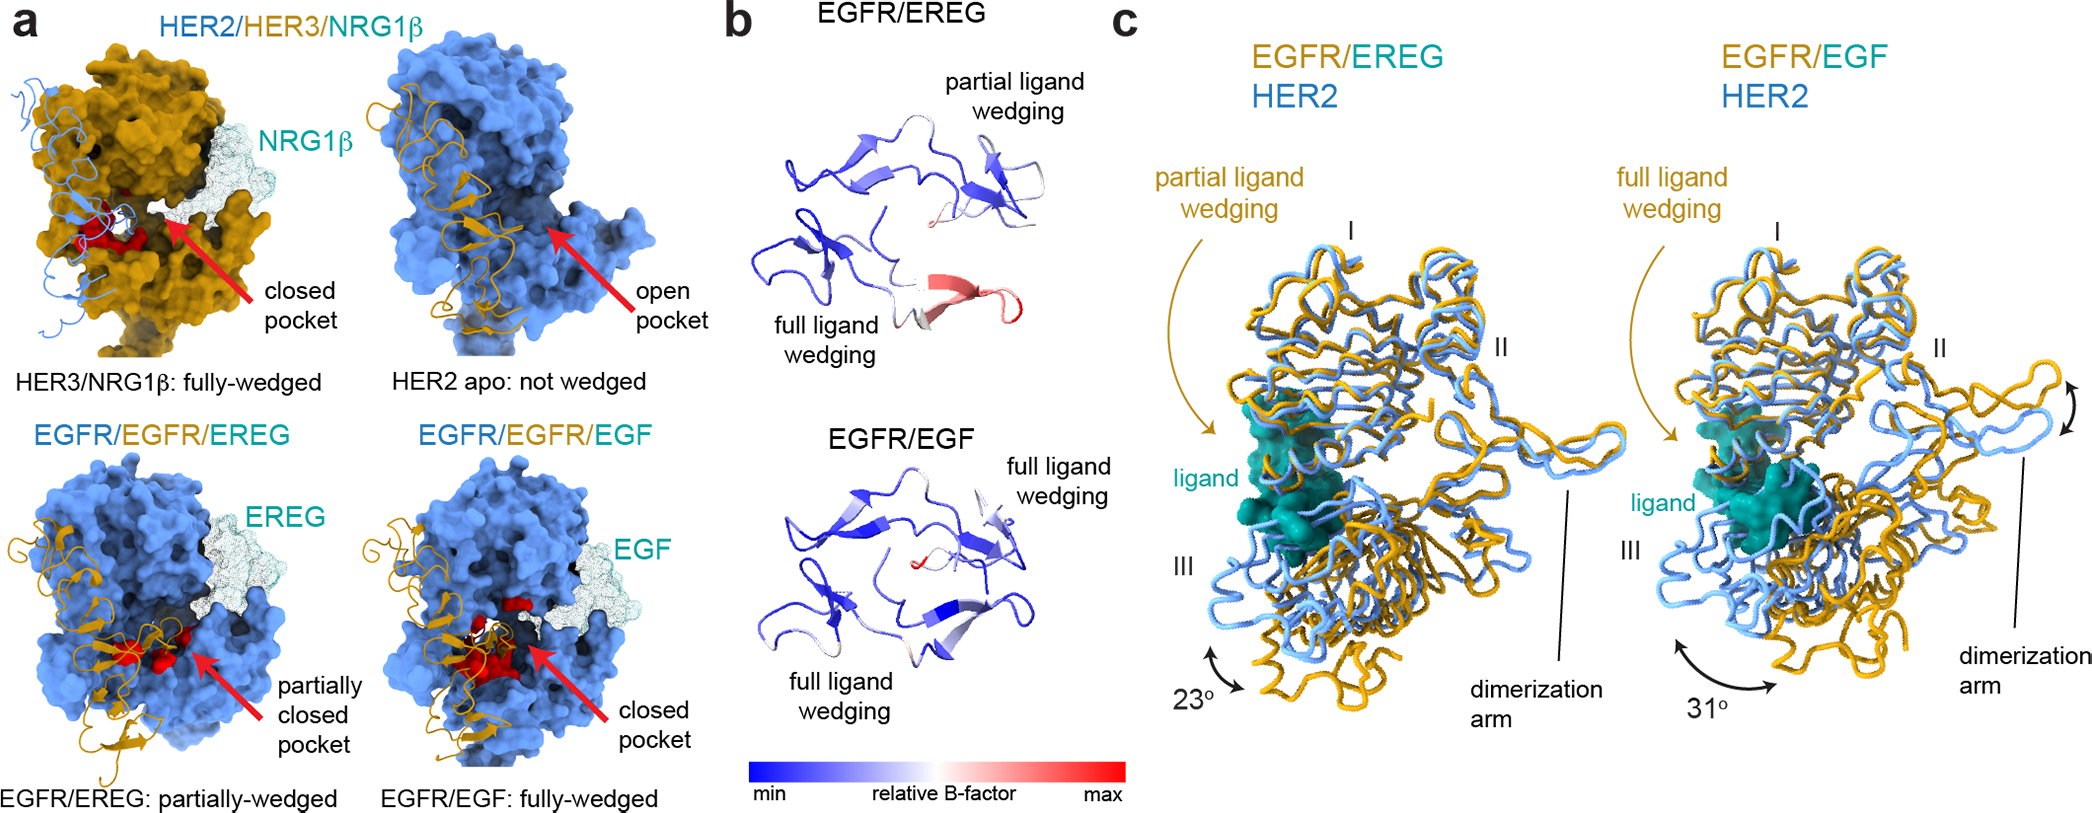
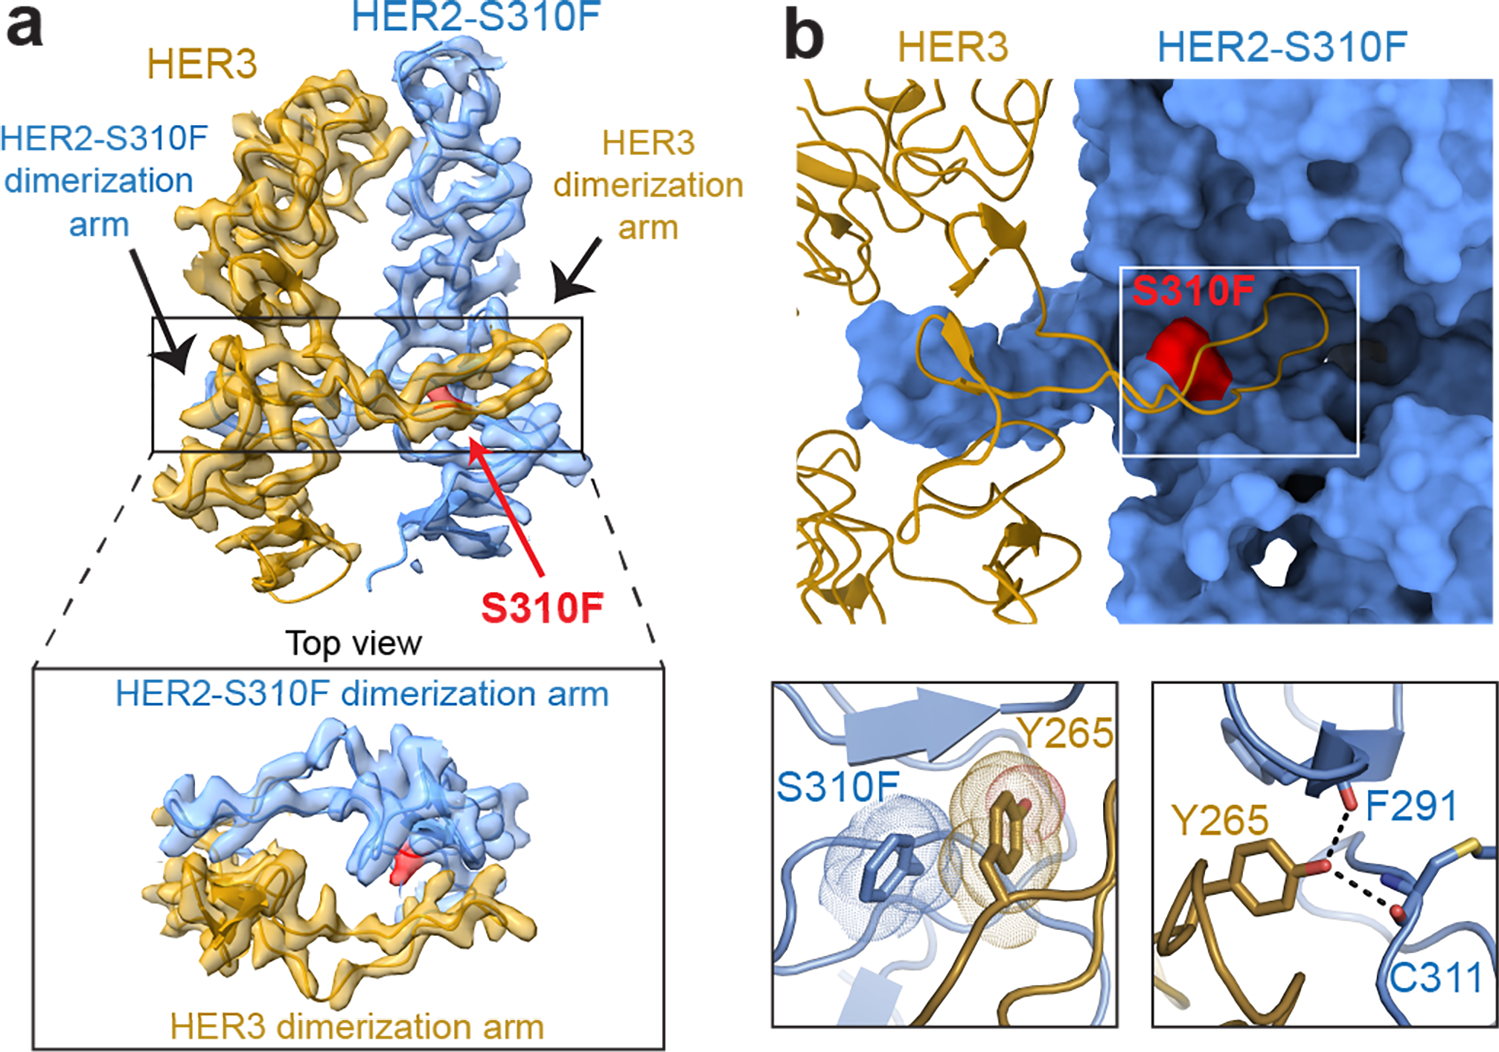
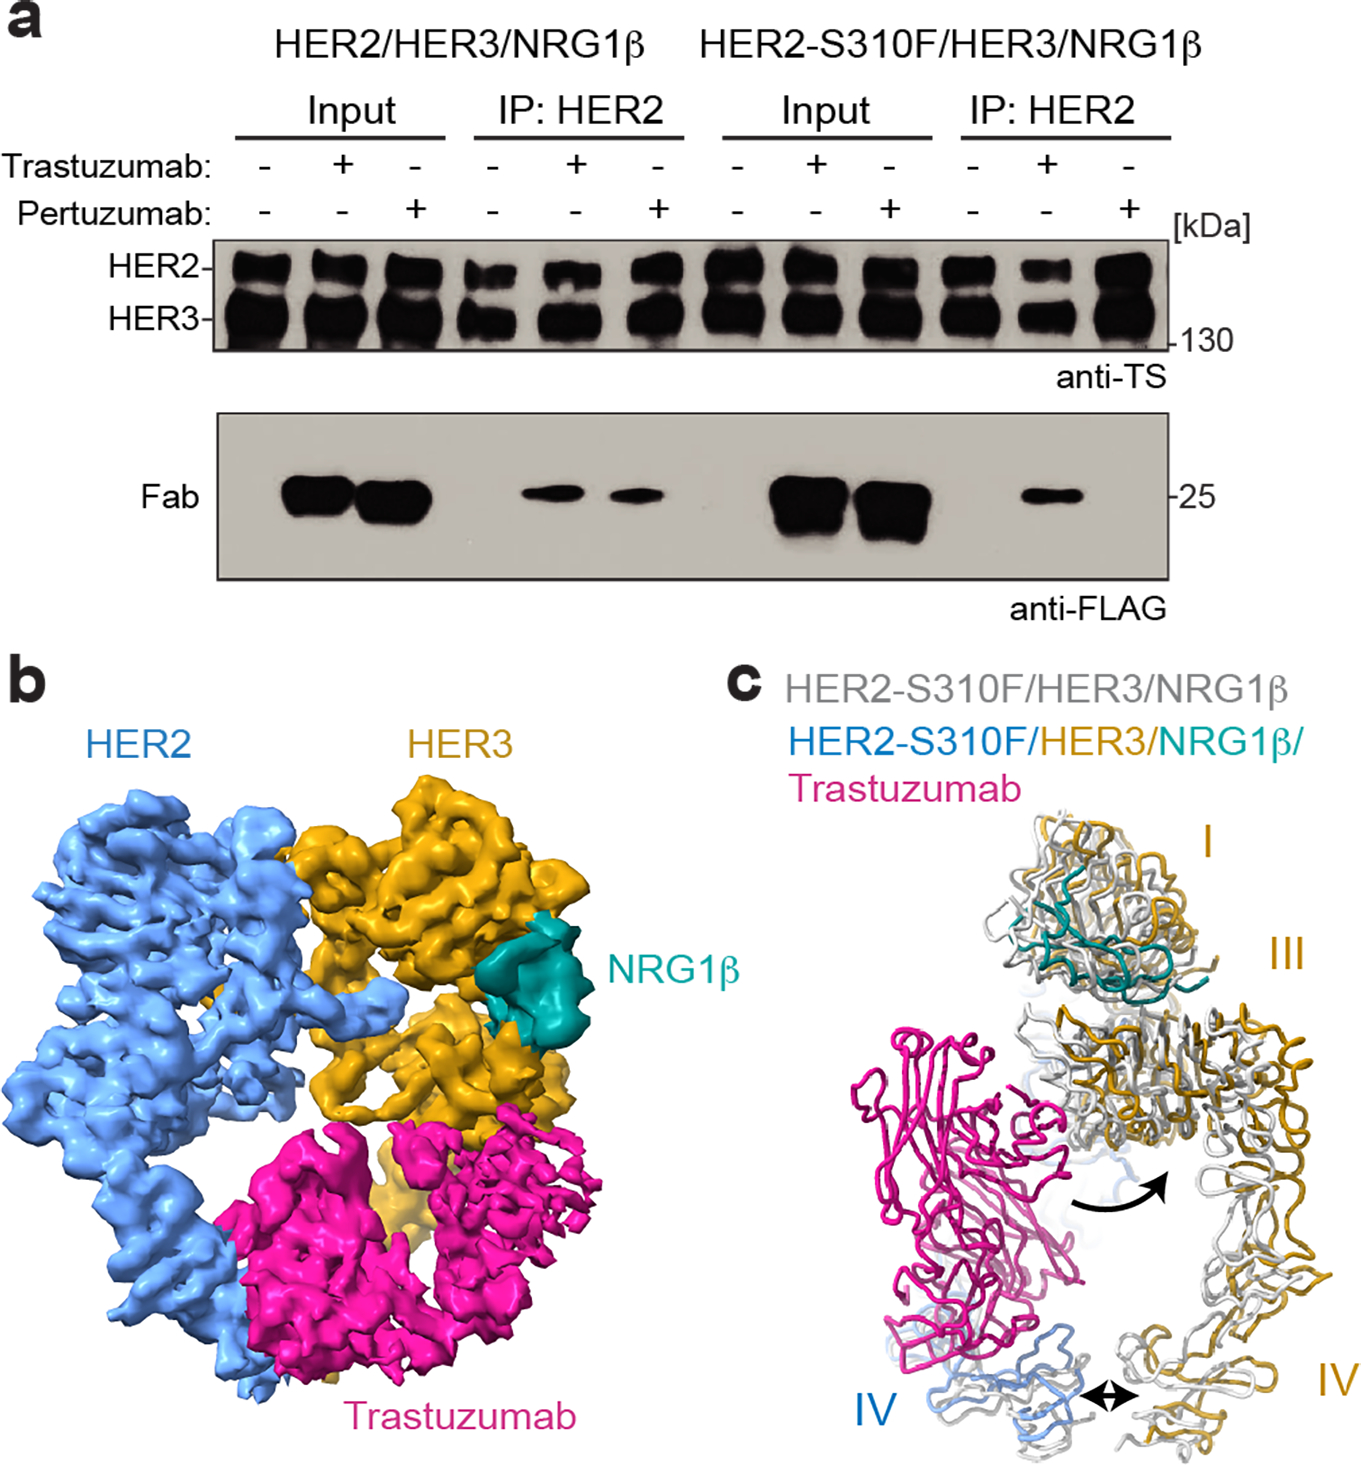
Human epidermal growth factor receptor 2 (HER2) and HER3 form a potent pro-oncogenic heterocomplex1-3 upon binding of growth factor neuregulin-1β (NRG1β). The mechanism by which HER2 and HER3 interact remains unknown in the absence of any structures of the complex. Here we isolated the NRG1β-bound near full-length HER2-HER3 dimer and, using cryo-electron microscopy, reconstructed the extracellulardomain module, revealing unexpected dynamics at the HER2-HER3 dimerization interface. We show that the dimerization arm of NRG1β-bound HER3 is unresolved because the apo HER2 monomer does not undergo a ligand-induced conformational change needed to establish a HER3 dimerization arm-binding pocket. In a structure of the oncogenic extracellular domain mutant HER2(S310F), we observe a compensatory interaction with the HER3 dimerization arm that stabilizes the dimerization interface. Both HER2-HER3 and HER2(S310F)-HER3 retain the capacity to bind to the HER2-directed therapeutic antibody trastuzumab, but the mutant complex does not bind to pertuzumab. Our structure of the HER2(S310F)-HER3-NRG1β-trastuzumab Fab complex reveals that the receptor dimer undergoes a conformational change to accommodate trastuzumab. Thus, similar to oncogenic mutations, therapeutic agents exploit the intrinsic dynamics of the HER2-HER3 heterodimer. The unique features of a singly liganded HER2-HER3 heterodimer underscore the allosteric sensing of ligand occupancy by the dimerization interface and explain why extracellular domains of HER2 do not homo-associate via a canonical active dimer interface.


Conflict of interest statement

COMPETING INTERESTS

N.J. is a member of the SAB and a shareholder of Turning Point Therapeutics, SUDO Biosciences and Type6 Therapeutics. The Jura laboratory has received sponsored research support from Genentech. Other authors do not declare competing interests.

Figures

Extended Data Fig. 1 |
Extended Data Fig. 1 |. Purification, characterization, and reconstruction of the near full-length HER2/HER3/NRG1β heterocomplex.
a, Schematic summary of the HER2/HER3/NRG1β complex purification strategy. b, A representative Coomassie-stained SDS-PAGE gel analysis of the HER2/HER3/NRG1β complex after purification showing bands corresponding to the HER2 and HER3 receptors. The gel is representative of three independent experiments. c, Representative size exclusion chromatography profile of the HER2/HER3/NRG1β complex resolved on a Superose6 10/300 Increase column (GE Healthcare). The major peak at ~14 ml elution volume is marked grey and corresponds to the fractions used for structural studies. We routinely obtained a 1–2 mAu peaks for the complex preparations from 120 ml of mammalian culture, which was sufficient for the structural studies. d, Mass photometry of the peak sample indicates that the majority of particles have an average mass of ~326 kDa with a standard deviation of 17 kDa. The mass is consistent with that of the HER2/HER3/NRG1β complex (predicted ~280 kDa without accounting for micelle mass, ~340 kDa assuming a ~60 kDa DDM micelle mass). e, Representative negative stain electron microscopy 2D class averages of sample from HER2/HER3/NRG1β complex fractions (ECDs (extracellular domains), ICDs (intracellular domains)). f, Near full-length reconstruction of HER2-S310F/HER3/NRG1β after particle recentering with center of mass at the micelle in RELION from a ~45,000 particle stack. Rod-shaped density consistent with the asymmetric kinase domain dimer is visible below the micelle. g, The reconstruction accommodates models of the HER2-S310F/HER3/NRG1β extracellular domains from this study, two helical transmembrane domains and juxtamembrane-A (JM-A) segments from HER2 (PDB ID 2N2A), and kinases arranged in the asymmetric dimer (homology model generated based on structures of the EGFR kinase from PDB ID 3KEX and PDB ID 3PP0). HER2 is colored in blue, HER3 in golden yellow, and NRG1β in teal.
Extended Data Fig. 2 |
Extended Data Fig. 2 |. Resolution estimation, map quality and the workflow for processing of the HER2/HER3/NRG1β dataset.
a, Representative micrograph of the HER2/HER3/NRG1β sample on graphene oxide grids, from a dataset with 2035 GO-containing micrographs. The scale bar corresponds to 0.5 μm. b, Example 2D cryo-EM class averages. c, Local resolution estimation from ResMap. d, Gold Standard Fourier Shell Correlation (GSFSC) of the final map used for model building from CryoSPARC2 with a reported resolution of 2.93 Å. e, Directional FSCs calculated by 3DFSC server. Map sphericity was calculated to be 0.927. f, Workflow for processing the HER2/HER3/NRG1β dataset. Blue box indicates model and associated particle stack used for downstream processing. The final model is indicated with a red box. The map in the yellow box represents a slightly different low-occupancy species. The insets show that the HER3 dimerization arm is still poorly resolved in that class.
Extended Data Fig. 3 |
Extended Data Fig. 3 |. Q-score analysis of the cryo-EM maps and a structural comparison of the HER2/HER3/NRG1β heterocomplex with crystal structures of previously reported HER receptor structures.
a, Zoomed-in view of the cryo-EM density and model of WT HER2/HER3 (residues 63–150 of HER3) showing features appropriate for the reported resolution. b, WT HER2/HER3 model colored by estimated per residue Q-score ranging from 0 (red) to 0.75 (blue). The color bar shows corresponding estimated resolution in Å for each Q-score. Expected Q-score for 2.9Å map is 0.604. c, Zoomed-in view of the cryo-EM density and model of HER2 S310F/HER3 (residues 63–150 of HER3) showing features appropriate for the reported resolution. d, HER2-S310F/HER3 model colored by estimated Q-score with the same scale as in b. Expected Q-score for 3.1Å structure is 0.569. e, Overlay of the HER2/HER3/NRG1β heterocomplexes with symmetric structures of EGFR/EGF (PDB ID 3NJP), EGFR/TGFα (PDB ID 1MOX) and HER4/NRG1β (PDB ID 3U7U). f, Overlay of the HER2/HER3/NRG1β heterocomplexes with asymmetric structures of EGFR/EREG (PDB ID 5WB7), doubly liganded dEGFR/SPITZ (PDB ID 3LTF) and singly liganded dEGFR/SPITZ (PDB ID 3LTG). All structures were aligned on HER3. Differences between the heterodimer and the homodimers are primarily appreciated in overlays on the HER2 monomer. The heterodimer more closely resembles asymmetric homodimers than symmetric homodimers but reflects a unique conformation that is not seen in previous structures.
Extended Data Fig. 4 |
Extended Data Fig. 4 |. Comparison of the domain II dimerization interface between HER2/HER3/NRG1β complex domain with crystal structures of previously reported HER receptor homodimers.
a-e, The domain II interfaces of select HER receptor dimers are shown with the number of hydrogen bonds and the total buried surface area between domains I-III indicated below. Domain IV was excluded from this analysis because it is not resolved in all structures. Hydrogen bonds are shown as red dotted lines, highlighting more substantial interfaces for symmetric homodimers (EGFR/EGF (PDB ID 3NJP), HER4/NRG1β (PDB ID 3U7U) than asymmetric dimers (HER2/HER3/NRG1β, EGFR/EREG (PDB ID 5WB7)), with the exception of the mutant HER2-S310F/HER3/NRG1β heterocomplex in which the mutation stabilizes the domain II interface. All interface hydrogen bonds are formed within domain II, except for an additional hydrogen bond in EGFR with domain III which is not shown here and marked (*) in table.
Extended Data Fig. 5 |
Extended Data Fig. 5 |. In-depth structural and functional analysis of the NRG1β binding-site and the HER2/HER3 dimerization interface.
a, Left, HER4 bound to NRG1β (PDB ID 3U7U) with salt-bridge interactions highlighted. Middle, HER3 bound to NRG1β in our structure with salt bridge interactions highlighted. NRG1β engages with HER3 primarily through an extensive interaction network at its C-terminus (total buried surface area: 2,803 Å2) stabilized by salt bridges between R207 (NRG1β) and D112 in HER3 domain I, and R220 (NRG1β) and D371 in HER3 domain III, bringing domains I and III into close proximity. Right, overlay between the two structures shows that the overall orientation of the ligand and some salt-bridge interactions are shared between HER3 and HER4, but overall HER3 forms fewer salt bridges with NRG1β than HER4. b, Structure of HER2 in our HER2/HER3/NRG1β dimer structure is overlayed with the crystal structure of the HER2 extracellular domain bound to trastuzumab Fab (PDB ID 1N8Z), the cryo-EM structure of the HER2 extracellular domain bound to pertuzumab and trastuzumab Fabs (PDB ID 6OGE) and the crystal structure of the rat HER2 extracellular domain (PDB ID 1N8Y). The structures are almost identical with root mean squared deviations (RMSDs) as following: 1.01 Å (1N8Z), 0.74 Å (1N8Y), 0.97 Å (6OGE). Minor conformational changes are observed in the dimerization arm and domain IV. c, Detailed view of the dimerization interface between domains II of HER2 and HER3 in the HER2/HER3/NRG1β structure with all polar contacts between receptors highlighted in the boxes to the left and to the right. d, Calculated buried surface area at the dimerization interface for HER2/HER3/NRG1β complex and the known structures of the dimeric HER extracellular domain complexes. The following structures were used for the analysis: EGFR/EGF (PDB ID 3NJP), EGFR/EREG (PDB ID 5WB7), HER4/NRG1β (PDB ID 3U7U). e, Representative Western Blot analysis of the HER2 and HER3 (wild-type HER3 and HER3 GS-arm) constructs co-transfected in the EXPI293 cells and pulled-down via NRG1β immobilized on FLAG beads. TS – Twin Strep tag (present on both HER2 and HER3). Receptors were detected with the Strep-Tactin® HRP conjugate (anti-TS). For gel source data, see Supplementary Figure 1. f, Quantification of data shown in panel e. Values are presented as mean values +/− SD of mean intensity ratios of HER2 over HER3 for each blot in n=3 independent biological replicates. The HER2/HER3 pulldown ratios are 0.18 +/− 0.06 for HER3-WT and 0.22 +/− 0.07 for HER3-GS-Arm complexes. Significance was determined via unpaired, two-tailed t-test via GraphPad Prism. p=0.5463, t=0.6582, df=4. g, Anti-phospho-HER3 (pHER3, Y1289), anti-HER3 and anti-HER2 Western Blot analysis of lysates from COS7 cells transfected with indicated full-length receptors (wild type or carrying the indicated mutations), serum-starved and stimulated with 10 nM NRG1β for 10 min. HER3-V945R is a negative control due to the presence of mutation in the active kinase dimer interface. For gel source data, see Supplementary Figure 1. h, Quantification of data shown in panel g. Values are presented as mean values +/− SD of pHER3 intensities of the mutant relative to wild-type HER3 for each blot in n=5 independent biological replicates. The mean intensity values are 0.90 +/− 0.19 for the HER3-GS-Arm and 0.13 +/− 0.04 for HER3-V945R relative to the WT with defined values of 1. Significance was determined via unpaired, two-tailed t-test via GraphPad Prism. HER3 GS-arm vs HER3: p=0.2887, t=1.136, df=8, HER3 vs HER3 V945R: p<0.0001, t=43.89, df=8.
Extended Data Fig. 6 |
Extended Data Fig. 6 |. The oncogenic HER2-S310F/Y mutations increase the yields of the HER2/HER3/NRG1β complex purification.
a, Representative Western Blot analysis of the HER2 (wild type, S310F or S310F mutant) and HER3 constructs co-transfected in the EXPI293 cells, and pulled-down via NRG1β immobilized on FLAG beads. TS – Twin Strep tag (present on both HER2 and HER3). Receptors were detected with the Strep-Tactin® HRP conjugate (anti-TS). For gel source data, see Supplementary Figure 1. b, Densitometry analysis of blots for data shown in panel a. Values are presented as mean values +/− SD of mean intensity ratios of HER2 over HER3 for each blot in n=3 independent biological replicates. The HER2/HER3 pulldown ratios are 0.09 +/− 0.04 for HER2-WT, 0.20 +/− 0.06 for HER2-S310F and 0.35 +/− 0.09 for HER2-S310Y complexes. Significance was determined via unpaired, two-tailed t-test via GraphPad Prism. WT vs S310F: p=0.0605, t=2.592, df=4. WT vs. S310Y: p=0.0107, t=4.516, df=4. c, Overlay of representative size exclusion chromatogram profiles from a Superose6 10/300 Increase column (GE Healthcare) of WT and oncogenic HER2-S310F heterocomplexes. Heterodimer peaks are denoted by asterisks. d, Cartoon representation of the cryo-EM structure of HER2-S310F/HER3/NRG1β complex overlayed on HER2/HER3/NRG1β. The HER2-S310F mutation is shown in red.
Extended Data Fig. 7 |
Extended Data Fig. 7 |. Resolution estimation, map quality and the workflow for processing of the HER2-S310F/HER3/NRG1β and HER2-S310F/HER3/NRG1β/trastuzumab datasets.
a, Cryo-EM map colored by local resolution as estimated from ResMap. b, Gold Standard Fourier Shell Correlation (GSFSC) of the final map used for model building from CryoSPARC2 with a reported resolution of 3.10 Å. c, Directional FSCs calculated by 3DFSC server. Map sphericity was calculated to be 0.949.d, Workflow for processing the HER2/HER3/NRG1β/trastuzumab dataset. The final model is indicated with a red box. e, Cryo-EM map colored by local resolution as estimated from ResMap. f, Gold Standard Fourier Shell Correlation (GSFSC) of the final map used for model building from CryoSPARC2 with a reported resolution of 3.45Å. g, Directional FSCs calculated by 3DFSC server. Map sphericity was calculated to be 0.941.
Extended Data Fig. 8 |
Extended Data Fig. 8 |. Functional and structural analysis of interactions between the therapeutic Fabs and HER receptors in the HER2/HER3/NRG1β complex.
a, Overlay of the HER2/trastuzumab structure (PDB ID 6OGE) with the HER2-S310F/HER3/NRG1β structure reveals a steric clash between the Fab light chain constant domain and HER3 domain III. b, Left, overlay of the trastuzumab Fab variable domains in the HER2/trastuzumab structure (PDB ID 1N8Z) with the trastuzumab Fab in the HER2/HER3/NRG1β complex (HER2 domain IV in blue, trastuzumab Fab variable domains in magenta). The structures were aligned on HER2 domains I-III. Right, the HER2 domain IV bound to Fab variable domain from each structure was overlayed (RMSD: 1.569 Å) demonstrating that a Fab-binding epitope on HER2 is the same. Trastuzumab therefore avoids a steric clash with HER3 by inducing a rigid body rotation of HER2 domain IV relative to HER3. c, Overlay of the HER2/pertuzumab structure (PDB: 6OGE) with the HER2-S310F/HER3/NRG1β structure reveals a steric clash between the Fab variable domains, the HER3 dimerization arm, and HER3 domain II. d, Anti-phospho-HER3 (pHER3, Y1289), anti-HER3 and anti-HER2 Western Blot analysis of lysates from COS7 cells transfected with indicated full-length wild-type or mutant receptors. Cells were serum-starved, pre-incubated with pertuzumab or trastuzumab for 1h, as indicated, and then stimulated with 10 nM NRG1β. HER3-EGQR is HER3-E928G/Q809R. Representative Western Blot is shown, n=3. For gel source data, see Supplementary Figure 1. e, D31 of the pertuzumab variable light chain forms a polar contact with HER2 S310. f, HER2-S310F removes the polar contact with D31 and introduces a steric clash with T30 of the pertuzumab variable light chain. The predicted net effect of the oncogenic HER2-S310F mutation would be a decrease in pertuzumab affinity for HER2 (PDB ID 6OGE).
Fig. 1 |
Fig. 1 |. Overall structure of the HER2/HER3/NRG1β extracellular domain dimer complex.
a, Cartoon schematic of the conformational changes that the inactive HER2 and HER3 monomers are predicted to undergo during heterodimerization in the presence of neuregulin (NRG) 1β. PM is plasma membrane. b, Cryo-EM map and the resulting structural model of the HER2/HER3/NRG1β extracellular domain complex, with HER2 shown in light blue, HER3 in gold and NRG1β in teal. Extracellular domains I-IV are marked on the structures. c, Zoomed-in view of the dimerization interface to illustrate lack of density for the HER3 dimerization arm. An outline of the expected location of the HER3 dimerization arm based on previous extracellular domain structures is shown as a dotted path in the top view.
Fig. 2 |
Fig. 2 |. Analysis of liganded HER receptor states reveals an allosteric mechanism of dimerization arm engagement.
a, Left top panel - closed dimerization arm-binding pocket in HER3 engages the HER2 dimerization arm in the HER2/HER3/NRG1β structure. Right top panel - an open dimerization arm-binding pocket in the ligand-free HER2 does not engage HER3 dimerization arm in the same structure. Left bottom panel – a partially closed dimerization arm-binding pocket in the monomer in the EGFR/EREG structure in which the ligand (EREG) is partially-wedged (PDB ID 5WB7). Right bottom panel – closed binding pocket in EGFR engages a fully-wedged EGF ligand in the EGFR/EGF dimer structure (PDB ID 3NJP). Residues within 4Å of the dimerization arm are shown in red. b, Top view of dimerization arms in the asymmetrically ligand-wedged EGFR/EREG and symmetrically ligand-wedged EGFR/EGF crystal structures indicating different values of B-factors (PDB IDs 5WB7 and 3NJP, respectively). c, Detailed view of domains I-III in the EGFR/EREG or EGFR/EGF crystal structures aligned on HER2 domain I in the HER2/HER3/NRG1β structure. The EGFR monomer in which the EREG ligand is only partially-wedged is shown.
Fig. 3 |
Fig. 3 |. HER2 oncogenic mutation S310F stabilizes the dimerization arm of HER3.
a, Cryo-EM map and model zoomed in on domains II depict a resolved HER3 dimerization arm in the HER2-S310F/HER3/NRG1β complex. Inset shows a top-down view of the HER2 and HER3 dimerization arms. The HER2-S310F mutation is shown in red. b, Top panel, HER2-S310F monomer, shown in surface representation, pins the HER3 dimerization arm, shown as cartoon, in the HER2 dimerization arm-binding pocket despite its inability to close in the ligand-less HER2. Bottom left panel, HER2-S310F forms a π-π interaction with HER3 Y265 that stabilizes the dimerization arm. Bottom right panel, polar contacts (dotted lines) between HER3 Y265 and the backbone residues of HER2 - F291 and C311.
Fig. 4 |
Fig. 4 |. The HER2/HER3/NRG1β structure accommodates trastuzumab binding.
a, Representative Western blot of the purified HER2/HER3 heterodimer pulldowns in the presence of a two-fold molar excess of pertuzumab and trastuzumab FLAG-tagged Fabs. TS – Twin Strep tag (present on both HER2 and HER3) was detected with Strep-Tactin® HRP conjugate. The blot is representative of n=4 independent biological replicates. For gel source data, see Supplementary Figure 1. b, 5Å lowpass filtered density of the HER2-S310F/HER3/NRG1β heterocomplex bound to trastuzumab Fab. c, Ribbon overlay of the HER2-S310F/HER3/NRG1β heterocomplex with (multi-color) and without (light grey) trastuzumab Fab. The Fab pushes HER3 back relative to HER2 (curved arrow) and spreads domains IV further apart (double-headed arrow).

References

    1. Sliwkowski MX et al. Coexpression of erbB2 and erbB3 proteins reconstitutes a high affinity receptor for heregulin. J Biol Chem 269, 14661–14665 (1994). - PubMed
    1. Wallasch C et al. Heregulin-dependent regulation of HER2/neu oncogenic signaling by heterodimerization with HER3. The EMBO Journal 14, 4267–4275 (1995). - PMC - PubMed
    1. Moasser MM The oncogene HER2: its signaling and transforming functions and its role in human cancer pathogenesis. Oncogene 26, 6469–6487, doi:10.1038/sj.onc.1210477 (2007). - DOI - PMC - PubMed
    1. Sierke SL, Cheng K, Kim H & Koland JG Biochemical characterization of the protein tyrosine kianse domain of the ErbB3 (HER3) receptor protein. Biochem J 322, 757–763 (1997). - PMC - PubMed
    1. Jura N, Shan Y, Cao X, Shaw DE & Kuriyan J Structural analysis of the catalytically inactive kinase domain of the human EGF receptor 3. Proc Natl Acad Sci U S A 106, 21608–21613, doi:10.1073/pnas.0912101106 (2009). - DOI - PMC - PubMed

Publication types

MeSH terms