. 2021 Nov;28(11):879-888.
doi: 10.1038/s41594-021-00674-7. Epub 2021 Nov 10.

GPCR activation mechanisms across classes and macro/microscales

Affiliations

GPCR activation mechanisms across classes and macro/microscales

Alexander S Hauser et al. Nat Struct Mol Biol. 2021 Nov.

Abstract

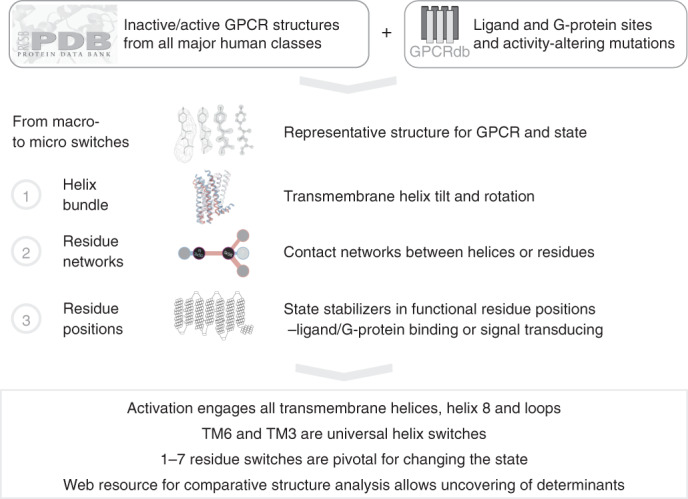
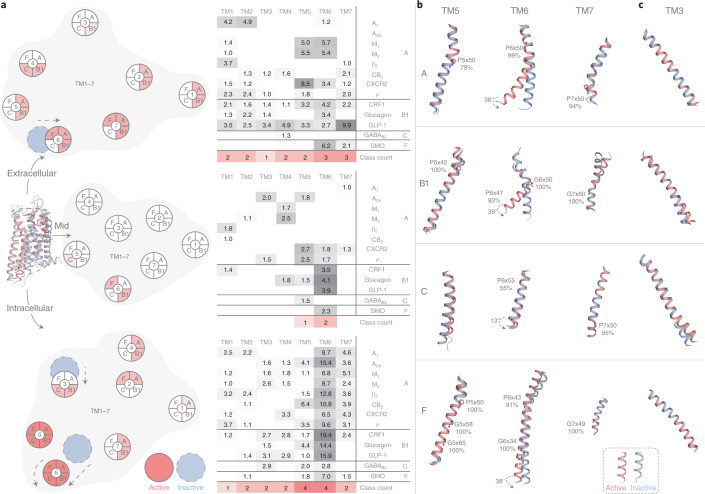
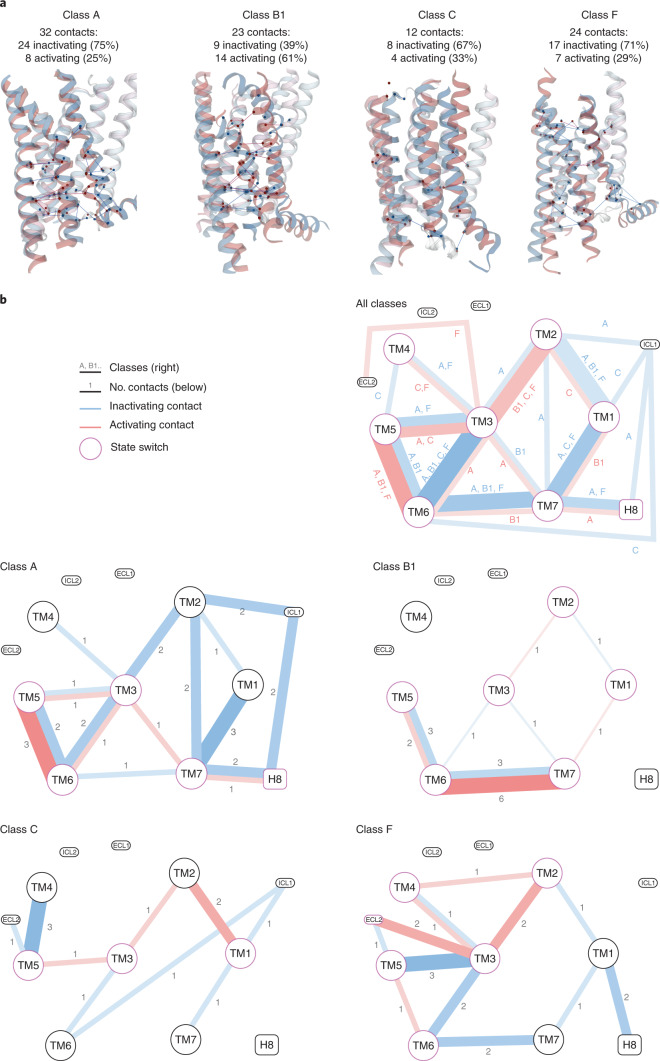
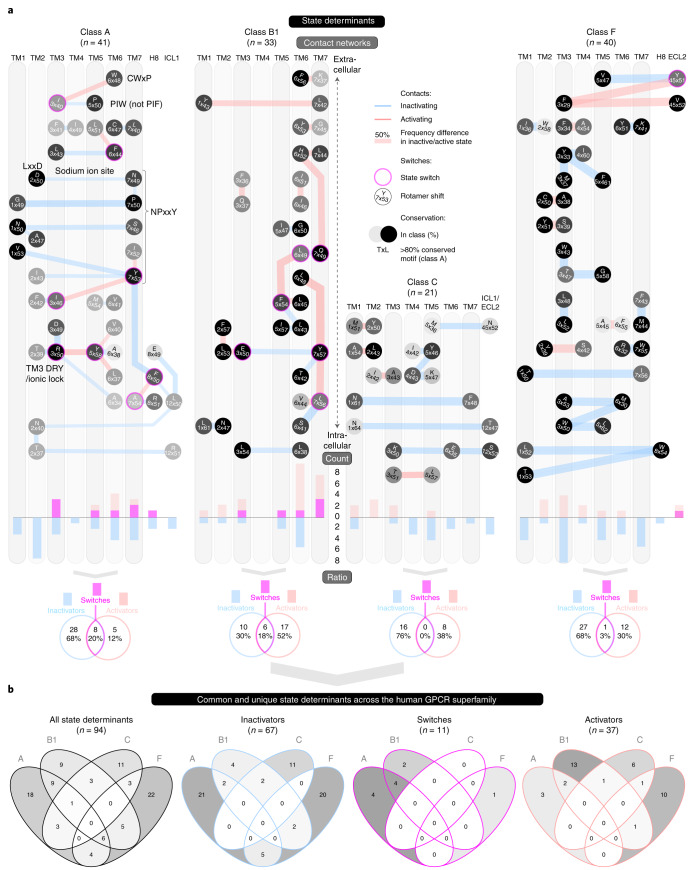
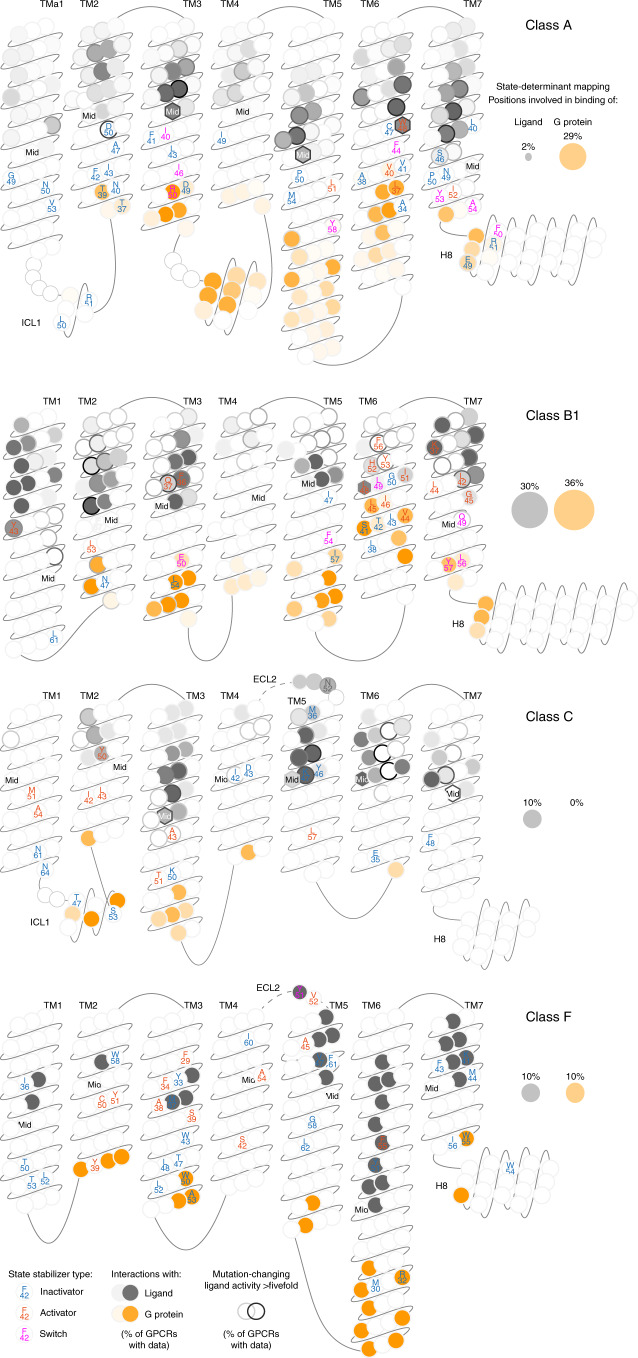
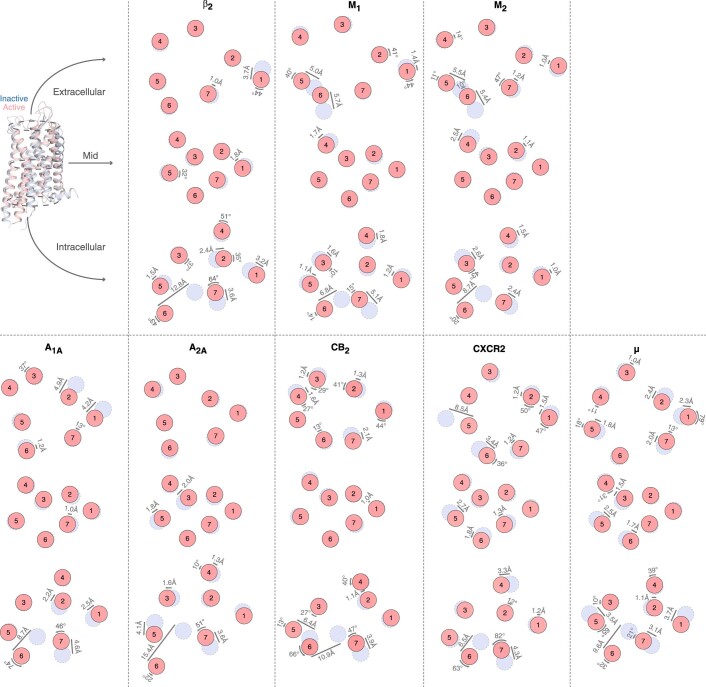
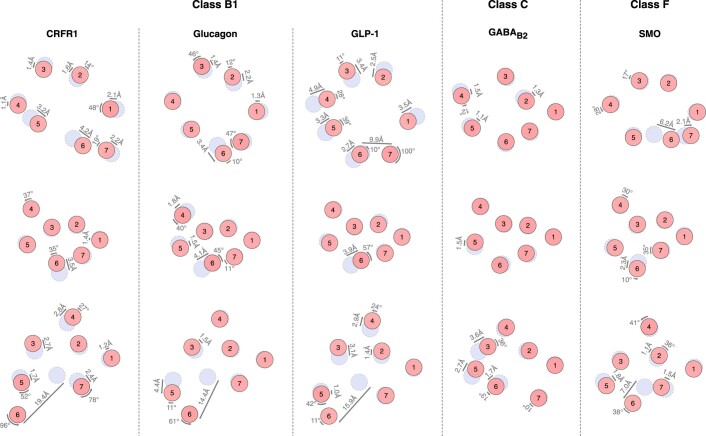
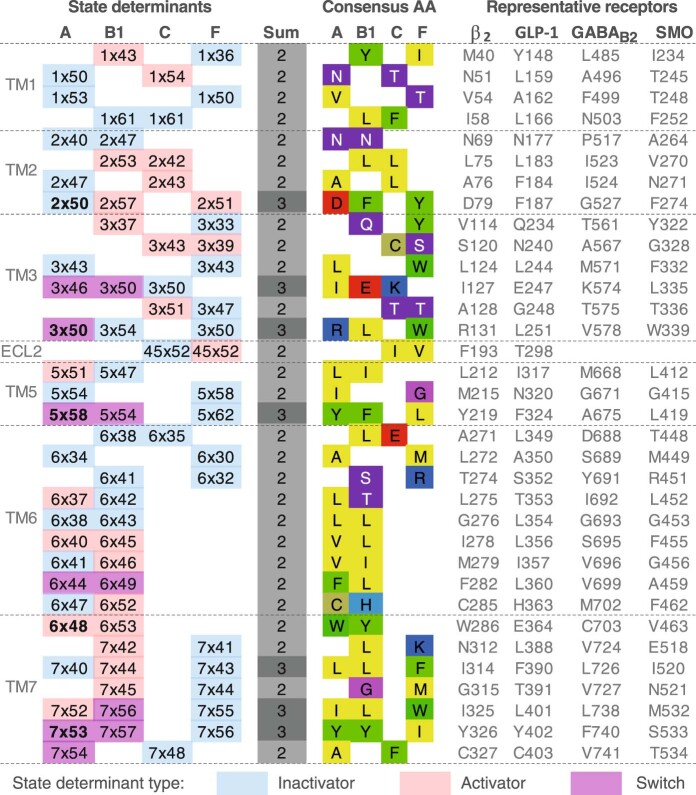
Two-thirds of human hormones and one-third of clinical drugs activate ~350 G-protein-coupled receptors (GPCR) belonging to four classes: A, B1, C and F. Whereas a model of activation has been described for class A, very little is known about the activation of the other classes, which differ by being activated by endogenous ligands bound mainly or entirely extracellularly. Here we show that, although they use the same structural scaffold and share several 'helix macroswitches', the GPCR classes differ in their 'residue microswitch' positions and contacts. We present molecular mechanistic maps of activation for each GPCR class and methods for contact analysis applicable for any functional determinants. This provides a superfamily residue-level rationale for conformational selection and allosteric communication by ligands and G proteins, laying the foundation for receptor-function studies and drugs with the desired modality.


Conflict of interest statement

M.B. is the president of Domain Therapeutics scientific advisory board. D.B.V. is a founder and a director of Z7 Biotech Ltd. After the completion of this study, C.M. moved to become an employee of Novozymes A/S. The other authors declare no competing interests.

Figures

Fig. 1
Fig. 1. Analysis pipeline for elucidation of GPCR activation mechanisms.
Pipeline for analysis of universal and distinct activation of macro/microswitches spanning helix repacking to side chain rotation and the connection to ligand-binding, G-protein coupling and signal transduction sites (Methods).
Fig. 2
Fig. 2. Transmembrane helix movement upon activation, and universal TM3 and TM6 helix ‘macroswitches’.
a, Movements (Å) over 1.0 Å at the extracellular end, membrane mid (determined using ref. ) and intracellular end of the transmembrane helices TM1–7 upon comparison of all available receptor inactive- and active-state structure pairs (Supplementary Table 1). Red intensity denotes the number of classes with a consensus. b, Movement and conserved hinges of TM6 and the adjacent TM5 and TM7. c, TM3 cytosolic tilt and overall rotation. b,c, GPCR class-representative inactive/active receptor structure pairs: A: β2 (refs. ,), B1: GLP-1 (refs. ,), C: GABAB2 and F: Smoothened, receptors. Proline and glycine residues that increase helix plasticity are shown, along with their percentage conservation in the GPCR class.
Fig. 3
Fig. 3. GPCRs stabilize inactive and active states by rerouting contacts between TM1–7, H8, ICL1 and ECL2.
a, State-specific residue-residue contacts in each GPCR class visualized as lines within representative inactive/active receptor structure pairs (same as in Fig. 2b,c). Numbers indicate the total, inactivating and activating contacts in each GPCR class. b, Contact networks between the seven GPCR transmembrane helices, TM1–7, and the first intracellular (ICL1) and second extracellular (ECL2) loops (intrasegment contacts not shown). Line thickness represents the number of classes (top-most) or contact frequency differences between the inactive and active states. Line color indicates inactivating (blue) and activating (red) contacts. Receptor segments with a magenta border are ‘switches’, that is, having contacts across both states. Contacts are identified on the basis of a higher frequency (%) in inactive than in active-state receptors. a,b, The frequency difference threshold was set according to the structural coverage in each GPCR class (threshold: no. members, inactive/active state templates): A: 40% (285, 33/14), B1: 67% (15, 3/10), C: 75% (22, 4/2) and F: 100% (11, 2/2). To ensure that the identified determinants are applicable throughout each class, we also applied a sequence conservation cut-off requiring at least 30% of all its receptors to contain one of the amino acid pairs observed to form the given state-specific contact. Contact definitions are explained in the settings menu of the online ‘Comparative structure analysis’ tool (https://review.gpcrdb.org/structure_comparison/comparative_analysis).
Fig. 4
Fig. 4. State-stabilizing contact maps and differences at the residue-level ‘microswitches’.
a, Contact networks visualize the wiring of state determinants from the extracellular (top) to intracellular (bottom) sides. Contact frequency differences between the inactive and active states are shown as varied line thickness, and residue rotamers as rotation of the consensus amino acid in the analyzed structure and its generic residue number. Two-way Venn diagrams depict the number and percentages of inactivator (blue), activator (red) and switch (magenta) state-determinant positions. Bar diagrams show their distribution across the TM helices, H8 and loops. b, Comparison of common and unique state-determinant positions across all investigated classes.
Fig. 5
Fig. 5. Mutations of predicted state-changing residue positions reduce potency.
a, Effect upon alanine mutation of predicted state-changing and nonstate-changing residues, respectively, on epinephrine-induced β2-adrenoceptor activation of Gs and G15 measured by BRET-based biosensors. Predicted state-changing residues show a significantly higher reduction in potency (left), but not in efficacy (E, right), for both Gs and G15 relative to wild type. Statistical significance has been assessed by a two-sided Wilcoxon rank-sum test (n = 6 for each category, individual data points in Supplementary Table 2). Box-and-whiskers plots are presented with interquartile box bounds (25% and 75%); middle line represents the median; x represents the mean; whiskers extend to the minimum and maximum value. b, Structural mapping of predicted state-changing (orange) and nonstate-changing mutations (gray) on the inactive carazolol-bound inactive β2-adrenoceptor structure (PDB 2RH1). Cα are shown as spheres and Cα-Cβ bonds are displayed as sticks. Five out of six state-changing mutations cluster tightly in the transduction pathway between the ligand and G-protein pockets.
Fig. 6
Fig. 6. Residue positions stabilizing an inactive and/or active receptor state.
GPCR snakeplots mapping the residue positions that form distinct contacts between state determinants classified as inactivators (blue), activators (red) and switches (magenta). Residues are denoted with the consensus amino acid of the investigated receptor structures (Supplementary Table 1) and their generic residue number. Filled positions map ligand- (gray) and G-protein (orange) interaction frequency among all GPCR structures in the given class that have such data (Supplementary Data 2). Allosteric ligand-interacting positions outside of the upper part of the transmembrane helix domain and ECL2 (the orthosteric binding pocket in classes A, B1 and F) are omitted. Border grayscale denotes the frequency of mutations changing the ligand affinity or activity over fivefold. The label ‘Mid’ within hexagon-shaped positions denotes the membrane mid, above and below which the ligand positions are subdivided into ‘upper 7Tm and ECL2’ or ‘other’).
Extended Data Fig. 1
Extended Data Fig. 1. TM1-7 movement of class A receptor pairs upon activation.
Transmembrane helix movement at the extracellular face, membrane mid and intracellular face based on comparison of representative inactive and active state structure pairs of class A GPCRs (Extended Data Table 1).
Extended Data Fig. 2
Extended Data Fig. 2. TM1-7 movement of class B1, C and F receptor pairs upon activation.
Transmembrane helix movement at the extracellular face, membrane mid and intracellular face based on comparison of representative inactive and active state structure pairs of class B1, C and F GPCRs (Extended Data Table 1).
Extended Data Fig. 3
Extended Data Fig. 3. State determinants conserved across classes.
Heatmap of state determinants shared by at least two GPCR classes along with their consensus amino acid and residues in representative receptors. Each row contains corresponding positions denoted with the generic residue numbers in each class. Key class A state determinants are shown in bold.

References

    1. Kolakowski LF., Jr. GCRDb: a G-protein-coupled receptor database. Recept. Channels. 1994;2:1–7. - PubMed
    1. Attwood TK, Findlay JB. Design of a discriminating fingerprint for G-protein-coupled receptors. Protein Eng. 1993;6:167–176. - PubMed
    1. Attwood TK, Findlay JB. Fingerprinting G-protein-coupled receptors. Protein Eng. 1994;7:195–203. - PubMed
    1. Fredriksson R, Lagerstrom MC, Lundin LG, Schioth HB. The G-protein-coupled receptors in the human genome form five main families. Phylogenetic analysis, paralogon groups, and fingerprints. Mol. Pharmacol. 2003;63:1256–1272. - PubMed
    1. Nordstrom KJ, Sallman Almen M, Edstam MM, Fredriksson R, Schioth HB. Independent HHsearch, Needleman–Wunsch-based, and motif analyses reveal the overall hierarchy for most of the G protein-coupled receptor families. Mol. Biol. Evol. 2011;28:2471–2480. - PubMed

Publication types

MeSH terms

Substances