. 2021 Oct 25:12:731025.
doi: 10.3389/fphys.2021.731025. eCollection 2021.

Cellular Size, Gap Junctions, and Sodium Channel Properties Govern Developmental Changes in Cardiac Conduction

Affiliations

Cellular Size, Gap Junctions, and Sodium Channel Properties Govern Developmental Changes in Cardiac Conduction

Madison B Nowak et al. Front Physiol. .

Abstract

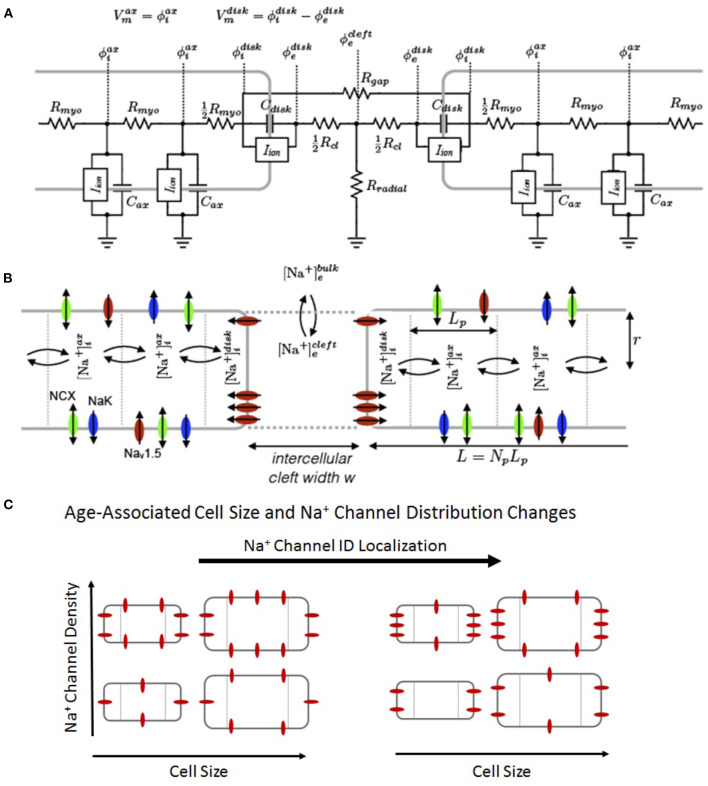
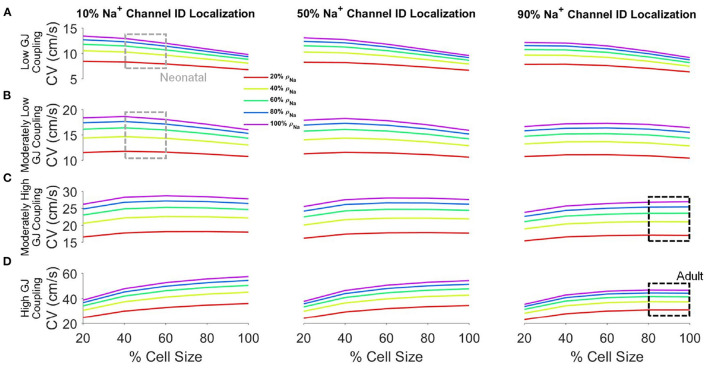
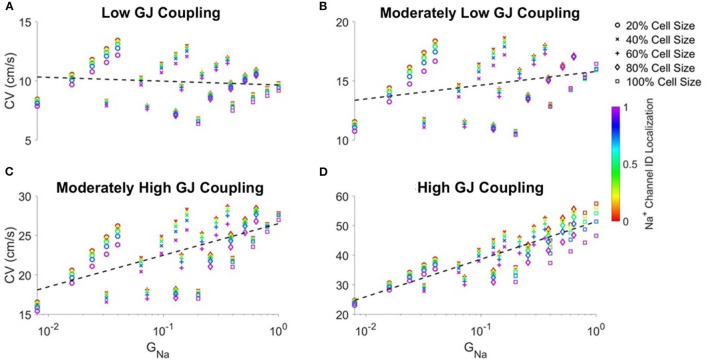
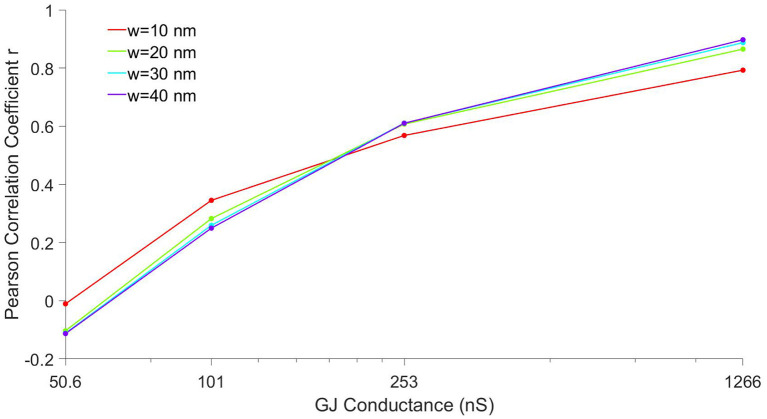
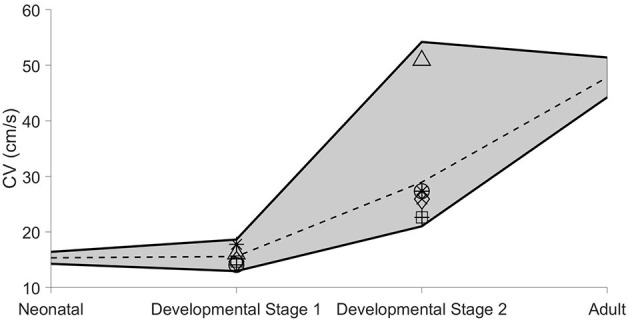
Electrical conduction in cardiac ventricular tissue is regulated via sodium (Na+) channels and gap junctions (GJs). We and others have recently shown that Na+channels preferentially localize at the site of cell-cell junctions, the intercalated disc (ID), in adult cardiac tissue, facilitating coupling via the formation of intercellular Na+nanodomains, also termed ephaptic coupling (EpC). Several properties governing EpC vary with age, including Na+channel and GJ expression and distribution and cell size. Prior work has shown that neonatal cardiomyocytes have immature IDs with Na+channels and GJs diffusively distributed throughout the sarcolemma, while adult cells have mature IDs with preferentially localized Na+channels and GJs. In this study, we perform an in silico investigation of key age-dependent properties to determine developmental regulation of cardiac conduction. Simulations predict that conduction velocity (CV) biphasically depends on cell size, depending on the strength of GJ coupling. Total cell Na+channel conductance is predictive of CV in cardiac tissue with high GJ coupling, but not correlated with CV for low GJ coupling. We find that ephaptic effects are greatest for larger cells with low GJ coupling typically associated with intermediate developmental stages. Finally, simulations illustrate how variability in cellular properties during different developmental stages can result in a range of possible CV values, with a narrow range for both neonatal and adult myocardium but a much wider range for an intermediate developmental stage. Thus, we find that developmental changes predict associated changes in cardiac conduction.

Keywords: cardiac conduction; cardiac electrophysiology; computational models; development; intercalated disc.


Conflict of interest statement

The authors declare that the research was conducted in the absence of any commercial or financial relationships that could be construed as a potential conflict of interest.

Figures

Figure 1
Figure 1
Schematic of the computational model. (A) Electric circuit representation of coupled myocytes. Intracellular nodes are coupled via a myoplasmic resistance (Rmyo). End nodes are coupled via a gap junctional resistance (Rgap). Extracellular potentials at the disc and intercellular cleft (ϕedisc and ϕecleft, respectively) are governed by a T-shaped network of two axial resistances in the intercellular cleft (Rcl) and one radial resistance (Rradial). (B) Na+concentration in diffusively coupled compartments, including intracellular Na+in the axial and disc compartments ([Na+]iax and [Na+]idisc) and extracellular Na+in the intercellular cleft and bulk spaces ([Na+]ecleft and [Na+]ebulk). (C) Representation of age-associated change in model parameters, including changes in cell size (S), Na+ channel density (ρNa), and Na+channel ID localization (IDNa).
Figure 2
Figure 2
Conduction velocity (CV) depends on cell size and GJ coupling. (A) Transmembrane voltage of the post-junctional node of the ID (Vm), (B) Na+current at the pre-junctional node of the ID (INapre), (C) Na+current at the post-junctional node of the ID (INapost), (D) GJ current at the ID (IGJ), and (E) cleft voltage (Vcleft) are shown in tissue for low (50.6 nS), moderately low (101 nS), moderately high (253 nS), and high (1,266 nS) GJ coupling. For clarity, traces are shown for the same spatial point of 1.2 mm from the pacing site. Parameters: IDNa= 50%, ρNa= 100%, w = 20nm.
Figure 3
Figure 3
Conduction velocity (CV) depends on key cellular and tissue properties. CV is shown as a function of cell size for different values of Na+channel densities (ρNa) for low (A), moderately low (B), moderately high (C), and high (D) GJ coupling and 10% (left), 50% (middle), and 90% (right) Na+channel ID localization (IDNa). Parameters: Cleft width w = 20nm. Parameter regimes associated with neonatal (gray boxes) and adult (black boxes) tissue are highlighted.
Figure 4
Figure 4
Correlation between conduction velocity (CV) and total cell Na+conductance (GNa) increases as gap junctional coupling increases. Conduction velocity (CV) is shown as a function of GNa for different cell sizes and Na+ channel ID localization for (A) low, (B) moderately low, (C) moderately high, and (D) high GJ coupling. Pearson correlation coefficients r for low (r = −0.103), moderately low (r = 0.283), moderately high (r = 0.607), high (r = 0.865) GJ coupling. Parameters: Cleft width w = 20nm.
Figure 5
Figure 5
Correlation between conduction velocity (CV) and total cell Na+conductance depends on gap junctional coupling. The Pearson correlation coefficient r between CV and total cell Na+conductance (GNa) is shown as a function of GJ coupling conductance, for four different cleft width w values.
Figure 6
Figure 6
Age-associated ranges of conduction velocity (CV). The range of CV values (see text for details) are shown as functions of age-dependent progression. Parameter ranges and markers for each stage are shown in Supplementary Table 2. The dashed line shown for each stage represents the average CV value over all conditions within the specified parameter ranges. Cleft width w = 20nm.

References

    1. Agullo-Pascual E., Lin X., Leo-Macias A., Zhang M., Liang F.-X., Li Z., et al. (2014). Super-resolution imaging reveals that loss of the c-terminus of connexin43 limits microtubule plus-end capture and nav1. 5 localization at the intercalated disc. Cardiovasc. Res. 104, 371–381. 10.1093/cvr/cvu195 - DOI - PMC - PubMed
    1. Akar F. G., Spragg D. D., Tunin R. S., Kass D. A., Tomaselli G. F. (2004). Mechanisms underlying conduction slowing and arrhythmogenesis in nonischemic dilated cardiomyopathy. Circ. Res. 95, 717–725. 10.1161/01.RES.0000144125.61927.1c - DOI - PubMed
    1. Angst B. D., Khan L. U., Severs N. J., Whitely K., Rothery S., Thompson R. P., et al. (1997). Dissociated spatial patterning of gap junctions and cell adhesion junctions during postnatal differentiation of ventricular myocardium. Circ. Res. 80, 88–94. 10.1161/01.RES.80.1.88 - DOI - PubMed
    1. Beaufort-Krol G. C., van den Berg M. P., Wilde A. A., van Tintelen J. P., Viersma J. W., Bezzina C. R., et al. (2005). Developmental aspects of long QT syndrome type 3 and Brugada syndrome on the basis of a single SCN5A mutation in childhood. J. Am. Coll. Cardiol. 46, 331–337. 10.1016/j.jacc.2005.03.066 - DOI - PubMed
    1. Cai B., Mu X., Gong D., Jiang S., Li J., Meng Q., et al. (2011). Difference of sodium currents between pediatric and adult human atrial myocytes: evidence for developmental changes of sodium channels. Int. J. Biol. Sci. 7:708. 10.7150/ijbs.7.708 - DOI - PMC - PubMed