. 2021 Oct 18;12(42):14241-14253.
doi: 10.1039/d1sc04861a. eCollection 2021 Nov 3.

Plasma-assisted oxidation of Cu(100) and Cu(111)

Affiliations

Plasma-assisted oxidation of Cu(100) and Cu(111)

Sebastian Kunze et al. Chem Sci. .

Abstract

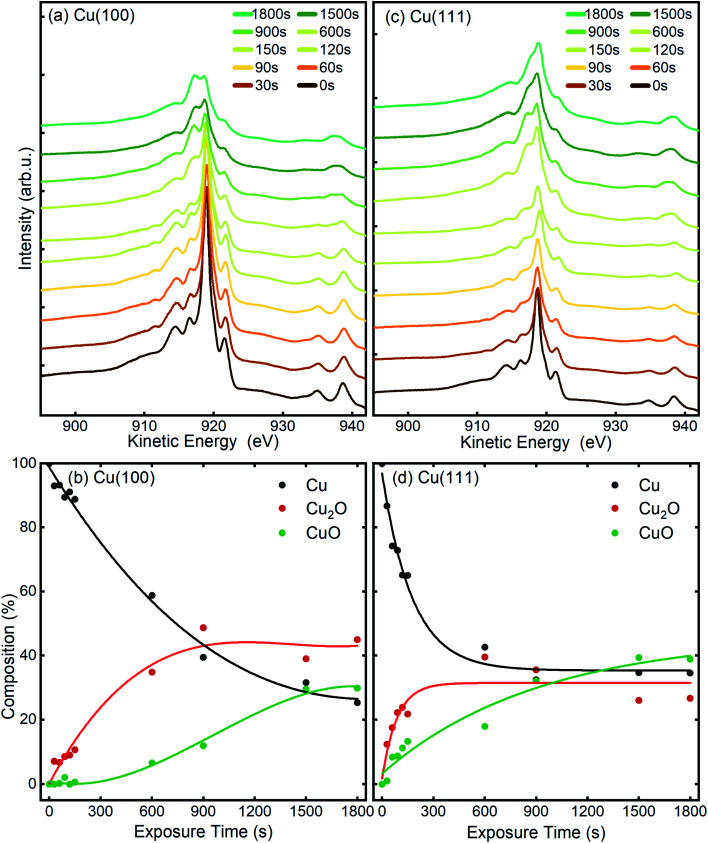
Oxidized copper surfaces have attracted significant attention in recent years due to their unique catalytic properties, including their enhanced hydrocarbon selectivity during the electrochemical reduction of CO2. Although oxygen plasma has been used to create highly active copper oxide electrodes for CO2RR, how such treatment alters the copper surface is still poorly understood. Here, we study the oxidation of Cu(100) and Cu(111) surfaces by sequential exposure to a low-pressure oxygen plasma at room temperature. We used scanning tunnelling microscopy (STM), low energy electron microscopy (LEEM), X-ray photoelectron spectroscopy (XPS), near edge X-ray absorption fine structure spectroscopy (NEXAFS) and low energy electron diffraction (LEED) for the comprehensive characterization of the resulting oxide films. O2-plasma exposure initially induces the growth of 3-dimensional oxide islands surrounded by an O-covered Cu surface. With ongoing plasma exposure, the islands coalesce and form a closed oxide film. Utilizing spectroscopy, we traced the evolution of metallic Cu, Cu2O and CuO species upon oxygen plasma exposure and found a dependence of the surface structure and chemical state on the substrate's orientation. On Cu(100) the oxide islands grow with a lower rate than on the (111) surface. Furthermore, while on Cu(100) only Cu2O is formed during the initial growth phase, both Cu2O and CuO species are simultaneously generated on Cu(111). Finally, prolonged oxygen plasma exposure results in a sandwiched film structure with CuO at the surface and Cu2O at the interface to the metallic support. A stable CuO(111) surface orientation is identified in both cases, aligned to the Cu(111) support, but with two coexisting rotational domains on Cu(100). These findings illustrate the possibility of tailoring the oxidation state, structure and morphology of metallic surfaces for a wide range of applications through oxygen plasma treatments.


Conflict of interest statement

There are no conflicts to declare.

Figures

Fig. 1
Fig. 1. STM images of the clean (0 s) Cu(100) (a–d) and Cu(111) (e–h) surfaces and those after the initial oxide growth following the exposure to an O2-plasma at RT, 3 × 10⁻⁵ mbar, for the times indicated. The lateral sizes of all images are 50 nm × 50 nm. The height scales are cut off at 1.2 nm (top row) and 2.3 nm (bottom row) to equalize each tile. Imaging parameters for (a–d): U = −0.6 V to −1.5 V, It = 115–222 pA. Imaging parameters for (e–h): U = −1.5 V, It = 155–289 pA.
Fig. 2
Fig. 2. STM images of the (a, b) Cu(100) and (c, d) Cu(111) surfaces after 30 s plasma exposure at RT, 3 × 10⁻⁵ mbar. (a) Overview of Cu(100). (b) Area marked with the white rectangle in (a). Imaging parameters U = −0.6 V to −0.9 V, It = 155 pA. (c) Overview of Cu(111) and (d) zoom on the area around the island marked with the white rectangle in (c). Imaging parameters: U = −0.9 V, It = 115 pA. Green and white markers highlight key features of the surface morphology.
Fig. 3
Fig. 3. STM images of the (a) Cu(100) and (b) Cu(111) surface after 120 s plasma exposure at 3 × 10⁻⁵ mbar O2. In (a), marked with green shapes are key features discussed in the text. Imaging parameters: (a) U = −0.9 V, It = 155 pA (b) U = −1.5 V, It = 115 pA.
Fig. 4
Fig. 4. Profiles of line scans on the islands shown in Fig. 2 and 3 for 30 s and 120 s plasma exposure at 3 × 10⁻⁵ mbar O2. In (a) and (b), Cu(100). In (c) and (d), Cu(111). The insets show the position of the line scans corresponding to the graphs. The baselines (dotted) used for the determination of the apparent heights at the positions marked with arrows are also shown.
Fig. 5
Fig. 5. LEEM images recorded before and after 30 s of O2 plasma treatment of the Cu(100) and Cu(111) surfaces, top and bottom row, respectively. (a) Clean Cu(100), electron energy E = 20 eV; (b) Cu(100) after plasma treatment, E = 2.3 eV; (c) clean Cu(111), E = 20 eV; (d) Cu(111) after plasma treatment, E = 2.4 eV. The O2 pressure during the plasma exposure was 4 × 10⁻⁴ mbar. All images were taken with the same magnification shown in (a). Note that the images do not represent the same local area on the sample.
Fig. 6
Fig. 6. LEED images acquired on (a) Cu(100) and (b) Cu(111) after different exposures to in situ O2 plasma treatments, starting from the clean crystals (left), after 10 s, 180 s and finally after 1800 s of total oxidation time (right) performed in 4 × 10⁻⁴ mbar O2. The kinetic energy is 42 eV in all LEED patterns. The dashed lines represent the unit cells of the Cu crystals (in red), the c(2 × 2) reconstruction on Cu(100) (yellow square), unit cells of the two rotational domains on Cu(100) (green and purple, on top), respectively, quasi (2 × 2) reconstruction and unit cell of Cu2O(111) (green, at the bottom). Figures (c) and (d) present intensity profiles extracted from the LEED patterns in (a) and (b) along the directions marked by white dashed lines in the 0 s images. The vertical dashed lines mark the theoretical predicted positions of the main CuO structure and the (2 × 2) reconstruction peaks. Additional blue dotted lines in (d) mark the position of an extra spot appearing at ±2.587 Å−1.
Fig. 7
Fig. 7. Cu LMM AES spectra measured before and after different in situ O2-plasma exposures at 3 × 10⁻⁵ mbar of (a), (b) Cu(100) and (c), (d) Cu(111) single crystal surfaces. The content of the different Cu species was determined by fitting and deconvolution of the Cu LMM signal (b and d). The fitted components are shown in Fig. S4 and Table S1. The connecting lines are meant as guides for the eye.
Fig. 8
Fig. 8. NEXAFS after in situ oxygen plasma treatment of Cu(100) and Cu(111) at 4 × 10⁻⁴ mbar. (a and c) Cu L-edge NEXAFS data at different doses. (b and d) The analysis displays the content of metallic Cu, Cu2O and CuO versus oxygen plasma treatment time.
Fig. 9
Fig. 9. Oxide film growth on Cu(100) (a–c) and on Cu(111) (d–f) by oxygen plasma treatment at 4 × 10⁻⁴ mbar. (a) and (d) Raw data and fitting of the NEXAFS composition using a damping model. (b and e) Schematic of the oxidation model showing the initial metallic copper surface, the intermediate state with a complete Cu2O film on the Cu(100) crystal and a mixture of Cu2O and CuO for the Cu(111) surface. As a final state the CuO film overgrows the Cu2O film. Panels (c and f) exhibit the sample depth profile over the plasma exposure time using a damping model. After 30 s the Cu2O film keeps a constant thickness and is overgrown by the CuO film, whereas the growth rate is damped over dosage.

References

    1. Mittiga A. Salza E. Sarto F. Tucci M. Vasanthi R. Appl. Phys. Lett. 2006;88:163502. doi: 10.1063/1.2194315. - DOI
    1. Olsen L. C. Addis F. W. Miller W. Sol. Cells. 1982;7:247–279. doi: 10.1016/0379-6787(82)90050-3. - DOI
    1. Reddy N. L. Emin S. Kumari V. D. Muthukonda Venkatakrishnan S. Ind. Eng. Chem. Res. 2018;57:568–577. doi: 10.1021/acs.iecr.7b03785. - DOI
    1. Zhang Y. Deng B. Zhang T. Gao D. Xu A.-W. J. Phys. Chem. C. 2010;114:5073–5079. doi: 10.1021/jp9110037. - DOI
    1. Hori Y. Wakebe H. Tsukamoto T. Koga O. Electrochim. Acta. 1994;39:1833–1839. doi: 10.1016/0013-4686(94)85172-7. - DOI