

Identification and Validation of IFI44 as Key Biomarker in Lupus Nephritis
- PMID: 34760904
- PMCID: PMC8574154
- DOI: 10.3389/fmed.2021.762848
Identification and Validation of IFI44 as Key Biomarker in Lupus Nephritis
Abstract
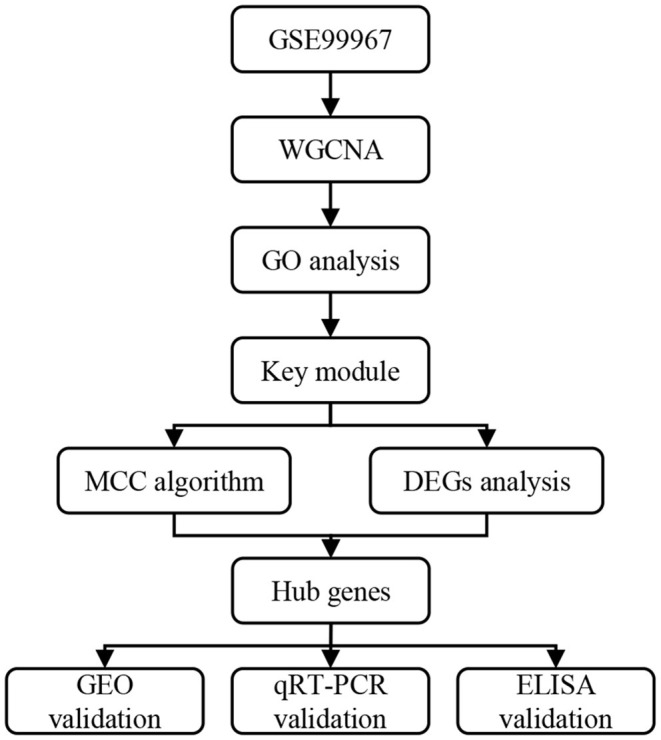
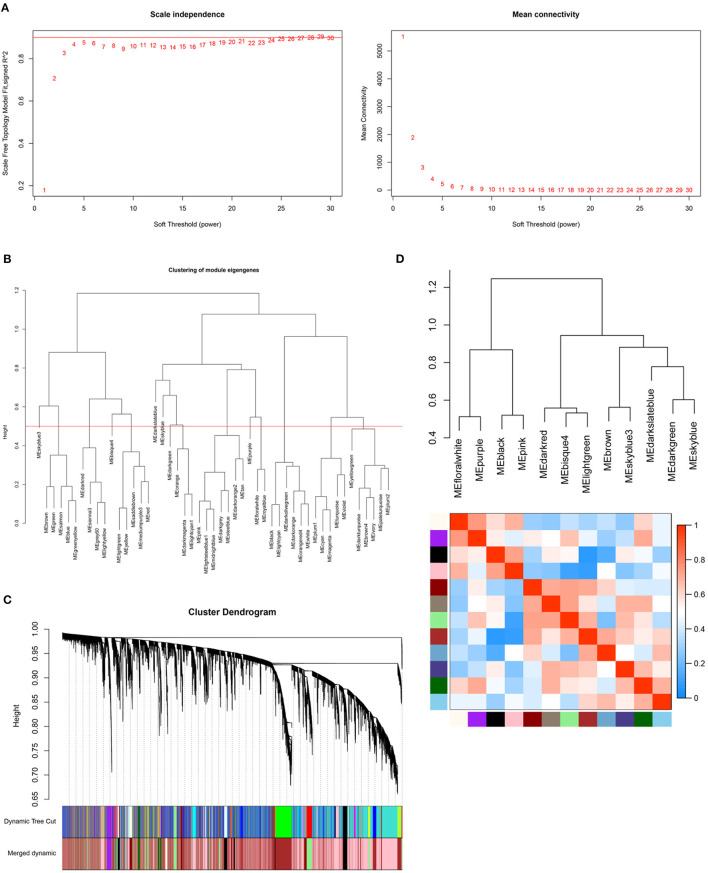
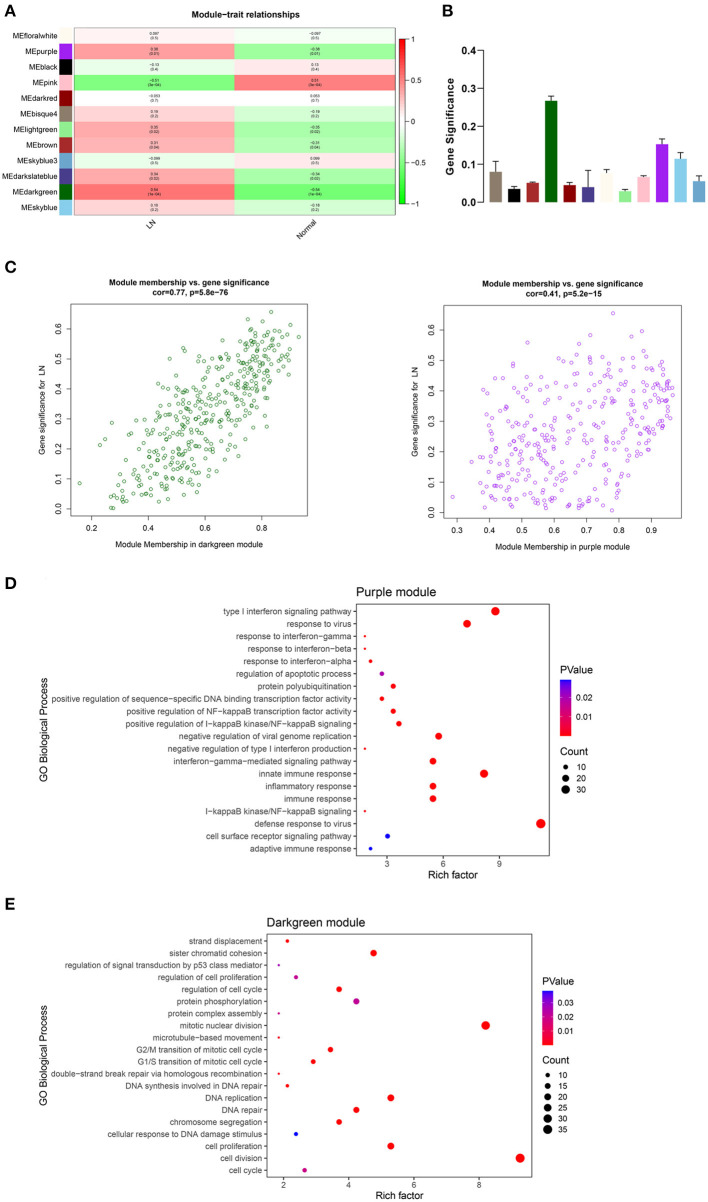
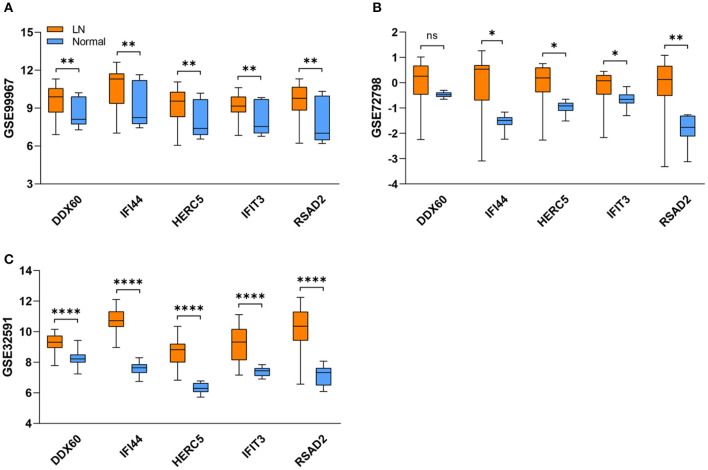
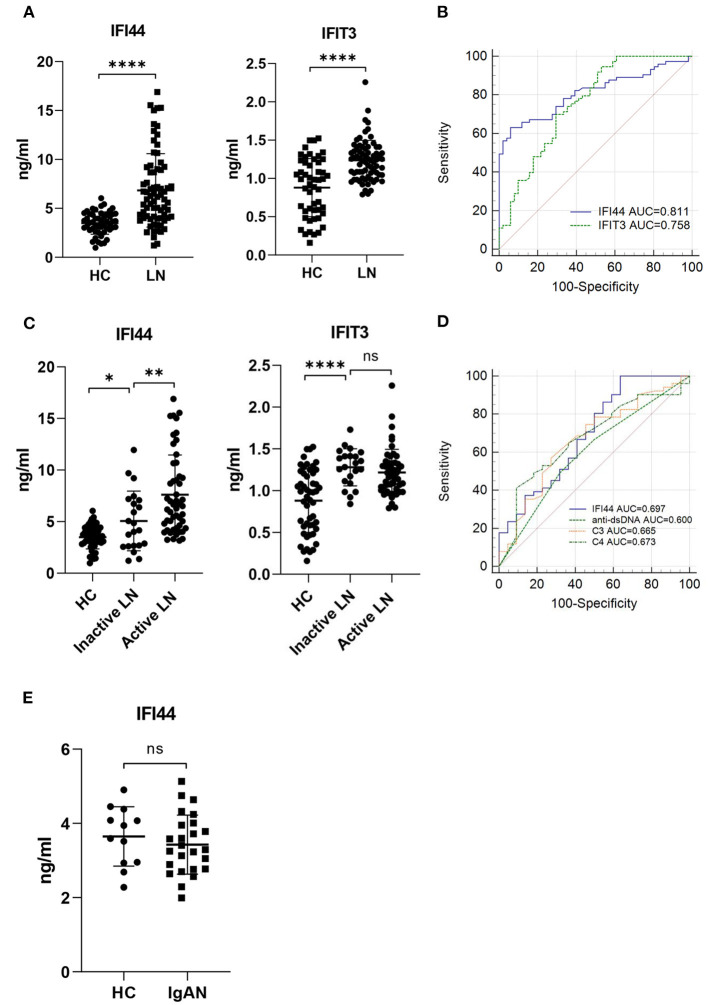
Lupus nephritis (LN) is a common and severe organ manifestation of systemic lupus erythematosus (SLE) and is a major cause of SLE related deaths. Early diagnosis is essential to improve the prognosis of patients with LN. To screen the potential biomarkers associated with LN, we downloaded the gene expression profile of GSE99967 from the Gene Expression Omnibus (GEO) database. Weighted gene co-expression network analysis (WGCNA) was utilized to construct a gene co-expression network and identify gene modules associated with LN. Gene Ontology (GO) analysis was also applied to explore the biological function of genes and identify the key module. Differentially expressed genes (DEGs) were identified and Maximal Clique Centrality (MCC) values were calculated to screen hub genes. Furthermore, we selected promising biomarkers for real-time PCR (qRT-PCR) and enzyme-linked immunosorbent assay (ELISA) validation in independent cohorts. Our results indicated that five hub genes, including IFI44, IFIT3, HERC5, RSAD2, and DDX60 play vital roles in the pathogenesis of LN. Importantly, IFI44 may considered as a key biomarker in LN for its diagnostic capabilities, which is also a promising therapeutic target in the future.
Keywords: biomarker; hub genes; lupus nephritis; type-I interferon; weighted gene co-expression network analysis.
Copyright © 2021 Shen, Lan, Zhu, Chen, Gu, Wang, Chen, Wang, Tu, Enghard, Jiang and Chen.
Conflict of interest statement
The authors declare that the research was conducted in the absence of any commercial or financial relationships that could be construed as a potential conflict of interest. The reviewer JM declared a shared affiliation with the authors to the handling editor at time of review.
Figures
Similar articles
-
CD36 identified by weighted gene co-expression network analysis as a hub candidate gene in lupus nephritis.PeerJ. 2019 Oct 1;7:e7722. doi: 10.7717/peerj.7722. eCollection 2019. PeerJ. 2019. PMID: 31592160 Free PMC article.
-
Identification of key biomarkers and immune infiltration in systemic lupus erythematosus by integrated bioinformatics analysis.J Transl Med. 2021 Jan 19;19(1):35. doi: 10.1186/s12967-020-02698-x. J Transl Med. 2021. PMID: 33468161 Free PMC article.
-
Identification of driver genes in lupus nephritis based on comprehensive bioinformatics and machine learning.Front Immunol. 2023 Dec 7;14:1288699. doi: 10.3389/fimmu.2023.1288699. eCollection 2023. Front Immunol. 2023. PMID: 38130724 Free PMC article.
-
Interferon-Inducible Protein 10 and Disease Activity in Systemic Lupus Erythematosus and Lupus Nephritis: A Systematic Review and Meta-Analysis.Int J Mol Sci. 2019 Oct 8;20(19):4954. doi: 10.3390/ijms20194954. Int J Mol Sci. 2019. PMID: 31597273 Free PMC article.
-
Genetics of human lupus nephritis.Clin Immunol. 2017 Dec;185:32-39. doi: 10.1016/j.clim.2016.09.012. Epub 2016 Sep 28. Clin Immunol. 2017. PMID: 27693588 Free PMC article. Review.
Cited by
-
Identification of m6A-Related Biomarkers in Systemic Lupus Erythematosus: A Bioinformation-Based Analysis.J Inflamm Res. 2024 Jan 27;17:507-526. doi: 10.2147/JIR.S439779. eCollection 2024. J Inflamm Res. 2024. PMID: 38298525 Free PMC article.
-
Predicting diagnostic gene expression profiles associated with immune infiltration in patients with lupus nephritis.Front Immunol. 2022 Dec 2;13:839197. doi: 10.3389/fimmu.2022.839197. eCollection 2022. Front Immunol. 2022. PMID: 36532018 Free PMC article.
-
BIRC5 Inhibition Is Associated with Pyroptotic Cell Death via Caspase3-GSDME Pathway in Lung Adenocarcinoma Cells.Int J Mol Sci. 2023 Sep 28;24(19):14663. doi: 10.3390/ijms241914663. Int J Mol Sci. 2023. PMID: 37834111 Free PMC article.
-
Identification and Clinical Correlation Analysis of IFI44 in Systemic Lupus Erythematosus Combined with Bioinformatics and Immune Infiltration Analysis.J Inflamm Res. 2023 Aug 1;16:3219-3231. doi: 10.2147/JIR.S419880. eCollection 2023. J Inflamm Res. 2023. PMID: 37547125 Free PMC article.
-
Identification of toll-like receptor 5 and acyl-CoA synthetase long chain family member 1 as hub genes are correlated with the severe forms of COVID-19 by Weighted gene co-expression network analysis.IET Syst Biol. 2023 Dec;17(6):327-335. doi: 10.1049/syb2.12079. Epub 2023 Oct 12. IET Syst Biol. 2023. PMID: 37823415 Free PMC article.
References
LinkOut - more resources
Full Text Sources