. 2021 Nov 1:2021:6666506.
doi: 10.1155/2021/6666506. eCollection 2021.

MicroRNA-27a Promotes Oxidative-Induced RPE Cell Death through Targeting FOXO1

Affiliations

MicroRNA-27a Promotes Oxidative-Induced RPE Cell Death through Targeting FOXO1

Chengda Ren et al. Biomed Res Int. .

Abstract

Age-related macular degeneration (AMD) is a multifactor disease, which is primarily characterized by retinal pigment epithelium (RPE) cell loss. Since the retina is the most metabolically active tissue, RPE cells are exposed to consistent oxidative environment. So, oxidation-induced RPE cell death has long been considered a contributor to the onset of AMD. Here, we applied a retinal degeneration (RD) rat model induced by blue light-emitting diode (LED) and a cell model constructed by H2O2 stimulus to mimic the prooxidant environment of the retina. We detected that the expression of miR-27a was upregulated and the expression of FOXO1 was downregulated in both models. So, we furtherly investigated the role of miR-27a-FOXO1 axis in RPE in protesting against oxidants. Lentivirus-mediated RNA was injected intravitreally into rats to modulate the miR-27a-FOXO1 axis. Retinal function and histopathological changes were evaluated by electroretinography (ERG) analysis and hematoxylin and eosin (H&E) staining, respectively. Massive photoreceptor and RPE cell death were examined by terminal deoxynucleotidyl transferase-mediated dUTP nick end labeling (TUNEL). The damage to the retina was aggravated in the FOXO1 gene-knockdown and miR-27a-overexpression groups after exposure to LED but was alleviated in the FOXO1 gene-overexpression or miR-27a-knockdown groups. Dual luciferase assay was used to detect the binding site of miR-27a and FOXO1. Upregulated miR-27a inhibited the expression of FOXO1 by directly binding to the FOXO1 mRNA 3'UTR and decreased the autophagy activity of ARPE-19 cells, resulting in the accumulation of reactive oxygen species (ROS) and decrease of cell viability. The results suggest that miR-27a is a negative regulator of FOXO1. Also, our data emphasize the prominent role of miR-27a/FOXO1 axis in modulating ROS accumulation and cell death in RPE cell model under oxidative stress and influencing the retinal function in the LED-induced RD rat model.


Conflict of interest statement

The authors declare that they have no conflicts of interest.

Figures

Figure 1
Figure 1
Functional and histological assessment of the RD rat model. (a) Representative ERG response graph of the control group and RD model group at the indicated times. All ERG waves gradually decreased with time. (b) ERG amplitudes of the a-waves and b-waves. (c) Representative H&E staining of retinal sections from the control group and RD rat model group at the indicated time points. There is an obvious disorder of retinal structure and a decrease of retinal thickness over time (scale bar = 50 μM). (d) Statistical analysis of the ONL thickness in the above groups (superior to inferior from the optic nerve head). The data are calculated as means ± SD. P < 0.05, ∗∗P < 0.01, and ∗∗∗∗P < 0.0001, comparisons versus control, n = 6 (eye samples in each group).
Figure 2
Figure 2
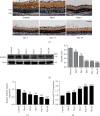
FOXO1 and miRNA-27a expression after blue LED exposure in vivo. (a) The FOXO1 protein levels were examined by immunohistochemistry after blue LED exposure at the indicated times (scale bar = 50 μM). (b) The western blot analysis and the statistical results of FOXO1 protein levels in the RPE-choroid-sclera complex at the indicated times after blue LED exposure. (c, d) The FOXO1 mRNA levels and miRNA-27a expression levels of the RPE-choroid-sclera complex were detected by qRT-PCR at the indicated times after blue LED exposure; 2(-ΔΔCT) method was used for quantification analysis. The data are expressed as means ± SD. P < 0.05, ∗∗P < 0.01, ∗∗∗P < 0.001, and ∗∗∗∗P < 0.0001, comparisons versus control, n = 6 (eye samples in each group).
Figure 3
Figure 3
The morphological and functional changes after modulating miR-27a-FOXO1 axis in the RD rat model. (a) The relative expression level of miR-27a of rats treated with miR-27a OE (miR-27a overexpression) and miR-27a shRNA. (b) The relative expression level of FOXO1 mRNA of rats treated with FOXO1 OE (FOXO1 overexpression) and FOXO1 shRNA. (c, d) The representative images and mean amplitudes of ERG responses in 3000-lux blue LED-exposed retinas of the control blank and experimental Lentivirus-mediated injection groups at different time points (e, f) H&E staining of retinal sections and the ONL thickness measurement of the control blank Lentivirus and experimental Lentivirus-mediated injection groups at different time points after blue LED exposure (scale bar = 50 μM). (c) TUNEL of representative sections from the control blank Lentivirus and experimental Lentivirus-mediated injection groups at different time points (Scale bar =50 μM). The data are analyzed as means ± SD. P < 0.05, ∗∗P < 0.01, and ∗∗∗P < 0.001, comparisons versus control, n = 6 (eye samples in each group).
Figure 4
Figure 4
Establishment of the oxidative stress response model in vitro in ARPE-19 cells. (a) ARPE-19 cells were treated with 100-800 μM H2O2 for 0.5 h, and cell viability was measured at a wavelength of OD = 450 by CCK-8 assay. (b, c) ARPE-19 cells were under 100 and 200 μM H2O2 treatment for 0.5–3 h, and cell viability was measured by CCK-8 assay. (d, e) Quantitative real-time PCR results of the relative miRNA-27a and FOXO1 mRNA expression level of ARPE-19 cells under H2O2 treatment; 2(-ΔΔCT) method was used for quantification analysis. (f) Quantitative real-time PCR was applied to analyze the FOXO1 mRNA expression in ARPE-19 cells transfected with the si-FOXO1 compared with the NC group; 2(-ΔΔCT) method was used for quantification analysis. The data are expressed as means ± SD. ∗∗P < 0.01 and ∗∗∗P < 0.001. All experiments were repeated three times independently.
Figure 5
Figure 5
miRNA-27a regulates FOXO1 expression through binding to the 3′-UTR region. (a) ARPE-19 cells were transfected with negative control, miRNA-27a mimic, and miRNA-27a inhibitor for 48 hrs, and qRT-PCR was applied to show the relative abundance of miRNA-27a in ARPE-19 cells. U6 was applied as an internal control. (b) Negative control, miRNA-27a mimic, and miRNA-27a inhibitor were transfected into ARPE-19 cells for 48 hrs, and the FOXO1 protein levels were measured by western blotting. Actin was used as an internal control. (c) The dual luciferase assay verified the binding site of miRNA-27a to the FOXO1 3′-UTR. ARPE-19 cells were transfected with wild-type FOXO1 or mutant-type FOXO1 with negative control and miRNA-27a mimic, respectively, for 48 hrs, and the dual luciferase activity was measured. (d) The 3′-untranslated region of FOXO1 mRNA targeted by miRNA-27a was predicated through the TargetScan website. The data are expressed as means ± SD. P < 0.05 and ∗∗∗P < 0.001. All experiments were repeated three times independently.
Figure 6
Figure 6
The miRNA-27a-FOXO1 axis regulates ARPE-19 cell autophagic activity. (a) ARPE-19 cells were treated with different concentrations of H2O2, 3-MA, or rapamycin, and the expression of autophagic protein LC3B-II was detected by western blotting. Actin was used as an internal control. (b) Cells were pretreated with vehicle, rapamycin (200 nM), or 3-MA (1 mM), respectively, and then challenged with H2O2 (100 μM). LC3B-II protein levels were detected by western blot assay. (c) Western blot results of ARPE-19 cells transfected with miR-27a, miR-27a inhibitor, or miR-NC. (d) ARPE-19 cells were transfected with si-NC or FOXO1 siRNA for 48 hrs, and the expression levels of FOXO1, Atg12, and LC3B-II were examined by western blotting. Actin was used as an internal control. The data are shown as means ± SD. P < 0.05, ∗∗P < 0.01, ∗∗∗P < 0.001, and ∗∗∗∗P < 0.0001. All experiments were repeated three times independently.
Figure 7
Figure 7
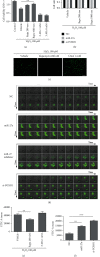
The perturbation of miRNA-27a-FOXO1 axis reduces antioxidative ability of ARPE-19 cell in an autophagy-dependent way. (a) ARPE-19 cells were pretreated with the indicated concentrations of rapamycin and 3-MA for 2 hrs and were stimulated with H2O2 (100 μM), and then, the cell viability was measured by CCK-8 assay. (b) ARPE-19 cells were transfected with the negative control, miRNA-27a, and FOXO1 siRNAs for 48 hrs and then were pretreated with the indicated concentrations of rapamycin for 2 hrs. Thereafter, the cells were stimulated with H2O2 (100 μM) and the cell viability was measured by CCK-8 assay at 450 nm wavelength. (c) H2DCFDA staining of oxidative APRE-19 cells in the indicated groups (scale bar = 100 μM). (d) The fluorescence of intracellular ROS in the indicated groups was measured in a time-dependent manner (starting time = 0 min; time interval = 1 min; scale bar = 10 μM). Intracellular ROS of ARPE-19 cells stimulated with 100 μM H2O2, H2O2 + 200 nM RAPA, and H2O2 + 1 mM 3-MA were subjected to flow cytometry analysis. (f) ARPE-19 cells were transfected with the negative control, miRNA-27a, and FOXO1 siRNA, and the intracellular ROS was analyzed by flow cytometry. Rapa: rapamycin. The data are shown as means ± SD. P < 0.05, ∗∗P < 0.01, and ∗∗∗P < 0.001. The experiments were repeated three times independently.

Similar articles

Cited by

References

    1. Kaarniranta K., Salminen A. Age-related macular degeneration: activation of innate immunity system via pattern recognition receptors. Journal of Molecular Medicine (Berlin, Germany) . 2009;87(2):117–123. doi: 10.1007/s00109-008-0418-z. - DOI - PubMed
    1. Resnikoff S., Pascolini D., Etya'ale D., et al. Global data on visual impairment in the year 2002. Bulletin of the World Health Organization . 2004;82(11):844–851. - PMC - PubMed
    1. Handa J. T., Bowes Rickman C., Dick A. D., et al. A systems biology approach towards understanding and treating non- neovascular age-related macular degeneration. Nature Communications . 2019;10(1):p. 3347. doi: 10.1038/s41467-019-11262-1. - DOI - PMC - PubMed
    1. Rodrigues G. A spontaneous CNV model provides new tool to understand AMD. Investigative Ophthalmology & Visual Science . 2014;55(6):p. 3720. doi: 10.1167/iovs.14-14827. - DOI - PubMed
    1. Jarrett S. G., Boulton M. E. Consequences of oxidative stress in age-related macular degeneration. Molecular Aspects of Medicine . 2012;33(4):399–417. doi: 10.1016/j.mam.2012.03.009. - DOI - PMC - PubMed

MeSH terms