. 2021 Oct 5:23:254-265.
doi: 10.1016/j.omto.2021.09.009. eCollection 2021 Dec 17.

Chandipura virus induces cell death in cancer cell lines of human origin and promotes tumor regression in vivo

Affiliations

Chandipura virus induces cell death in cancer cell lines of human origin and promotes tumor regression in vivo

Reshma Koolaparambil Mukesh et al. Mol Ther Oncolytics. .

Abstract

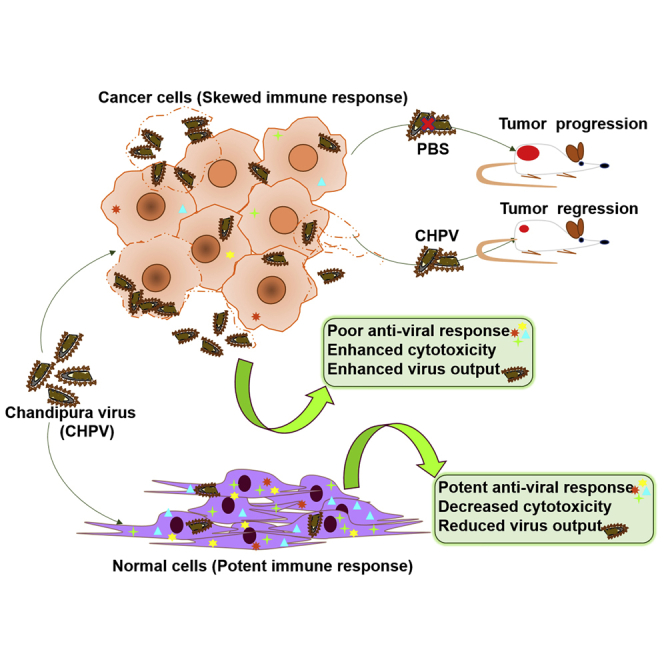
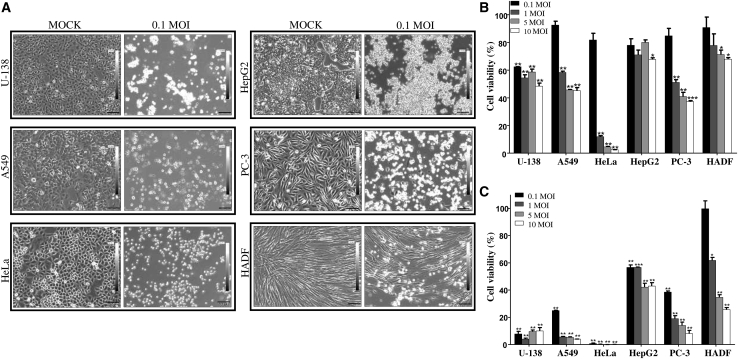
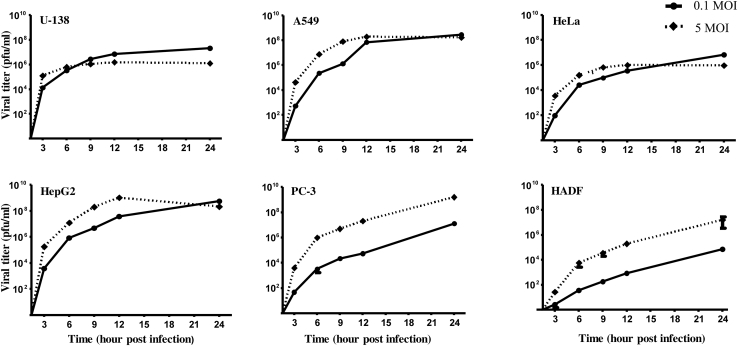
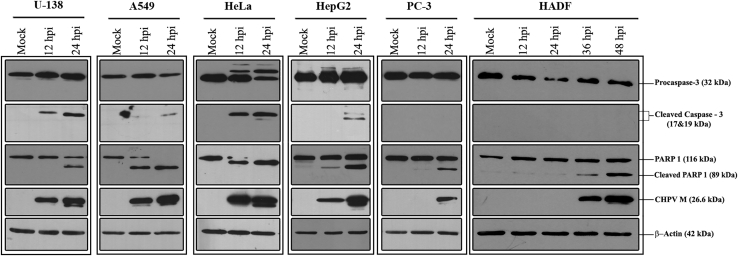
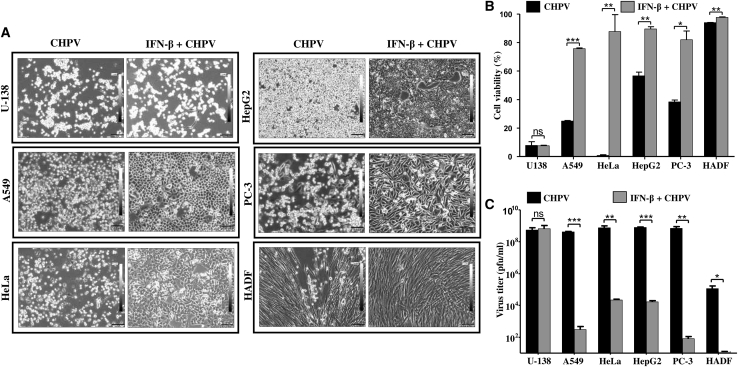
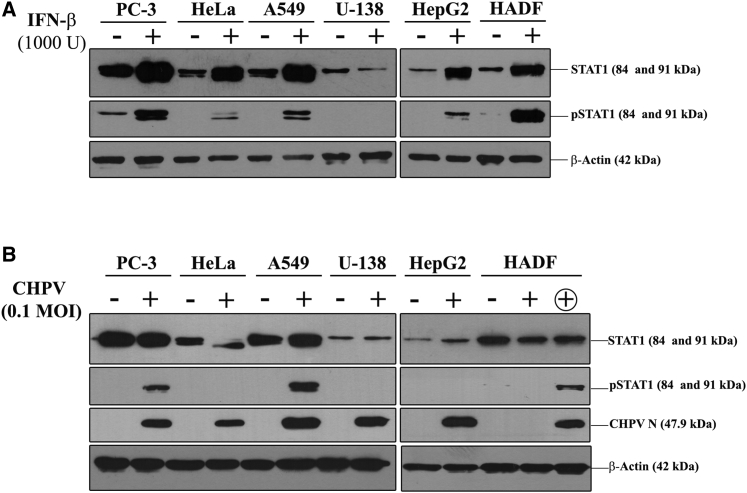
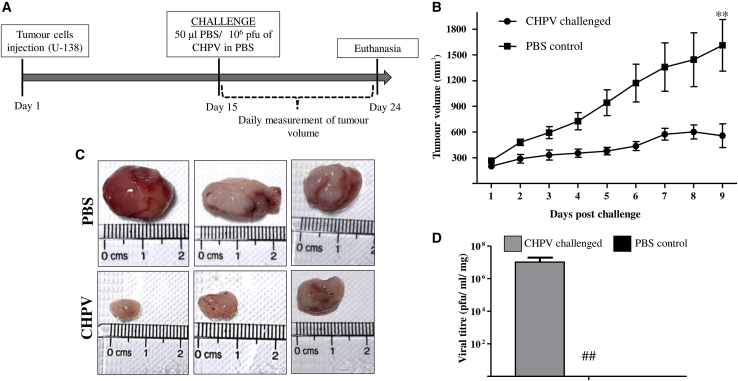
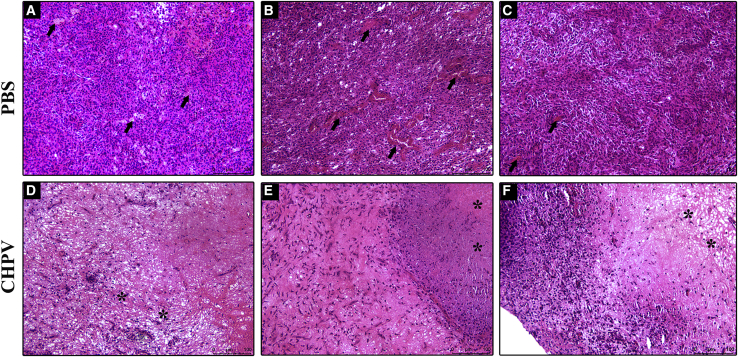
Chandipura virus (CHPV) is an emerging human pathogen of great clinical significance. In this study, we have investigated the susceptibility pattern of both normal and cancer cell lines of human origin to wild-type (wt) CHPV in order to explore the possibility of developing CHPV as an oncolytic vector (OV). Marked cytopathic effect along with enhanced virus output was observed in cancer cell lines (HeLa, A549, U-138, PC-3, and HepG2) in comparison to normal human adult dermal fibroblast (HADF) cells. At an MOI of 0.1, cancer cell lines were differentially susceptible to CHPV, with cells like HeLa and U-138 having pronounced cell death, while the PC-3 were comparatively resistant. All cell lines used in the study except U-138 restricted CHPV infection to varying degrees with IFN-β pre-treatment and supplementation of interferon (IFN) could neither activate the IFN signaling pathway in U-138 cells. Finally, U-138 tumor xenografts established in non-obese diabetic severe combined immunodeficiency (NOD/SCID) mice showed significant delay in tumor growth in the CHPV-challenged animals. Thus, targeted cytopathic effect in cancer cells at a very low dose with restricted replication in normal cells offers a rationale to exploit CHPV as an oncolytic vector in the future.

Keywords: Chandipura virus; U-138 glioma cells; anti-viral response; cytopathic property; interferon-β; oncolytic vector; tumor growth and regression; virus induced cytotoxicity; xenograft model.


Conflict of interest statement

The authors declare no competing interests.

Figures

None
Graphical abstract
Figure 1
Figure 1
Chandipura virus (CHPV) infection shows differential susceptibility and reduced cell viability among various cell lines (A) Human cancer cell lines U-138, A549, HeLa, HepG2, PC-3, and a primary normal cell line HADF (indicated on the left side of each panel) were infected with 0.1 MOI of CHPV for 48 h, and the morphological changes were monitored using bright-field microscopy. Left panel indicates mock-infected cells and the right panel that of cells infected with 0.1 MOI of CHPV. Note the marked cell rounding and the complete disruption of the monolayer in the CHPV-infected cancer cells in comparison to HADF cells. Images were acquired at a magnification of ×100 and scale bars represent 100 μm. (B and C) Cell viability assay to quantify the cytolytic potential of CHPV. In vitro cell viability assay was carried out on all the selected cells after infecting the cells with 0.1, 1, 5, and 10 MOI of CHPV. Percentage of cell viability was calculated at 24 h (B) and 48 h (C) post-infection with respect to the mock-infected control. The degree of cytotoxicity was varied with the type of cell, MOI of the virus, and the time after infection (see also Figure S1). The bar represents the standard error of mean (SEM) of two independent experiments performed in triplicate; ∗p ≤ 0.05, ∗∗p ≤ 0.01, and ∗∗∗p ≤ 0.001.
Figure 2
Figure 2
Growth kinetics of CHPV in different cell lines A comparative analysis of the replication pattern of CHPV in different cell lines was performed by plaque assay. Viral titer was estimated at different time points (3, 6, 9, 12, and 24 hpi) after infection with a low (0.1) and high MOI (5) of CHPV followed by the generation of single- and multi-step growth curves. A marked difference in the replication pattern of CHPV was observed among the various cell lines, noticed most prominently in the growth curves of PC-3 and HADF cells. Each data point represents the mean ± SEM of three independent experiments.
Figure 3
Figure 3
Apoptosis contributes to CHPV-induced cytotoxicity Mock- and CHPV-infected lysates at 12 and 24 h (for cancer cells) and 12, 24, 36, and 48 h (for HADF cells) were collected and probed with antibodies against select apoptotic markers by western blotting. Conversion of PARP1 into cleaved PARP1 is clearly evident in all the cell lines infected with CHPV. Compared to cancer cells, a significant delay in PARP cleavage can be visualized in HADF cells. Conversion of caspase-3 into the cleaved caspase-3 in the CHPV-infected cells varied across cell lines. M indicates the matrix protein of CHPV, and β-actin was used as the loading control. The blots are representative of three independent experiments. The role of apoptosis in CHPV-induced cytotoxicity could be established in the HeLa cells using HeLa Bcl-2 cell line (Figure S2),
Figure 4
Figure 4
IFN-β pre-treatment differentially protects cells from CHPV infection The protective effect of IFN-β on cells during CHPV infection was studied using microscopy and MTT assay. (A) Phase-contrast microscopy. Images acquired 48 hpi show the protective effect of IFN-β pre-treatment in all the cell lines infected with CHPV except U-138 cells. Note the marked reduction in the alterations in morphology of IFN-β-treated cells (right panels) in comparison to the untreated (left panels), while no difference is observed in the case of U-138 cells (left top two panels). HADF cells can be seen virtually unaffected by CHPV post-IFN-β treatment (right, bottom panel). Images were acquired at a magnification of ×100, and scale bars represent 100 μm. (B) MTT assay. All the cells as indicated on the x axis were infected with 0.1 MOI of CHPV either with or without IFN-β treatment followed by cell viability assay 48 hpi. The percentage of metabolically active cells was significantly higher in the IFN-β pre-treated cells compared to the control CHPV-infected cells. Data represent the average of six data points ± SD from two independent experiments (see also Figure S3). (C) Plaque assay. Cell culture supernatant collected 48 hpi was subjected to plaque assay to estimate the viral titer. Supernatants from the IFN-β pre-treated groups (gray bars) had significantly less virus output compared to the untreated (black bars) except in the case of U-138 cells. Data represent the mean ± SD of three independent experiments. ∗∗∗p ≤ 0.001,∗∗p ≤ 0.01, ∗p ≤ 0.05; ns indicates non-significance.
Figure 5
Figure 5
IFN-β-mediated STAT1 activation is arrested in U-138 cells (A) Monolayers of the indicated cells were treated with 1,000 U/mL IFN-β for 24 h, and the levels of STAT1 and pSTAT1 were detected by immunoblotting. IFN-β treatment resulted in the conversion of STAT1 into pSTAT1 in all the cells except U-138 cells. (B) The change in expression levels of STAT1 and conversion into pSTAT1 was also checked in CHPV-infected cells by immunoblotting. The + above the panel indicates lanes containing CHPV-infected lysates, while − indicates those from uninfected lysates. Since HADF cells are slow to respond to CHPV infection, an additional 48 hpi sample, indicated by the encircled +, was used for the assay. β-actin served as the loading control for both the experiments, and the blots are representative images of three independent experiments.
Figure 6
Figure 6
CHPV restricts tumor progression in a U-138 xenograft tumor model (A) Schematic depicting the experimental steps involved and the timeline. U-138 xenograft tumors were established by injecting 5 × 105 cells in the right flank of NOD/SCID mice. Day 15 post-implantation, and upon the tumors reaching a palpable size, they were challenged either with 106 pfu of CHPV or the vehicle PBS alone. (B) Tumor volume curve. Tumor volume was measured daily until the 9th day, and the curve was constructed by plotting the tumor volume against the day measured. The endpoint was set as the day when the tumors in the control animals reached the ethical cutoff volume of 1,500 mm3. ∗∗p ≤ 0.01. (C) Images of the resected tumors from 3 different animals from both groups. A marked difference in the tumor size between the two groups is evident, with the tumors in control animals significantly larger than those of the CHPV-challenged animals. (D) Plaque assay. Plaque assays were carried out on the homogenates of the excised tumors. The data represent the average ± SD of the virus titer from the tumors of six individual animals. ## indicates the absence of virus in the PBS control group.
Figure 7
Figure 7
Histopathological analysis of the tumor tissue (A–C) Hematoxylin and eosin staining of the tumor samples from the PBS-treated control mice. The tumor sections reveal large, tightly packed histologically discernible tumor cells with multiple nucleoli and vacuolations in the cytoplasm. The black arrows indicate severe neovascularization. (D–F) Histology sections of tumors challenged with CHPV. Moderate to severe necrosis can be observed in all these sections highlighted with asterisks. The images also show that CHPV infection mediated loss of cell architecture with prominent remnants of pyknotic nuclei. The images from both groups are from three individual animals. Images were acquired at a magnification of ×100, and scale bars represent 100 μm.

Similar articles

Cited by

References

    1. Dwibedi B., Sabat J., Hazra R.K., Kumar A., Dinesh D.S., Kar S.K. Chandipura virus infection causing encephalitis in a tribal population of Odisha in eastern India. Natl. Med. J. India. 2015;28:185–187. - PubMed
    1. Gurav Y.K., Tandale B.V., Jadi R.S., Gunjikar R.S., Tikute S.S., Jamgaonkar A.V., Khadse R.K., Jalgaonkar S.V., Arankalle V.A., Mishra A.C. Chandipura virus encephalitis outbreak among children in Nagpur division, Maharashtra, 2007. Indian J. Med. Res. 2010;132:395–399. - PubMed
    1. Chadha M.S., Arankalle V.A., Jadi R.S., Joshi M.V., Thakare J.P., Mahadev P.V., Mishra A.C. An outbreak of Chandipura virus encephalitis in the eastern districts of Gujarat state, India. Am. J. Trop. Med. Hyg. 2005;73:566–570. - PubMed
    1. Rao B.L., Basu A., Wairagkar N.S., Gore M.M., Arankalle V.A., Thakare J.P., Jadi R.S., Rao K.A., Mishra A.C. A large outbreak of acute encephalitis with high fatality rate in children in Andhra Pradesh, India, in 2003, associated with Chandipura virus. Lancet. 2004;364:869–874. - PMC - PubMed
    1. Cherian S.S., Gunjikar R.S., Banerjee A., Kumar S., Arankalle V.A. Whole genomes of Chandipura virus isolates and comparative analysis with other rhabdoviruses. PLoS ONE. 2012;7:e30315. - PMC - PubMed

LinkOut - more resources