. 2021 Jul 26;1(3):100040.
doi: 10.1016/j.crmeth.2021.100040. Epub 2021 Jun 30.

Model-based assessment of mammalian cell metabolic functionalities using omics data

Affiliations

Model-based assessment of mammalian cell metabolic functionalities using omics data

Anne Richelle et al. Cell Rep Methods. .

Abstract

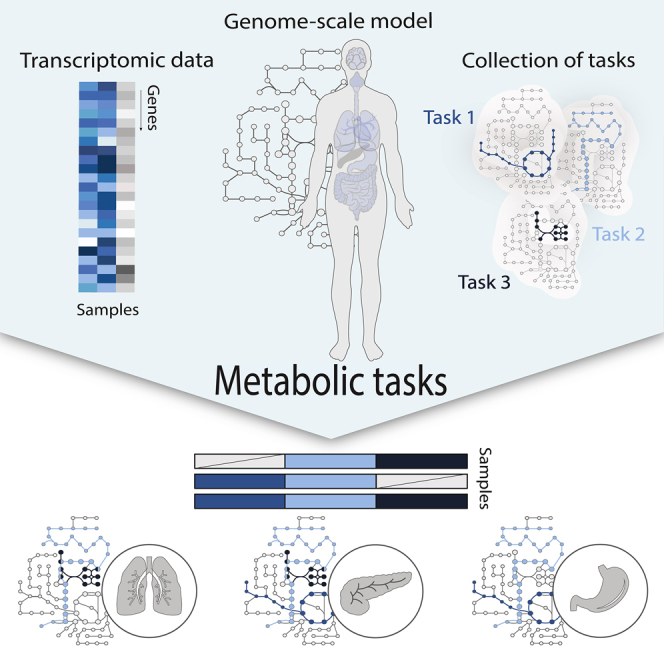
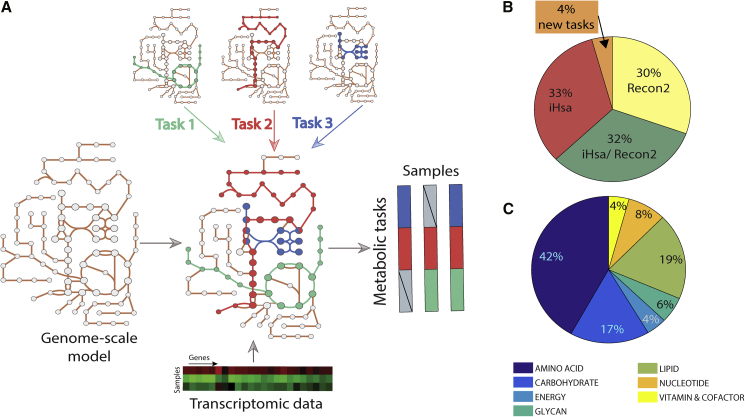
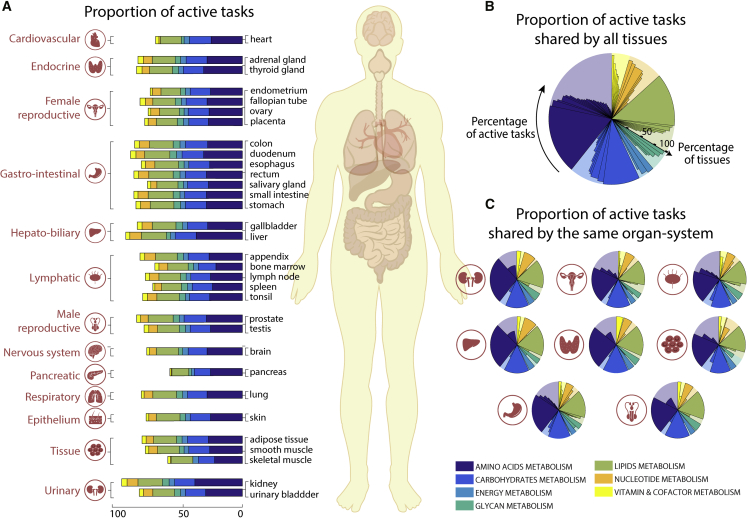
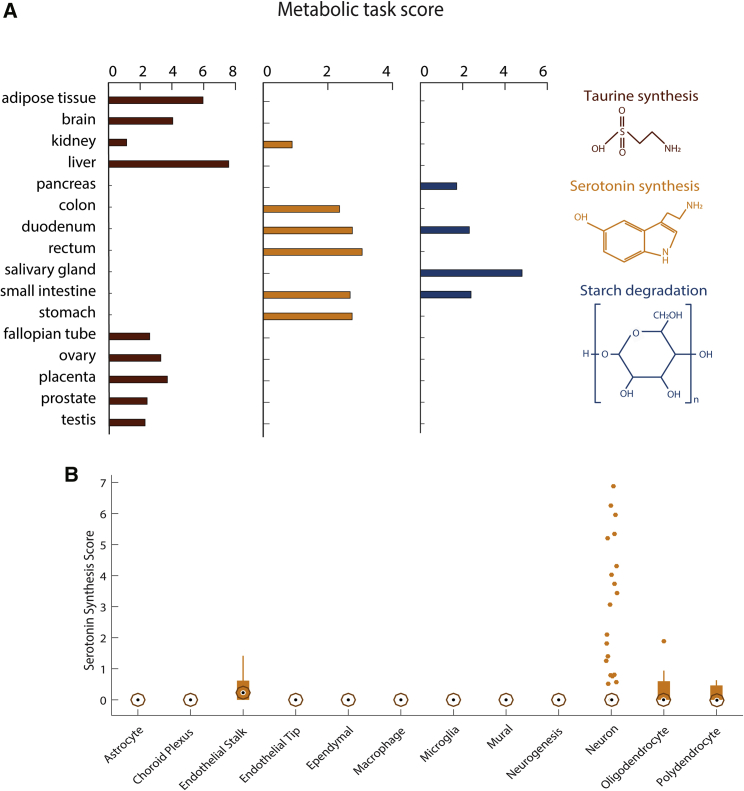
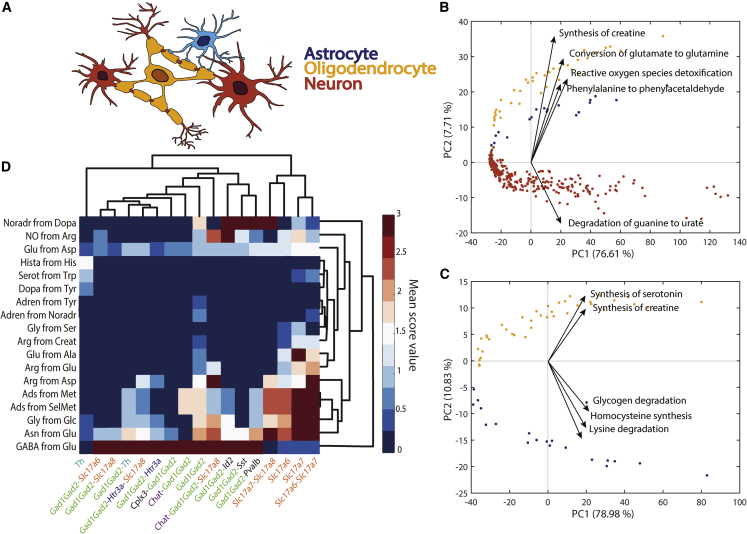
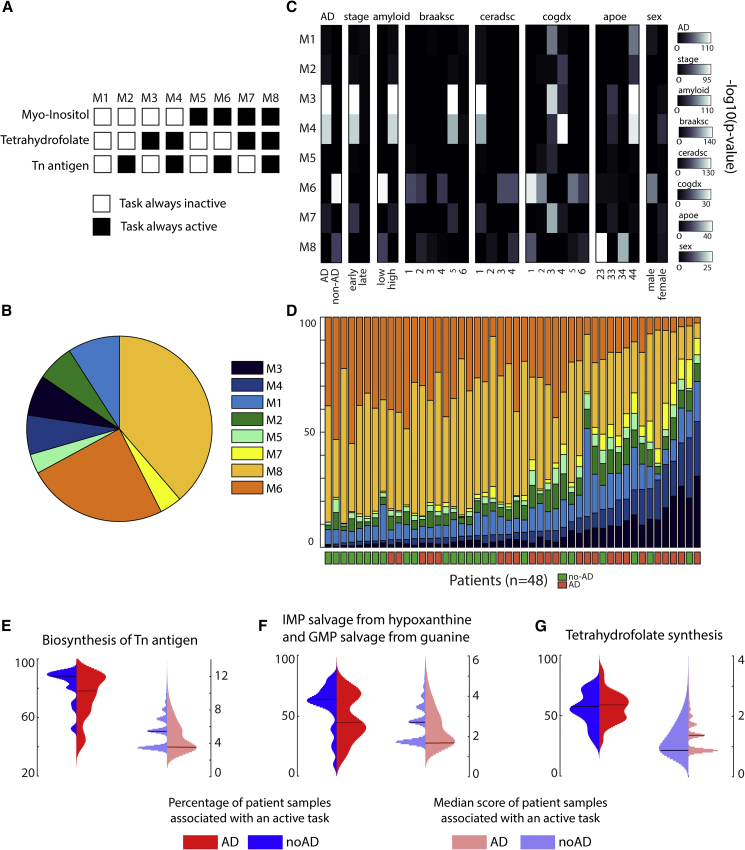
Omics experiments are ubiquitous in biological studies, leading to a deluge of data. However, it is still challenging to connect changes in these data to changes in cell functions because of complex interdependencies between genes, proteins, and metabolites. Here, we present a framework allowing researchers to infer how metabolic functions change on the basis of omics data. To enable this, we curated and standardized lists of metabolic tasks that mammalian cells can accomplish. Genome-scale metabolic networks were used to define gene sets associated with each metabolic task. We further developed a framework to overlay omics data on these sets and predict pathway usage for each metabolic task. We demonstrated how this approach can be used to quantify metabolic functions of diverse biological samples from the single cell to whole tissues and organs by using multiple transcriptomic datasets. To facilitate its adoption, we integrated the approach into GenePattern (www.genepattern.org-CellFie).


Conflict of interest statement

DECLARATION OF INTERESTS The authors declare no competing interests.

Figures

None
Graphical abstract
Figure 1
Figure 1
Genome-scale metabolic models can be used to infer the activity of a defined list of metabolic functions (A) Metabolic tasks are a modeling concept that we extend here to infer metabolic functions from transcriptomic data. (B) We curated and reconciled a collection of 195 tasks, derived in large part from earlier modeling studies (i.e., Recon2 and iHsa). The original source of each task and comments on the biological evidence of the associated metabolic function are presented in Table S1. (C) The list of curated tasks covers seven main metabolic systems.
Figure 2
Figure 2
Metabolic tasks capture functional similarities between human tissues (A) The proportion of tasks identified as active in the seven major metabolic activities for each of the 32 tissues present in the Human Protein Atlas (Uhlén et al., 2015). (B and C) Shown are (B) the percentage of active tasks that are shared by all tissues and (C) those shared within the same organ systems (Table S3). The background shaded color distribution represents the assignment of the 195 curated tasks to seven main metabolic systems.
Figure 3
Figure 3
Metabolic tasks capture the histological similarities of tissues (A) Visual representation of the similarity between tissues computed on the basis of the metabolic task approach using a principal coordinates analysis. The mean Euclidean distance for 100,000 randomly selected groups with the same number of tissues (inset) highlights the significance of the tissues clustering into organ systems. The vertical lines are the mean Euclidean distance between tissues belonging to the same organ system and their empirical p value (see STAR Methods for more details). (B) Heatmap and hierarchical clustering of histological similarities between tissues of the gastrointestinal group. (C) Hierarchical clustering of similarities between tissues of the gastrointestinal group computed on the basis of the metabolic task approach.
Figure 4
Figure 4
Metabolic specificities of tissues and brain cells (A) Metabolic task scores associated with the synthesis of taurine and serotonin and the degradation of starch. Note that the figure presents only the 16 tissues for which these tasks have been predicted. (B) Score associated with the synthesis of serotonin for 12 different brain cell types. The central black mark indicates the median, and the bottom and top edges of the box indicate the 25th and 75th percentiles, respectively. The whiskers extend to the most extreme data points not considered outliers, and the outliers are plotted individually by using orange circles with dots.
Figure 5
Figure 5
Metabolic differences between astrocytes, neurons, and oligodendrocytes (A) Schematic representation of spatial connection between astrocytes (blue), neurons (red), and oligodendrocytes (yellow). (B) Principal component analysis (PCA) component scores for the three different cell types (astrocytes, blue; neurons, red; oligodendrocytes, yellow) and the five dominant tasks in the second principal component. The five tasks most influencing the third principal component are presented in Figure S2A. (C) PCA component scores for only two cell types (astrocytes, blue; oligodendrocytes, yellow) and the five dominant tasks in the second principal component. The five tasks most influencing the third principal component are presented in Figure S2B. (D) Heatmap of metabolic tasks score mean values associated with the synthesis of main neurotransmitters in the context of the gene markers for different neuron types (i.e., mean of the metabolic task score obtained for all samples associated with specific set of gene markers). The known gene markers are highlighted with different colors (e.g., GAD family in green, Slc17 gene family in orange, Chat gene marker in purple).
Figure 6
Figure 6
Metabolic clusters of excitatory neurons and their link with Alzheimer's disease (A) The single-cell transcriptomic dataset was clustered into eight metabolic clusters with distinct patterns of activity for three metabolic tasks. (B) Percentage of the representation of each metabolic cluster within the ROSMAP dataset (Mathys et al., 2019). (C) Enrichment analysis (one-tailed Fisher's exact test) within each metabolic cluster of clinic-pathological variables (Mathys et al., 2019) (AD, pathology; stage, stage of the disease; amyloid, overall amyloid level; braaksc, Braak stage; ceradsc, assessment of neuritic plaques; cogdx, clinical consensus diagnosis; apoe, APOE (apolipoprotein E) genotype; sex, sex of the patient). (D) Percentage of samples of each metabolic cluster from each patient and their associated Alzheimer's diagnosis. (E–G) Expression patterns of the metabolic tasks (left: percentage of patient samples associated with an active task; right: related median score) presenting a dysregulated activity across groups of patients with different diagnosis for Alzheimer's disease (blue and red represent patients without and with Alzheimer's disease, respectively). The horizontal lines represent the median of the distribution.

References

    1. Agren R., Mardinoglu A., Asplund A., Kampf C., Uhlen M., Nielsen J. Identification of anticancer drugs for hepatocellular carcinoma through personalized genome-scale metabolic modeling. Mol. Syst. Biol. 2014;10:721. - PMC - PubMed
    1. Amaral A.I., Meisingset T.W., Kotter M.R., Sonnewald U. Metabolic aspects of neuron-oligodendrocyte-astrocyte interactions. Front. Endocrinol. (Lausanne) 2013;4:54. - PMC - PubMed
    1. Anlauf E., Derouiche A. Glutamine synthetase as an astrocytic marker: its cell type and vesicle localization. Front. Endocrinol. (Lausanne) 2013;4:144. - PMC - PubMed
    1. Ao Z., Quezada-Calvillo R., Sim L., Nichols B.L., Rose D.R., Sterchi E.E., Hamaker B.R. Evidence of native starch degradation with human small intestinal maltase-glucoamylase (recombinant) FEBS Lett. 2007;581:2381–2388. - PubMed
    1. Bennett D.A., Buchman A.S., Boyle P.A., Barnes L.L., Wilson R.S., Schneider J.A. Religious orders study and Rush memory and aging project. J. Alzheimer's Dis. 2018;64(s1):S161–S189. - PMC - PubMed

Publication types