. 2023 Jan;32(1):61-78.
doi: 10.1111/mec.16270. Epub 2021 Nov 23.

Different molecular changes underlie the same phenotypic transition: Origins and consequences of independent shifts to homostyly within species

Affiliations

Different molecular changes underlie the same phenotypic transition: Origins and consequences of independent shifts to homostyly within species

Emiliano Mora-Carrera et al. Mol Ecol. 2023 Jan.

Abstract

The repeated transition from outcrossing to selfing is a key topic in evolutionary biology. However, the molecular basis of such shifts has been rarely examined due to lack of knowledge of the genes controlling these transitions. A classic example of mating system transition is the repeated shift from heterostyly to homostyly. Occurring in 28 angiosperm families, heterostyly is characterized by the reciprocal position of male and female sexual organs in two (or three) distinct, usually self-incompatible floral morphs. Conversely, homostyly is characterized by a single, self-compatible floral morph with reduced separation of male and female organs, facilitating selfing. Here, we investigate the origins of homostyly in Primula vulgaris and its microevolutionary consequences by integrating surveys of the frequency of homostyles in natural populations, DNA sequence analyses of the gene controlling the position of female sexual organs (CYPᵀ), and microsatellite genotyping of both progeny arrays and natural populations characterized by varying frequencies of homostyles. As expected, we found that homostyles displace short-styled individuals, but long-style morphs are maintained at low frequencies within populations. We also demonstrated that homostyles repeatedly evolved from short-styled individuals in association with different types of loss-of-function mutations in CYPᵀ. Additionally, homostyly triggers a shift to selfing, promoting increased inbreeding within and genetic differentiation among populations. Our results elucidate the causes and consequences of repeated transitions to homostyly within species, and the putative mechanisms precluding its fixation in P. vulgaris. This study represents a benchmark for future analyses of losses of heterostyly in other angiosperms.

Keywords: Primula; heterostyly; intraspecific; loss-of-function mutations; mating system; selfing.


Conflict of interest statement

The authors declare that the research was conducted in the absence of any commercial or financial relationships that could be construed as a potential conflict of interest.

Figures

FIGURE 1
FIGURE 1
Heterostyly and homostyly in Primula vulgaris. Heterostylous floral morphs can be either short‐styled (S‐morphs) or long‐styled (L‐morphs). They are characterized by reciprocal placement of male (anthers) and female (stigmas) sexual organs (i.e., reciprocal herkogamy), promoting outcrossing. Additionally, a physiological self‐incompatibility mechanism prevents self‐ and intramorph fertilization. Homostylous floral morphs (H‐morphs) are characterized by reduced or no herkogamy and are self‐compatible, favoring selfing. Most homostyles have both stigma and anthers at the mouth of the corolla tube (i.e., long‐homostyly); short‐homostyly is rare (not shown). Long‐homostyles stem from S‐morphs and retain their male compatibility type, thus can fertilize only L‐morphs. Conversely, S‐morphs cannot fertilize long‐homostyles due to stigma clogging in the latter. Red arrows indicate compatible, likely pollinations between floral morphs. Anthers are represented in yellow and stigmas in green
FIGURE 2
FIGURE 2
Distribution and frequencies of morph types across the 22 sampled populations of Primula vulgaris in Somerset, England. (a) Geographic distribution. Pie charts represent intra‐population frequencies of long‐styled (L; white), short‐styled (S; black) and homostylous (H; grey) floral morphs; dimorphic (D) populations consist of L‐ and S‐individuals, except for population D*11, which consists of L‐ and H‐individuals; trimorphic (T) populations consist of L‐, S‐ and H‐individuals; the single monomorphic (M) population consists of H‐individuals. (b) Ternary plot representing the frequencies of S‐, L‐ and H‐individuals sampled from the same 22 populations. Each vertex of the triangle represents complete population monomorphy for each floral morph; each side of the triangle represents different levels of population dimorphism (bottom: H‐morph absent, only L‐ and S‐morphs; left side: S‐morph absent, only L‐ and Hmorphs; right side: L‐morph absent, only S‐ and H‐morphs); each point inside the triangle represents trimorphic populations; arrow pointing to the base of the triangle represents equal frequencies of S‐ and Lmorphs (i.e., isoplethy); the black dashed line represents the trajectory from isoplethy in distylous populations to complete homostyly observed in the sampled populations; the leftward shift of the line is caused by the greater reduction of S‐ than L‐individuals; the grey dashed line represents the theoretical trajectory from isoplethy in distylous populations to complete homostyly with equal reduction of S‐ vs. L‐individuals
FIGURE 3
FIGURE 3
Variation of CYPT sequences in 44 individuals of Primula vulgaris (17 short‐styled and 27 homostylous individuals) from ten natural populations included in this study, plus two CYPT alleles from two homostylous individuals previously reported as CYPTSLH1 and ‐SLH2 by Li et al. (2016); CYPT is a hemizygous gene comprising 1587 bps over five exons (base‐pair lengths of each exon are indicated in parentheses). (a) Graphical representation of the nine CYPT alleles with different types of mutations in CYPT 2–9: vertical lines, white triangles, and black triangles represent point mutations, deletions, and insertions, respectively, with positions of each mutation reported above each exon; one synonymous and five nonsynonymous mutations, two deletions, and one insertion were found. (b) Haplotype network of the nine CYPT alleles: each circle (i.e., node in the network) represents a different CYPT allele (CYPT 1–7 and CYPT‐SLH1 and ‐SLH2 , listed next to each circle), with circle size proportional to the number of homostylous (grey) and short‐styled (black) individuals carrying that allele (reported inside the circle); nodes are connected by solid lines representing the lowest number of mutational steps between alleles, in this case always a single mutational step indicated by a single dash across the line, except for CYPT 1 and CYPT 4 connected by two mutational steps; grey dashed lines represent alternative connections among haplotypes with two mutational steps between alleles, indicated by a double dash across the line
FIGURE 4
FIGURE 4
Clustering of CYPT sequences. (a) Maximum likelihood tree of CYPT sequences from 44 individuals of Primula vulgaris (17 short‐styled and 27 homostylous) generated for this study, plus CYPT sequences from two homostylous individuals previously reported as CYPT SLH1 and ‐SLH2 (Li et al., 2016), and a CYPT sequence from an S‐individual of Primula veris (GenBank: KX589238) as outgroup. Each accession at the tips is labeled from left to right with population number, individual number, and floral morph type (S and H represented as black and grey circles, respectively). Accessions from the same population have the same color (see also Figure 2). Bootstrap support values ≥80 are indicated below to the branches. (b) Counts of CYPT alleles (x axis) per population (y axis) found in S‐ and H‐individuals (represented as black and grey boxes, respectively)
FIGURE 5
FIGURE 5
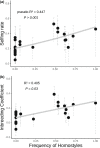
Correlations between population genetic parameters (y axis) and frequency of homostyles (x axis) in 22 natural populations of Primula vulgaris inferred from 12 microsatellites: (a) Population‐level estimates ±95% CI of selfing rates based on multilocus linkage disequilibrium (See Methods) and (b) Inbreeding coefficient ±95% CI
FIGURE 6
FIGURE 6
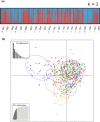
Patterns of genetic differentiation for the 22 natural populations of Primula vulgaris. (a) Results from InStruct analysis of microsatellites assigning all populations to two genetic clusters (k = 2): Optimal number of clusters was selected according to Evanno et al. (2005); (b) Plot of the two first PCs from Discriminant Analysis of Principal Components (DAPC) separating population T08 (blue circles) from the rest of the populations

Comment in

References

    1. Albalat, R. , & Cañestro, C. (2016). Evolution by gene loss. Nature Reviews Genetics, 17, 379–391. 10.1038/nrg.2016.39 - DOI - PubMed
    1. Barmentlo, S. H. , Meirmans, P. G. , Luijten, S. H. , Triest, L. , & Oostermeijer, J. G. B. (2017). Outbreeding depression and breeding system evolution in small, remnant populations of Primula vulgaris: consequences for genetic rescue. Conservation Genetics, 19, 545–554. 10.1007/s10592-017-1031-x - DOI - PMC - PubMed
    1. Barrett, S. C. H. (2010). Understanding plant reproductive diversity. Philosophical Transactions of the Royal Society B: Biological Sciences, 365(1537), 99–109. 10.1098/rstb.2009.0199 - DOI - PMC - PubMed
    1. Barrett, S. C. H. (2019). ‘A most complex marriage arrangement’: Recent advances on heterostyly and unresolved questions. New Phytologist, 224(3), 1051–1067. 10.1111/nph.16026 - DOI - PubMed
    1. Beaumont, M. A. , Zhang, W. , & Balding, D. J. (2002). Approximate Bayesian computation in population genetics. Genetics, 162(162), 2025–2035. 10.1111/j.1937-2817.2010.tb01236.x - DOI - PMC - PubMed

Publication types

Associated data