Calcium dysregulation increases right ventricular outflow tract arrhythmogenesis in rabbit model of chronic kidney disease
- PMID: 34761510
- PMCID: PMC8650029
- DOI: 10.1111/jcmm.17052
Calcium dysregulation increases right ventricular outflow tract arrhythmogenesis in rabbit model of chronic kidney disease
Abstract
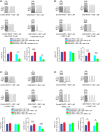
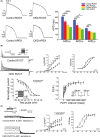
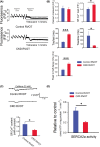
Chronic kidney disease (CKD) increases the risk of arrhythmia. The right ventricular outflow tract (RVOT) is a crucial site of ventricular tachycardia (VT) origination. We hypothesize that CKD increases RVOT arrhythmogenesis through its effects on calcium dysregulation. We analysed measurements obtained using conventional microelectrodes, patch clamp, confocal microscopy, western blotting, immunohistochemical examination and lipid peroxidation for both control and CKD (induced by 150 mg/kg neomycin and 500 mg/kg cefazolin daily) rabbit RVOT tissues or cardiomyocytes. The RVOT of CKD rabbits exhibited a short action potential duration, high incidence of tachypacing (20 Hz)-induced sustained VT, and long duration of isoproterenol and tachypacing-induced sustained and non-sustained VT. Tachypacing-induced sustained and non-sustained VT in isoproterenol-treated CKD RVOT tissues were attenuated by KB-R7943 and partially inhibited by KN93 and H89. The CKD RVOT myocytes had high levels of phosphorylated CaMKII and PKA, and an increased expression of tyrosine hydroxylase-positive neural density. The CKD RVOT myocytes exhibited large levels of Ito , IKr , NCX and L-type calcium currents, calcium leak and malondialdehyde but low sodium current, SERCA2a activity and SR calcium content. The RVOT in CKD with oxidative stress and autonomic neuron hyperactivity exhibited calcium handling abnormalities, which contributed to the induction of VT.
Keywords: calcium homeostasis; chronic kidney disease; right ventricular outflow tract; ventricular tachycardia.
© 2021 The Authors. Journal of Cellular and Molecular Medicine published by Foundation for Cellular and Molecular Medicine and John Wiley & Sons Ltd.
Conflict of interest statement
None.
Figures


Similar articles
-
Electrical and Structural Insights into Right Ventricular Outflow Tract Arrhythmogenesis.Int J Mol Sci. 2023 Jul 22;24(14):11795. doi: 10.3390/ijms241411795. Int J Mol Sci. 2023. PMID: 37511554 Free PMC article. Review.
-
Indoxyl Sulfate Induces Ventricular Arrhythmias Attenuated by Secretoneurin in Right Ventricular Outflow Tract Cardiomyocytes.Cardiovasc Toxicol. 2025 Mar;25(3):471-485. doi: 10.1007/s12012-025-09963-9. Epub 2025 Jan 21. Cardiovasc Toxicol. 2025. PMID: 39838186
-
Nicotine Exacerbates Arrhythmogenesis in Rabbit Right Ventricular Outflow Tract Triggered by Chronic Obstructive Pulmonary Disease.J Cell Mol Med. 2025 Jun;29(12):e70664. doi: 10.1111/jcmm.70664. J Cell Mol Med. 2025. PMID: 40533933 Free PMC article.
-
Discrepant effects of heart failure on electrophysiological property in right ventricular outflow tract and left ventricular outflow tract cardiomyocytes.Clin Sci (Lond). 2017 Jun 7;131(12):1317-1327. doi: 10.1042/CS20170121. Print 2017 Jun 1. Clin Sci (Lond). 2017. PMID: 28487470
-
Mechanisms and potential therapeutic targets for ventricular arrhythmias associated with impaired cardiac calcium cycling.J Mol Cell Cardiol. 2008 Jan;44(1):31-43. doi: 10.1016/j.yjmcc.2007.10.012. Epub 2007 Oct 25. J Mol Cell Cardiol. 2008. PMID: 18061204 Free PMC article. Review.
Cited by
-
Electrical and Structural Insights into Right Ventricular Outflow Tract Arrhythmogenesis.Int J Mol Sci. 2023 Jul 22;24(14):11795. doi: 10.3390/ijms241411795. Int J Mol Sci. 2023. PMID: 37511554 Free PMC article. Review.
-
Indoxyl Sulfate Induces Ventricular Arrhythmias Attenuated by Secretoneurin in Right Ventricular Outflow Tract Cardiomyocytes.Cardiovasc Toxicol. 2025 Mar;25(3):471-485. doi: 10.1007/s12012-025-09963-9. Epub 2025 Jan 21. Cardiovasc Toxicol. 2025. PMID: 39838186
-
Atrial cardiomyocytes contribute to the inflammatory status associated with atrial fibrillation in right heart disease.Europace. 2024 Mar 30;26(4):euae082. doi: 10.1093/europace/euae082. Europace. 2024. PMID: 38546222 Free PMC article.
-
Nicotine Exacerbates Arrhythmogenesis in Rabbit Right Ventricular Outflow Tract Triggered by Chronic Obstructive Pulmonary Disease.J Cell Mol Med. 2025 Jun;29(12):e70664. doi: 10.1111/jcmm.70664. J Cell Mol Med. 2025. PMID: 40533933 Free PMC article.
-
Targeting NLRP3 signaling reduces myocarditis-induced arrhythmogenesis and cardiac remodeling.J Biomed Sci. 2024 Apr 22;31(1):42. doi: 10.1186/s12929-024-01032-7. J Biomed Sci. 2024. PMID: 38650023 Free PMC article.
References
-
- Foley RN, Parfrey PS, Sarnak MJ. Clinical epidemiology of cardiovascular disease in chronic renal disease. Am J Kidney Dis. 1998;32:S112‐S119. - PubMed
-
- Herzog CA, Mangrum JM, Passman R. Sudden cardiac death and dialysis patients. Semin Dial. 2008;21:300‐307. - PubMed
-
- Green D, Roberts PR, New DI, Kalra PA. Sudden cardiac death in hemodialysis patients: an in‐depth review. Am J Kidney Dis. 2011;57:921‐929. - PubMed
Publication types
MeSH terms
Substances
LinkOut - more resources
Full Text Sources
Medical
Research Materials

