. 2022 Jan;9(2):e2103240.
doi: 10.1002/advs.202103240. Epub 2021 Nov 10.

A Multifunctional Neutralizing Antibody-Conjugated Nanoparticle Inhibits and Inactivates SARS-CoV-2

Affiliations

A Multifunctional Neutralizing Antibody-Conjugated Nanoparticle Inhibits and Inactivates SARS-CoV-2

Xiaolei Cai et al. Adv Sci (Weinh). 2022 Jan.

Abstract

The outbreak of 2019 coronavirus disease (COVID-19), caused by severe acute respiratory syndrome coronavirus 2 (SARS-CoV-2), has resulted in a global pandemic. Despite intensive research, the current treatment options show limited curative efficacies. Here the authors report a strategy incorporating neutralizing antibodies conjugated to the surface of a photothermal nanoparticle (NP) to capture and inactivate SARS-CoV-2. The NP is comprised of a semiconducting polymer core and a biocompatible polyethylene glycol surface decorated with high-affinity neutralizing antibodies. The multifunctional NP efficiently captures SARS-CoV-2 pseudovirions and completely blocks viral infection to host cells in vitro through the surface neutralizing antibodies. In addition to virus capture and blocking function, the NP also possesses photothermal function to generate heat following irradiation for inactivation of virus. Importantly, the NPs described herein significantly outperform neutralizing antibodies at treating authentic SARS-CoV-2 infection in vivo. This multifunctional NP provides a flexible platform that can be readily adapted to other SARS-CoV-2 antibodies and extended to novel therapeutic proteins, thus it is expected to provide a broad range of protection against original SARS-CoV-2 and its variants.

Keywords: COVID-19; SARS-CoV-2; multifunctional nanoparticle; photothermal therapy; virus inactivation.


Conflict of interest statement

The authors declare no conflict of interest.

Figures

Scheme 1
Scheme 1
Schematic illustration of the multifunctional NPs for the capture (by antibody) and inactivation (by photothermal) of SARS‐CoV‐2.
Figure 1
Figure 1
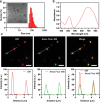
Characterization of the multifunctional NPs. a) DLS size distribution of the multifunctional NPs. Inset: TEM image of the NPs. Scale bar: 50 nm. b) UV–vis absorption spectrum of the multifunctional NPs. c) Fluorescent images and fluorescence intensity profiles of the neutralizing antibody‐conjugated multifunctional NPs labeled by DiR (red) and immunostaining by a secondary Alexa Fluor‐488 anti‐IgG2b antibody (green) and overlay. Line scan is used to indicate the fluorescence profile and co‐localization for single NPs. Excitation: 488 nm (green channel) and 740 nm (red channel). Scale bars: 2.5 µm.
Figure 2
Figure 2
Photothermal characterization of the multifunctional NPs. a) Temperature changes of the multifunctional NPs (200 µL) and 1 × PBS (200 µL) after excitation with a 650‐nm LED at the indicated times. Error bars indicate ± SEM. n = 3 per group. b) Schematic diagram (top) and electrical diagram (bottom) of voltage clamp microscope setup used to measure local temperature change. c) A representative trace of temperature increase of the multifunctional NPs during 10 ms excitation with a 650‐nm LED at 1.7 W cm−2 intensity. τ: the elapsed time required for the temperature response to decay to 1/e of initial value. d) Schematic representation of ELISA for testing the interaction between anti‐SARS‐CoV‐2 neutralizing antibody and spike protein at different temperatures. e) Optical density (OD450) of ELISA samples at different temperatures. Control: no antibody is added (37 °C). Error bars indicate ± SEM. n = 3 per group.
Figure 3
Figure 3
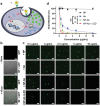
SARS‐CoV‐2 VSV‐GFP pseudovirus infection in ACE2/HEK293T cells. a) Schematic illustration of SARS‐CoV‐2 VSV‐GFP pseudovirus infecting ACE2/HEK293T cells: the spike protein on the pseudotyped virus surface binds to ACE2 (1) and infects the cell (2), releasing its RNA to be transiently expressed by the host (3) into GFP (4). b) Representative fluorescent and brightfield (BF)‐GFP merge images of ACE2/HEK293T cells before and after incubation with SARS‐CoV‐2 VSV‐GFP. Scale bars: 100 µm. c) Representative fluorescent images of ACE2/HEK293T cells after incubation with SARS‐CoV‐2 VSV‐GFP treated by different concentrations of the non‐modified NPs (NP), neutralizing antibody (Ab), neutralizing antibody‐conjugated multifunctional NPs (NP‐Ab), or NP‐Ab + 650‐nm LED excitation at 250 mW cm−2 for 10 min (NP‐Ab + LED). Scale bars: 100 µm. d) Quantification of SARS‐CoV‐2 VSV‐GFP infectivity after treatment with different concentrations of NP, Ab, NP‐Ab, or NP‐Ab + LED. IC50 ≈ 3.893 (Ab), 1.189 (NP‐Ab), and 0.442 (NP‐Ab + LED) µg mL−1. Error bars indicate ± SEM. n = 3 per group. Statistical significance is determined by sum‐of‐squares F test; * P < 0.05.
Figure 4
Figure 4
SARS‐CoV‐2 lentivirus‐GFP pseudovirus infection in ACE2/HEK293T cells. a) Schematic illustration of SARS‐CoV‐2 lentivirus‐GFP pseudovirus infecting ACE2/HEK293T cells. The spike protein on the pseudotyped virus surface binds to ACE2 (1) and infects the cell (2). The viral RNA is integrated into the host DNA (3) where it constitutively transcribes (4) and translates it (5) into GFP (6). b) Representative fluorescent and BF‐GFP merge images of ACE2/HEK293T cells before and after incubation with SARS‐CoV‐2 lentivirus‐GFP. Scale bars: 100 µm. c) Representative fluorescent images of ACE2/HEK293T cells after incubation with SARS‐CoV‐2 lentivirus‐GFP treated by different concentrations of NP, Ab, NP‐Ab, or NP‐Ab + LED. Scale bars: 100 µm. d) Quantification of SARS‐CoV‐2 lentivirus‐GFP infectivity after treatment with different concentrations of NP, Ab, NP‐Ab, or NP‐Ab + LED. IC50 ≈ 0.593 (Ab), 0.213 (NP‐Ab), and 0.076 (NP‐Ab + LED) µg mL−1. Error bars indicate ± SEM. n = 3 per group. Statistical significance is determined by sum‐of‐squares F test; * P < 0.05; ** P < 0.01.
Figure 5
Figure 5
SARS‐CoV‐2 lentivirus‐luciferase pseudovirus inactivation. a) qRT‐PCR quantification of luciferase mRNA expression in ACE2/HEK293T cells after incubation with SARS‐CoV‐2 lentivirus‐luciferase treated by the NP‐Ab and 650‐nm LED. Error bars indicate ± SEM. n = 3 per group. Statistical significance is determined by two‐tailed unpaired t‐test; ** P < 0.01; ns: not significant, P > 0.05. b,c) SARS‐CoV‐2 lentivirus‐luciferase infectivity to Vero E6 cells (b) and human lung primary cells (c). Infectivity scores of different treatments are calculated based on the luciferase signals by normalizing to virus alone. Error bars indicate ± SEM. n = 5 per group. Statistical significance is determined by two‐tailed unpaired t‐test; * P < 0.05; ** P < 0.01.
Figure 6
Figure 6
In vivo studies of the distribution and biosafety of the multifunctional NPs. a) Fluorescent images of mouse lung cryosections at day 3 post intratracheal injection of PBS or the multifunctional NPs. b) H&E staining of sections from different organs at day 3 post intratracheal injection of PBS or the multifunctional NPs. Scale bars: 50 µm. c) Blood analysis at day 3 post intratracheal injection of PBS or the multifunctional NPs. Error bars indicate ± SEM. n = 5 per group. Statistical significance is determined by two‐tailed unpaired t‐test; ns: not significant, P > 0.05.
Figure 7
Figure 7
In vivo studies of the multifunctional NPs for SARS‐CoV‐2 treatment. a) Schematic illustration of the in vivo studies of authentic SARS‐CoV‐2 treatments by NP‐Ab or Ab. b) Mouse body weights after SARS‐CoV‐2 challenge under different treatments. Error bars indicate ± SEM. n = 5 per group. c) Quantification of SARS‐CoV‐2 mRNA expression in mouse lungs via qRT‐PCR at day 5 post SARS‐CoV‐2 challenge. Error bars indicate ± SEM. n = 5 per group. Statistical significance is determined by two‐tailed unpaired t‐test; * P < 0.05; ** P < 0.01. d) Viral titers in mouse lungs at day 5 post SARS‐CoV‐2 challenge. Error bars indicate ± SEM. n = 5 per group. Statistical significance is determined by two‐tailed unpaired t‐test; * P < 0.05; ** P < 0.01. e) Immunostaining of mouse lung sections after intranasal injection of PBS, NP‐Ab, or Ab. Blue channel: DAPI. Red channel: anti‐IgG‐PE. Scale bars: 50 µm. f) Concentrations of Ab in mouse lungs after intranasal injection of PBS, NP‐Ab, or Ab measured by ELISA. Error bars indicate ± SEM. n = 5 per group. Statistical significance is determined by two‐tailed unpaired t‐test; * P < 0.05; *** P < 0.001.

Update of

References

    1. Ranney M. L., Griffeth V., Jha A. K., N. Engl. J. Med. 2020, 382, e41. - PubMed
    1. Spinelli A., Pellino G., Br. J. Surg. 2020, 107, 785. - PMC - PubMed
    1. Smith K. F., Goldberg M., Rosenthal S., Carlson L., Chen J., Chen C., Ramachandran S., J. R. Soc., Interface 2014, 11, 20140950. - PMC - PubMed
    1. Yan R., Zhang Y., Li Y., Xia L., Guo Y., Zhou Q., Science 2020, 367, 1444. - PMC - PubMed
    1. Zhang H., Penninger J. M., Li Y., Zhong N., Slutsky A. S., Intensive Care Med. 2020, 46, 586. - PMC - PubMed

Publication types

MeSH terms

Substances