

The roles of ferroptosis regulatory gene SLC7A11 in renal cell carcinoma: A multi-omics study
- PMID: 34761566
- PMCID: PMC8683539
- DOI: 10.1002/cam4.4395
The roles of ferroptosis regulatory gene SLC7A11 in renal cell carcinoma: A multi-omics study
Abstract
Background: The ferroptosis inhibitory gene Solute carrier family 7 member 11 (SLC7A11) provides a new strategy for anticancer treatment. However, its function in renal cell carcinoma (RCC) remains elusive.
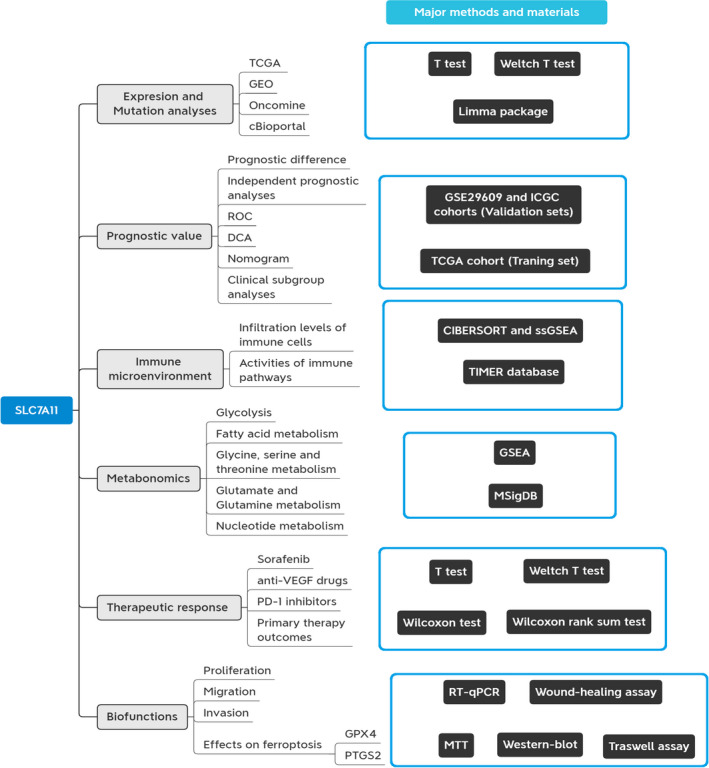
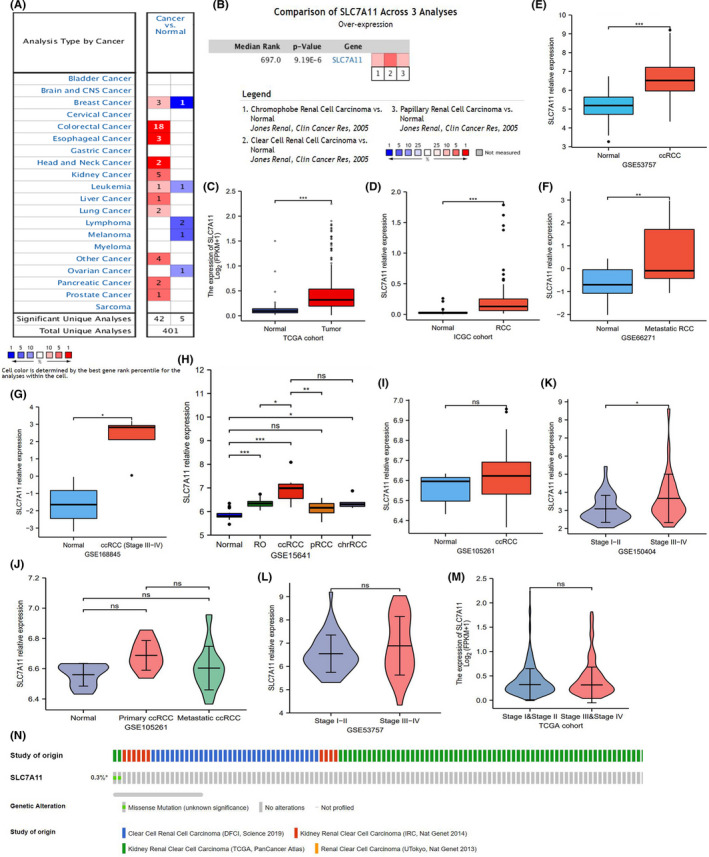
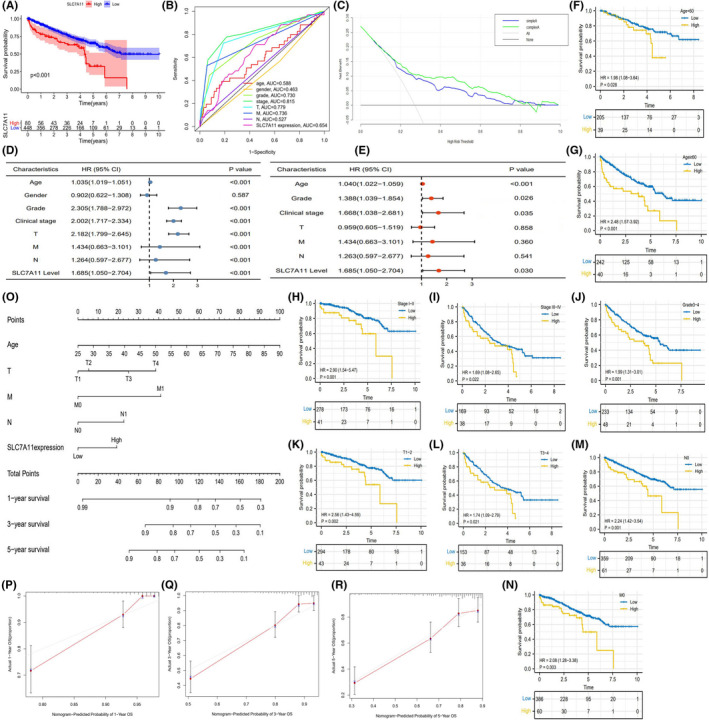
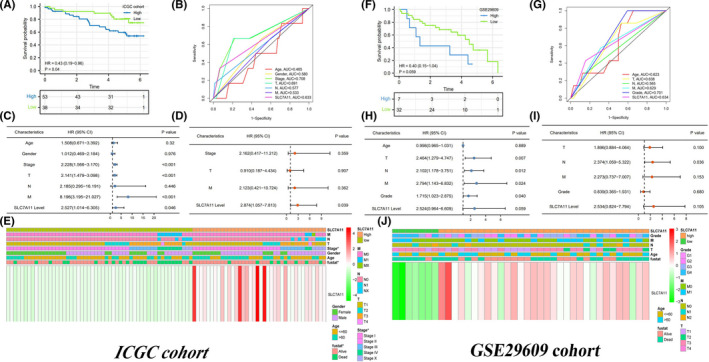
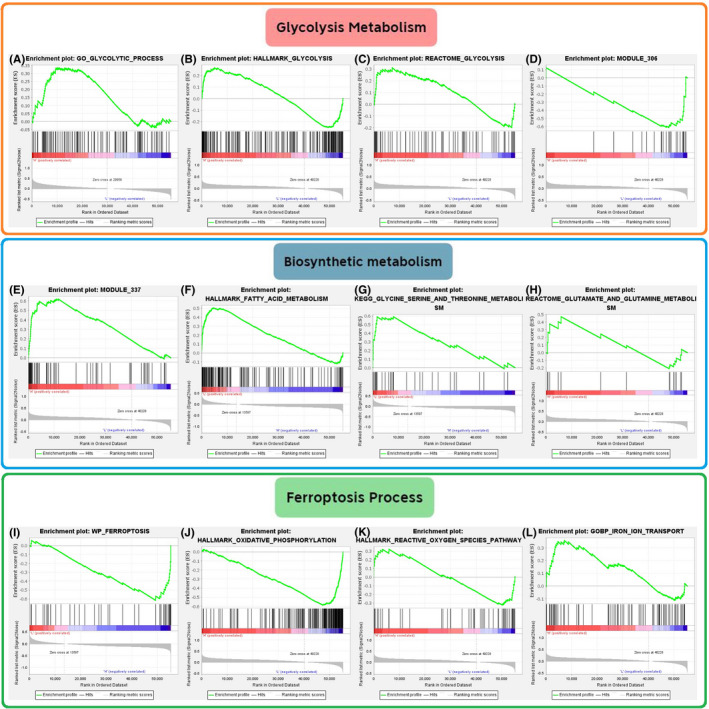
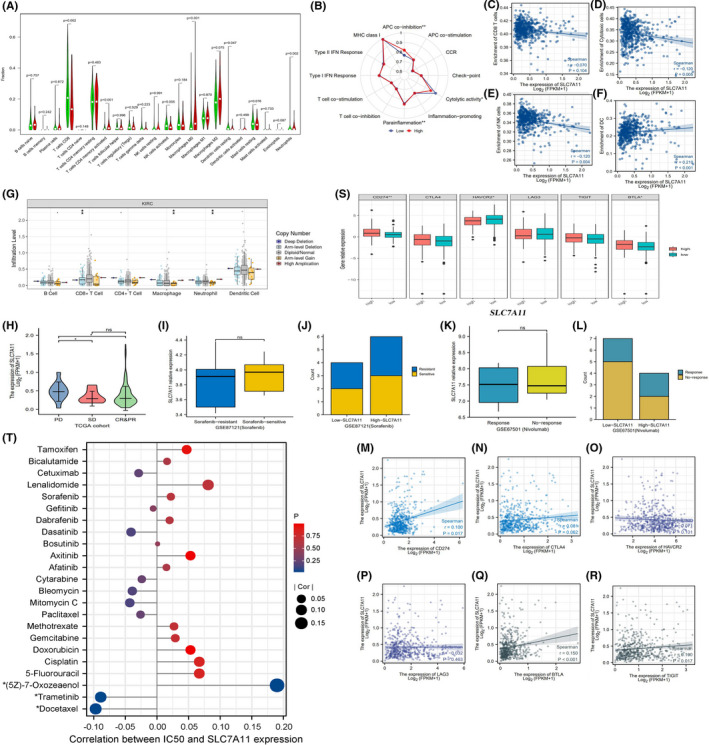
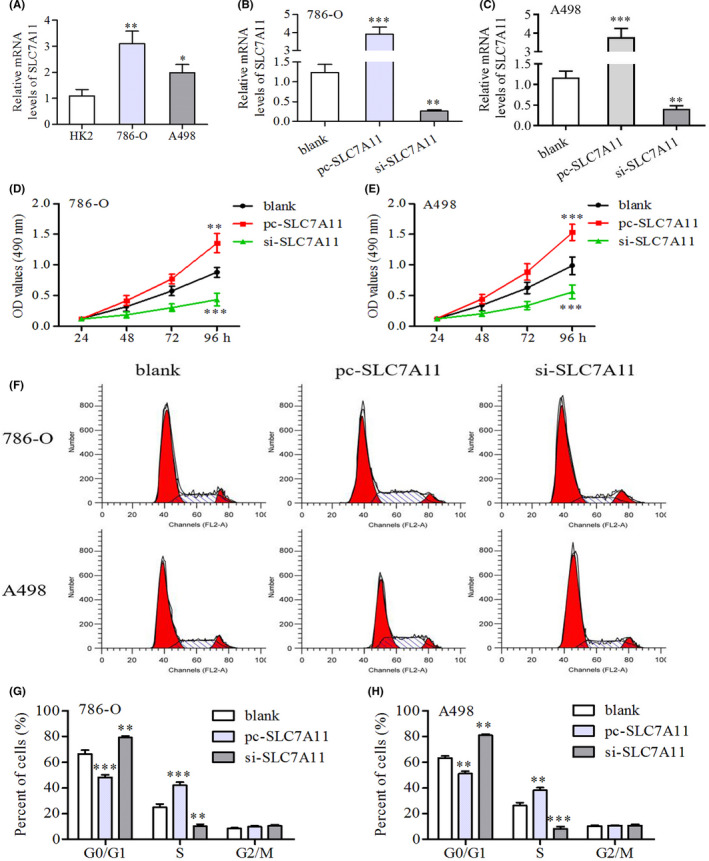
Methods: The expression and somatic mutation information of SLC7A11 in RCC samples were determined using The Cancer Genome Atlas (TCGA), International Cancer Genome Consortium (ICGC), Gene Expression Omnibus (GEO), Oncomine, and cBioPortal databases. The prognostic value of SLC7A11 was assessed through survival analysis, Receiver operating characteristic curve (ROC) analysis, independent prognostic analysis, clinical subgroup analysis, and nomogram. Its prognostic value was also validated in the ICGC and GSE29607 cohorts. Gene set enrichment analysis (GSEA) was employed to investigate the effects of SLC7A11 on multiple metabolic pathways. The CIBERSORT algorithm and single-sample gene set enrichment analysis (ssGSEA) method were applied to evaluate the effects of SLC7A11 on the tumor immune microenvironment (TIM). SLC7A11's therapeutic correlations were analyzed using the GSE87121, GSE67501, and GSDC datasets. Finally, the biofunctions of SLC7A11 in renal cancer cells and ferroptosis were ascertained by MTT, wound healing, transwell, and western blot assays.
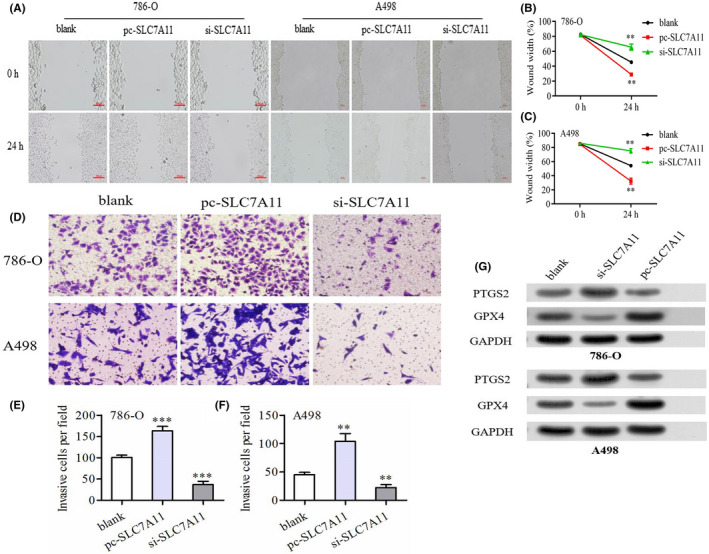
Results: Through multiple datasets, SLC7A11 was found to be markedly upregulated in RCC. In terms of prognosis, SLC7A11 overexpression conferred a worse prognosis and was identified as an independent prognostic factor. Its prognostic value was validated in ICGC cohort. Moreover, high SL7CA11 expression could stimulate nucleotides, fatty acids, and amino acid metabolism to meet the proliferative consumption of tumor cells. As for the immune effect, SLC7A11 suppressed antitumor immunity by reducing the abundances of CD8+ T and NK cells. Regarding the therapeutic response, SLC7A11 expression was not correlated with the sensitivities of most chemotherapy and targeted drugs. Finally, SLC7A11 promoted the proliferation, migration, and invasion of renal cancer cells by enhancing GPX4 output, which in turn inhibits ferroptosis.
Conclusions: SLC7A11 not only deeply influences RCC prognosis and TIM, but also promotes RCC progression by inhibiting ferroptosis and inducing metabolic reprogramming. In addition, SLC7A11 weakly affects the therapeutic effect and sensitivities of multiple chemotherapy and targeted drugs.
Keywords: SLC7A11; ferroptosis; metabolism; prognosis; renal cell carcinoma; tumor immune environment.
© 2021 The Authors. Cancer Medicine published by John Wiley & Sons Ltd.
Conflict of interest statement
The authors declare that they have no competing interests.
Figures
Similar articles
-
Expression and Prognostic Significance of Ferroptosis-related Proteins SLC7A11 and GPX4 in Renal Cell Carcinoma.Protein Pept Lett. 2023;30(10):868-876. doi: 10.2174/0109298665255704230920063254. Protein Pept Lett. 2023. PMID: 37807410 Free PMC article.
-
Silencing lncRNA SLC16A1-AS1 Induced Ferroptosis in Renal Cell Carcinoma Through miR-143-3p/SLC7A11 Signaling.Technol Cancer Res Treat. 2022 Jan-Dec;21:15330338221077803. doi: 10.1177/15330338221077803. Technol Cancer Res Treat. 2022. PMID: 35167383 Free PMC article.
-
Comprehensive analysis of new prognostic signature based on ferroptosis-related genes in clear cell renal cell carcinoma.Aging (Albany NY). 2021 Aug 9;13(15):19789-19804. doi: 10.18632/aging.203390. Epub 2021 Aug 9. Aging (Albany NY). 2021. PMID: 34370716 Free PMC article.
-
Cystine transporter SLC7A11/xCT in cancer: ferroptosis, nutrient dependency, and cancer therapy.Protein Cell. 2021 Aug;12(8):599-620. doi: 10.1007/s13238-020-00789-5. Epub 2020 Oct 1. Protein Cell. 2021. PMID: 33000412 Free PMC article. Review.
-
The amino acid transporter SLC7A11-mediated crosstalk implicated in cancer therapy and the tumor microenvironment.Biochem Pharmacol. 2022 Nov;205:115241. doi: 10.1016/j.bcp.2022.115241. Epub 2022 Sep 6. Biochem Pharmacol. 2022. PMID: 36084707 Review.
Cited by
-
Identification of key claudin genes associated with survival prognosis and diagnosis in colon cancer through integrated bioinformatic analysis.Front Genet. 2023 Sep 19;14:1221815. doi: 10.3389/fgene.2023.1221815. eCollection 2023. Front Genet. 2023. PMID: 37799140 Free PMC article.
-
Expression and Prognostic Significance of Ferroptosis-related Proteins SLC7A11 and GPX4 in Renal Cell Carcinoma.Protein Pept Lett. 2023;30(10):868-876. doi: 10.2174/0109298665255704230920063254. Protein Pept Lett. 2023. PMID: 37807410 Free PMC article.
-
Cuproptosis regulatory genes greatly contribute to clinical assessments of hepatocellular carcinoma.BMC Cancer. 2023 Jan 7;23(1):25. doi: 10.1186/s12885-022-10461-2. BMC Cancer. 2023. PMID: 36611155 Free PMC article.
-
SLC7A11: the Achilles heel of tumor?Front Immunol. 2024 Jul 8;15:1438807. doi: 10.3389/fimmu.2024.1438807. eCollection 2024. Front Immunol. 2024. PMID: 39040097 Free PMC article. Review.
-
Expression of ferroptosis-related gene correlates with immune microenvironment and predicts prognosis in gastric cancer.Sci Rep. 2022 May 24;12(1):8785. doi: 10.1038/s41598-022-12800-6. Sci Rep. 2022. PMID: 35610340 Free PMC article.
References
-
- Siegel RL, Miller KD, Fuchs HE, Jemal A. Cancer statistics, 2021. CA Cancer J Clin. 2021;71(1):7‐33. - PubMed
Publication types
MeSH terms
LinkOut - more resources
Full Text Sources
Medical
Research Materials
