

The effect of stimulus duration on preferences for gain adjustments when listening to speech
- PMID: 34762024
- PMCID: PMC7613777
- DOI: 10.1080/14992027.2021.1998676
The effect of stimulus duration on preferences for gain adjustments when listening to speech
Abstract
Objectives: In the personalisation of hearing-aid fittings, gain is often adjusted to suit patient preferences using live speech. When using brief sentences as stimuli, the minimum gain adjustments necessary to elicit consistent preferences ("preference thresholds") were previously found to be much greater than typical adjustments in current practice. The current study examined the role of duration on preference thresholds.
Design: Participants heard 2, 4 and 6-s segments of a continuous monologue presented successively in pairs. The first segment of each pair was presented at each individual's real-ear or prescribed gain. The second segment was presented with a ±0-12 dB gain adjustment in one of three frequency bands. Participants judged whether the second was "better", "worse" or "no different" from the first.
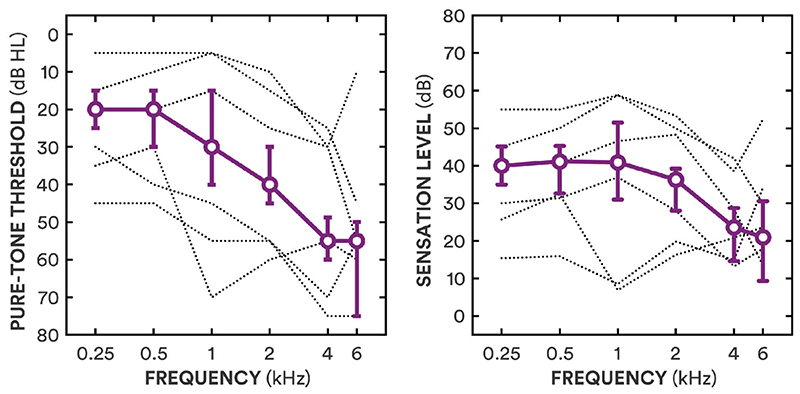
Study sample: Twenty-nine adults, all with hearing-aid experience.
Results: The minimum gain adjustments needed to elicit "better" or "worse" judgments decreased with increasing duration for most adjustments. Inter-participant agreement and intra-participant reliability increased with increasing duration up to 4 s, then remained stable.
Conclusions: Providing longer stimuli improves the likelihood of patients providing reliable judgments of hearing-aid gain adjustments, but the effect is limited, and alternative fitting methods may be more viable for effective hearing-aid personalisation.
Keywords: Hearing-aid fitting; duration; fine-tuning; gain.
Conflict of interest statement
No potential conflict of interest was reported by the author(s).
Figures


Similar articles
-
The perceptual limitations of troubleshooting hearing-aids based on patients' descriptions.Int J Audiol. 2021 Jun;60(6):427-437. doi: 10.1080/14992027.2020.1839679. Epub 2020 Nov 11. Int J Audiol. 2021. PMID: 33176515
-
An initial-fit comparison of two generic hearing aid prescriptive methods (NAL-NL2 and CAM2) to individuals having mild to moderately severe high-frequency hearing loss.J Am Acad Audiol. 2013 Feb;24(2):138-50. doi: 10.3766/jaaa.24.2.7. J Am Acad Audiol. 2013. PMID: 23357807 Clinical Trial.
-
Cortical auditory-evoked potentials (CAEPs) in adults in response to filtered speech stimuli.J Am Acad Audiol. 2013 Oct;24(9):807-22. doi: 10.3766/jaaa.24.9.5. J Am Acad Audiol. 2013. PMID: 24224988
-
Is normal or less than normal overall loudness preferred by first-time hearing aid users?Ear Hear. 2004 Apr;25(2):159-72. doi: 10.1097/01.aud.0000120364.13671.e2. Ear Hear. 2004. PMID: 15064661 Clinical Trial.
-
Implantable Devices for Single-Sided Deafness and Conductive or Mixed Hearing Loss: A Health Technology Assessment.Ont Health Technol Assess Ser. 2020 Mar 6;20(1):1-165. eCollection 2020. Ont Health Technol Assess Ser. 2020. PMID: 32194878 Free PMC article.
References
-
- Bartha-Doering L, Deuster D, Giordano V, Am Zehnhoff-Dinnesen A, Dobel C. A Systematic Review of the Mismatch Negativity as an Index for Auditory Sensory Memory: From Basic Research to Clinical and Developmental Perspectives. Psychophysiology. 2015;52(9):1115–1130. doi: 10.1111/psyp.12459. - DOI - PubMed
-
- British Academy of Audiology. Guidance for Audiologists: Onward Referral of Adults with Hearing Difficulty Directly Referred to Audiology Services. 2016. https://www.baaudiology.org/app/uploads/2019/07/BAA_Guidance_for_Onward_... .
Publication types
MeSH terms
Grants and funding
LinkOut - more resources
Full Text Sources
Medical
Miscellaneous