. 2021 Nov 12;374(6569):848-856.
doi: 10.1126/science.abh3602. Epub 2021 Nov 11.

Bioactive scaffolds with enhanced supramolecular motion promote recovery from spinal cord injury

Affiliations

Bioactive scaffolds with enhanced supramolecular motion promote recovery from spinal cord injury

Z Álvarez et al. Science. .

Abstract

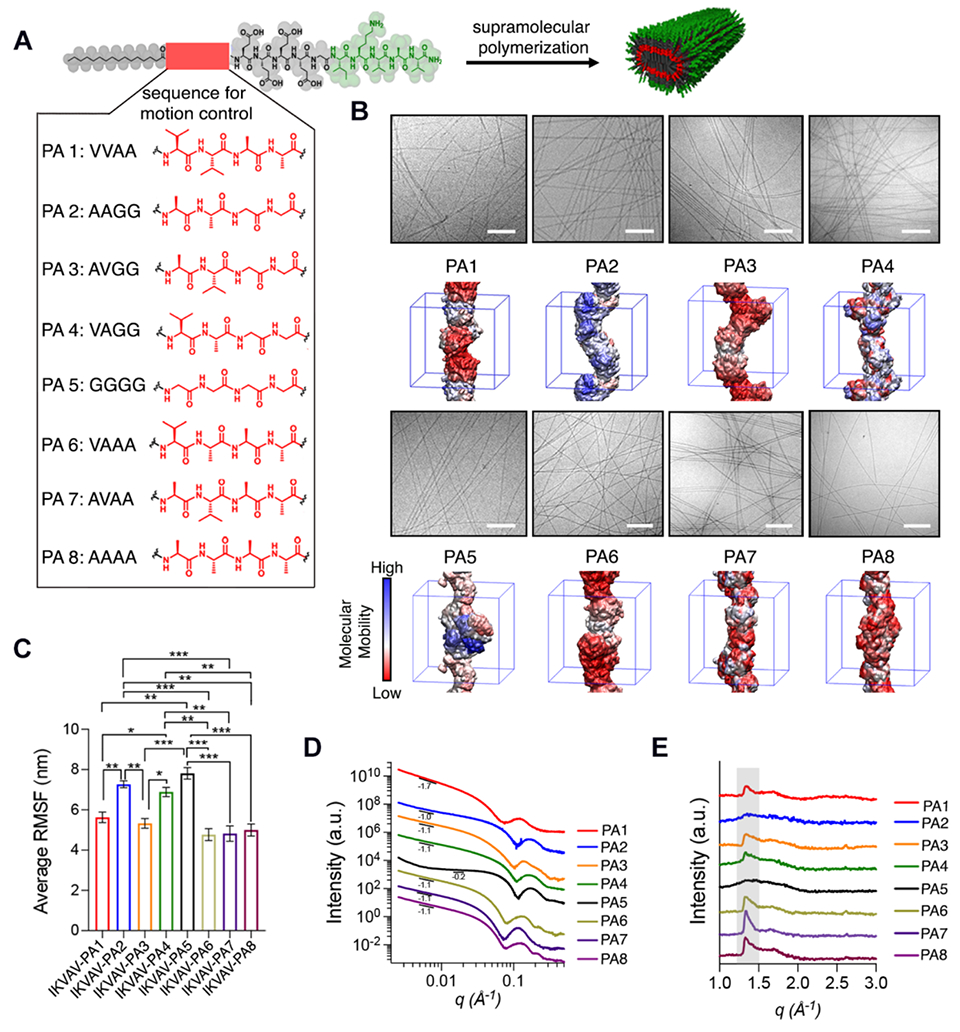
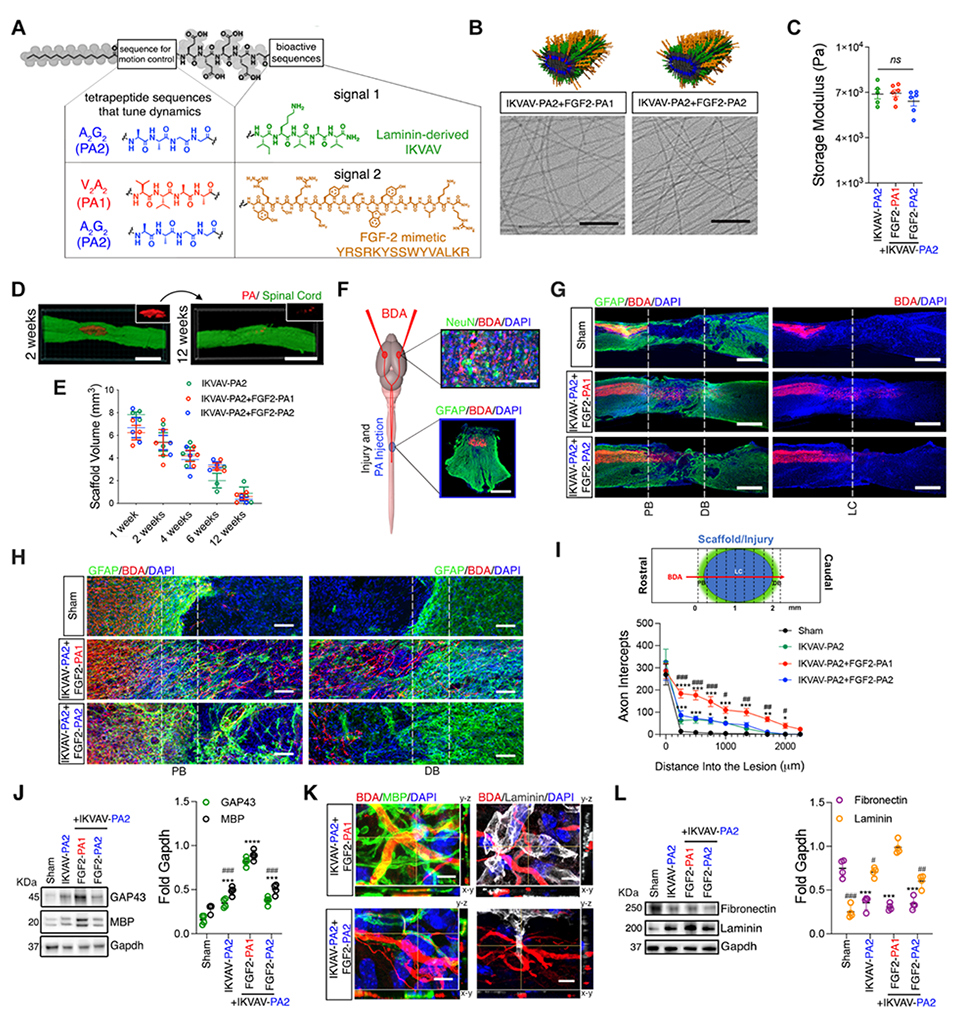
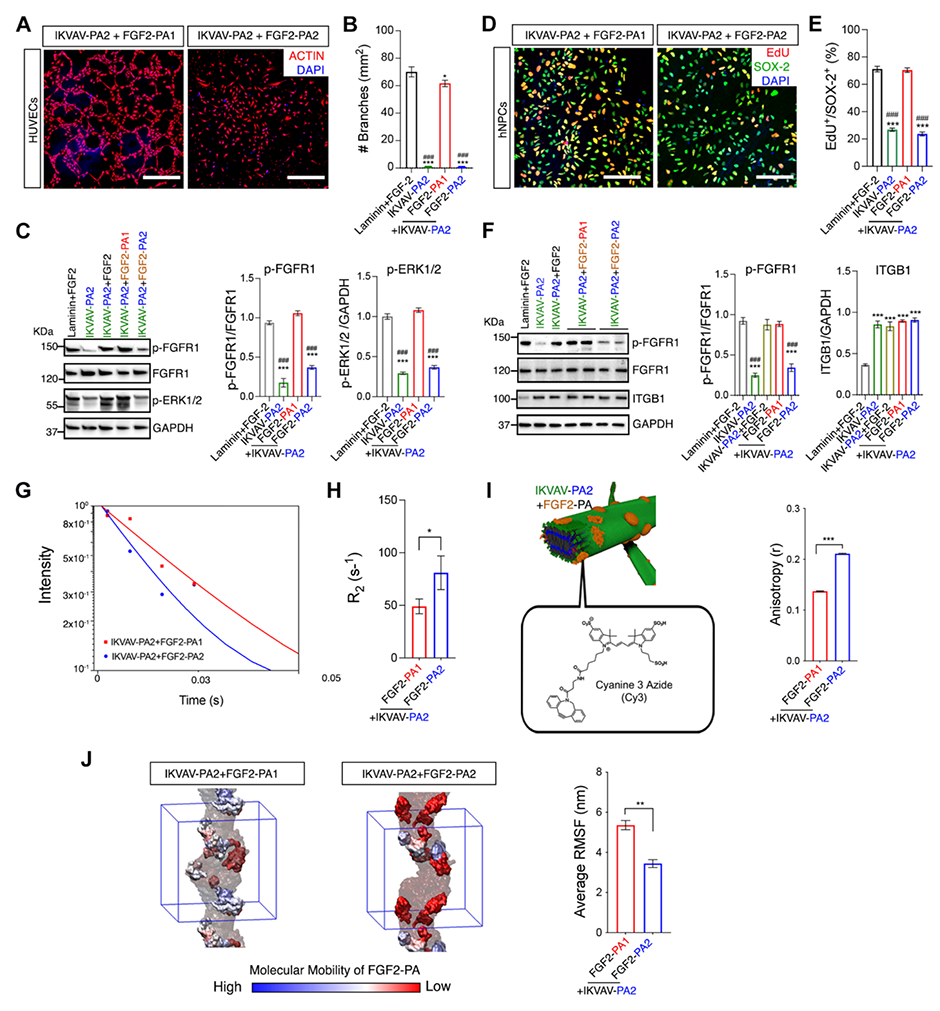
The signaling of cells by scaffolds of synthetic molecules that mimic proteins is known to be effective in the regeneration of tissues. Here, we describe peptide amphiphile supramolecular polymers containing two distinct signals and test them in a mouse model of severe spinal cord injury. One signal activates the transmembrane receptor β1-integrin and a second one activates the basic fibroblast growth factor 2 receptor. By mutating the peptide sequence of the amphiphilic monomers in nonbioactive domains, we intensified the motions of molecules within scaffold fibrils. This resulted in notable differences in vascular growth, axonal regeneration, myelination, survival of motor neurons, reduced gliosis, and functional recovery. We hypothesize that the signaling of cells by ensembles of molecules could be optimized by tuning their internal motions.


Conflict of interest statement

Competing interests: A patent pertaining to this work has been filed and is pending: Supramolecular Motion in Bioactive Scaffolds Promotes Recovery from Spinal Cord Injury (inventors: Zaida Alvarez Pinto; Samuel I. Stupp).

Figures

Fig. 1.
Fig. 1.. Library of investigated IKVAV PA molecules.
(A) Specific chemical structures of IKVAV PA molecules used and molecular graphics representation of a supramolecular nanofiber displaying the IKVAV bioactive signal. (B) Cryo-TEM micrographs of IKVAV PAs in the library and their corresponding color-coded representation of RMSF values for single IKVAV PA filaments. (C) Bar graphs of the average RMSF values of the different IKVAV PA molecules (error bars correspond to 3 independent simulations; *P<0.05, **P<0.01, ***P<0.001, one-way ANOVA with Bonferroni). (D) SAXS scattering patterns and (E) WAXS profiles of the different IKVAV PA nanofibers (the scattering intensities were offset vertically for clarity; the Bragg peak corresponding to the β-sheet spacing around 1.35 Å is framed in a gray box). Scale bars: 200 nm.
Fig. 2.
Fig. 2.. Effect of supramolecular motion on hNPCs signaling in vitro.
(A) Molecular graphics representation of an IKVAV PA nanofiber indicating the chemical structure and location of DPH used as a probe in fluorescence depolarization measurements (top); bar graph of fluorescence anisotropy of IKVAV PA solutions (error bars correspond to 3 independent experiments; n.s. no significant, ***P<0.0001, one-way ANOVA with Bonferroni). (B) Chemical structure of the IKVAV peptide sequence highlighting the K residue probed by NMR (top); bar graphs of the K relaxation time for the different IKVAV PAs investigated (error bars correspond to 3 runs per condition; ***P<0.0001 vs IKVAV PA1, #P<0.05, ###P<0.0001 vs IKVAV PA2 and +P<0.05, +++P<0.0001 vs IKVAV PA5, one-way ANOVA with Bonferroni). (C) Differentiation conditions used for hNPCs. (D) Representative micrographs of hNPCs treated with IKVAV PA1, PA2, PA4 and PA5; NESTIN-stem cells (red), ITGB1-receptor (green), and DAPI-nuclei (blue). (E) WB results of ITGB1, p-FAK, FAK, ILK, and TUJ-1 in hNPCs treated with laminin and the various IKVAV PAs. (F) Representative confocal micrographs of hNPCs treated with IKVAV PA1, PA2, PA4 and PA5; NESTIN-stem cells (red), SOX-2-stem cells (green), TUJ-1-neurons (white), and DAPI-nuclei (blue). (G, H) Bar graphs of the percentage of SOX-2+ and NESTIN+-stem cells (G) and TUJ-1+ cells (H) treated with the various IKVAV PAs (error bars correspond to 3 independent differentiations; **P<0.01, ***P<0.001 vs IKVAV PA2 and ##P<0.01, ###P<0.001 vs IKVAV PA5, one-way ANOVA with Bonferroni). (I) Fluorescence anisotropy (left) and K residue relaxation times (right) obtained for IKVAV PA2 nanofibers in the absence (No Ca2+) or presence (Ca2+) of calcium ions (***P<0.001, student’s t-test). (J) WB results of ITGB1, p-FAK, FAK, ILK, TUJ-1 in hNPCs treated with IKVAV PA2 in the absence (−) or presence (+) of Ca2+. Scale bars: (D) 10 μm, (F) 100 μm.
Fig. 3.
Fig. 3.. Two chemically different PA scaffolds with two identical bioactive sequences reveal differences in growth of corticospinal axons after SCI.
(A) Chemical structures of the two PA molecules used. (B) Molecular graphics representation of a supramolecular nanofiber displaying two bioactive signals (top); cryo-TEM micrographs of IKVAV PA2 co-assembled with FGF2 PAs (FGF2 PA1 and FGF2 PA2) (bottom). (C) Storage modulus of IKVAV PA2 (green) and their respective co-assemblies with FGF2 PAs (FGF2 PA1, red and FGF2 PA2, blue). (D) Fluorescent micrographs of spinal cords (green) injected with IKVAV PA2+FGF2 PA1 (red) covalently labeled with Alexa 647. (E) Plot of PA scaffold volume as a function of time after implantation. (F) Schematic illustration showing the site of BDA and PA injections (left); fluorescent micrographs of the brain cortex (top, right); NeuN-neurons (green), BDA-labelled neurons (red) and DAPI-nuclei (blue) and transverse spinal cord section stained for GFAP-astrocytes (green), BDA-labelled descending axons (red) and DAPI-nuclei (blue) (bottom, right). (G) Fluorescent micrographs of longitudinal spinal cord sections in sham, IKVAV PA2+FGF2 PA1, and IKVAV PA2+FGF2 PA2 groups; GFAP-astrocytes (green), BDA-labelled axons (red) and DAPI-nuclei (blue); vertical white dashed lines indicate the proximal border (PB), the distal border (DB), and the central part of the lesion (LC). (H) Representative magnified images for those in G. (I) Schematic lesion site and vertical lines used to count the number of axons crossing at each location indicated (top); plot of the number of crossing axons (bottom) (error bars correspond to 6 animals per group; *P<0.05, **P<0.01, ***P<0.001 vs sham and #P<0.05, ##P<0.01, ###P<0.001 vs IKVAV PA2 and IKVAV PA2+FGF2 PA2 groups, repeated measures of two-way ANOVA with Bonferroni). (J) WB results (left) and dot plot of the normalized values for GAP43 and MBP protein in sham, IKVAV PA2, IKVAV PA2+FGF2 PA1, and IKVAV PA2+FGF2 PA2 (right) (**P<0.01, ***P<0.001 vs sham and ###P<0.001 vs IKVAV PA2+FGF2 PA1 group, one-way ANOVA with Bonferroni). (K) Representative 3D fluorescent micrographs of BDA-labelled axon regrowth (red) and myelin basic protein (MBP, green) (left) and laminin (white) (right). (L) WB results (left) and dot plot of the normalized values for laminin and fibronectin expression in conditions described in J (right) (***P<0.001 vs sham and #P<0.05, ##P<0.01, ###P<0.001 vs IKVAV PA2+FGF2 PA1 group, one-way ANOVA with Bonferroni). Data points in E correspond to 3 animals per group and to 4 animals per group in J and L. Scale bars: (D, G) 1500 μm, (F) 25 μm (top) and 200 μm (bottom), (H) 100 μm, and (K) 25 μm.
Fig. 4.
Fig. 4.. Two chemically different PA scaffolds with two identical bioactive sequences reveal differences in angiogenesis.
(A) Fluorescent micrographs of transverse spinal cord sections in uninjured, IKVAV PA2+FGF2 PA1, IKVAV PA2+FGF2 PA2 and sham groups; GFAP-astrocytes (green), DiI-labelled blood vessels (red), and DAPI-nuclei (blue). (B) Dot plots of the vascular area fraction, perfused vascular length, and number of branches in the transverse sections of groups in A (*P<0.05, ***P<0.0001 vs sham and ##P<0.001, ###P<0.0001 vs IKVAV PA2+FGF2 PA1 group, one-way ANOVA with Bonferroni). (C) Fluorescent images of BrdU+/CD31+ cells in the center of the lesion in animals injected with IKVAV PA2+FGF2 PA1 and IKVAV PA2+FGF2 PA2; CD31-blood vessels (green), BrdU-newly generated cells (red), and DAPI-nuclei (blue). (D) Dot plot of the number of BrdU+/CD31+ cells per mm2 in groups treated with IKVAV PA2 alone, IKVAV PA2+FGF2 PA1, IKVAV PA2+FGF2 PA2, and saline (sham) (*P<0.05, ***P<0.001 vs sham and ###P<0.0001 vs IKVAV PA2+FGF2 PA1 group, one-way ANOVA with Bonferroni). (E) WB results (left) and plot of the normalized values for CD31 protein (right) (**P<0.001, ***P<0.0001 vs sham and ###P<0.001 vs IKVAV PA2+FGF2 PA1 group one-way ANOVA with Bonferroni). Data points in B and D correspond to 6 animals per group and to 4 animals per group in E. Scale bars: (A) 200 μm, (C) 25 μm.
Fig. 5.
Fig. 5.. Two chemically different PA scaffolds with two identical bioactive sequences reveal differences in neuronal survival and functional recovery.
(A) Fluorescent micrographs of transverse spinal cord sections corresponding to uninjured, IKVAV PA2+FGF2 PA1, IKVAV PA2+FGF2 PA2 and sham groups; NeuN-neurons (green), DiI-labelled blood vessels (red) and DAPI-nuclei (blue), dashed lines indicate the grey matter (horn). (B) High-magnification images of the ventral horn area for slices in A (left); NeuN-neurons (green), DiI-labelled blood vessels (red), and DAPI-nuclei (blue); ChAT-motor neurons (green), DiI-labelled blood vessels (red), and DAPI-nuclei (blue) (right). (C) Dot plots showing the number of NeuN+ (left) and ChAT+ (right) cells per transverse section (data points correspond to a total of 48 sections; 8 sections per animal and 6 animals per group; **P<0.01, ***P<0.001 vs sham and ###P<0.001 vs IKVAV PA2+FGF2 PA1 group, one-way ANOVA with Bonferroni). (D) Experimental timeline of in vivo experiments (top) and Basso Mouse Scale (BMS) for locomotion (bottom) (error bars correspond to 38 animals per group; **P<0.001, ***P<0.0001 all PA groups vs sham and ###P<0.0001 vs IKVAV PA2+FGF2 PA2 and IKVAV PA2 groups by repeated measures of two-way ANOVA with Bonferroni). Scale bars: (A) 200 μm, (B) 25 μm.
Fig. 6.
Fig. 6.. Validating cell signaling differences in vitro between two PA scaffolds exhibiting different supramolecular motion.
(A) Confocal micrographs of HUVECs treated with IKVAV PA2+FGF2 PA1 and IKVAV PA2+FGF2 PA2; ACTIN-cytoskeleton (red), DAPI-nuclei (blue). (B) Dot plot of the number of branches per mm3 in HUVECs treated with laminin+FGF-2, IKVAV PA2 alone, IKVAV PA2+FGF2 PA1, and IKVAV PA2+FGF2 PA2. (C) WB results (left) and dot plot of the normalized values for active FGFR1 (p-FGFR1) vs total FGFR1 (FGFR1) and active ERK1/2 (p-ERK1/2) using the conditions in B (right). (D) Confocal micrographs of hNPCs on coatings of IKVAV PA2+FGF2 PA1 and IKVAV PA2+FGF2 PA2; EDU-proliferative marker (red), SOX-2-neural stem cell marker (green), and DAPI-nuclei (blue). (E) Dot plot of the percentage of EDU+/SOX-2+ cells on the various coatings. (F) WB results (left) and plot of the normalized values for active FGFR1 (p-FGFR1) vs total FGFR1 (FGFR1) and β1 INTEGRIN (ITGB1) (right). (G) 1H-NMR spin-spin relaxation time of the aromatic protons in Y and W amino acids in the FGF2 mimetic signal at 6.81 ppm (solid lines are single linear best fits). (H) Graph of the aromatic relaxation times measured in G (error bars correspond to 3 runs per condition; *P<0.05 student’s t-test). (I) Fluorescence anisotropy of solutions measured by fluorescent depolarization of FGF2 PAs chemically modified with Cy3 dye (error bars correspond to 3 independent experiments; ***P<0.001 student’s t-test). (J) Color-coded representation of RMSF values in clusters of FGF2 PAs (left) and the corresponding bar graph (right) (IKVAV PA2 molecules are shown in transparent grey, ions and water molecules are removed for clarity, and the simulation box is shown in blue) (error bars correspond to 5 independent simulations; **P<0.01 Student’s T-test). Error bars in B and E correspond to 3 independent experiments and C and F correspond to 4 independent experiments per condition; ***P<0.0001 vs Laminin+FGF2 and ###p<0.0001 vs IKVAV PA2+FGF2 PA1, one-way ANOVA with Bonferroni. Scale bars: (A) 200 μm, (D) 100 μm.

Comment in

  • A dynamic duo.
    Wojciechowski JP, Stevens MM. Wojciechowski JP, et al. Science. 2021 Nov 12;374(6569):825-826. doi: 10.1126/science.abm3881. Epub 2021 Nov 11. Science. 2021. PMID: 34762463

References

    1. Silva GA et al., Selective differentiation of neural progenitor cells by high-epitope density nanofibers. Science 303, 1352–1355 (2004). - PubMed
    1. Discher DE, Mooney DJ, Zandstra PW, Growth factors, matrices, and forces combine and control stem cells. Science 324, 1673–1677 (2009). - PMC - PubMed
    1. Brandley BK, Schnaar RL, Covalent attachment of an Arg-Gly-Asp sequece peptide to derivatizable polyacrylamide surfaces: Support of fibroblast adhesion and long-term growth. Anal Biochem 172, 270–278 (1988). - PubMed
    1. Hartgerink JD, Beniash E, Stupp SI, Self-assembly and mineralization of peptide-amphiphile nanofibers. Science 294, 1684–1688 (2001). - PubMed
    1. Aida T, Meijer EW, Stupp SI, Functional supramolecular polymers. Science 335, 813–817 (2012). - PMC - PubMed

Publication types

MeSH terms