

Origins and evolution of extreme life span in Pacific Ocean rockfishes
- PMID: 34762458
- PMCID: PMC8923369
- DOI: 10.1126/science.abg5332
Origins and evolution of extreme life span in Pacific Ocean rockfishes
Abstract
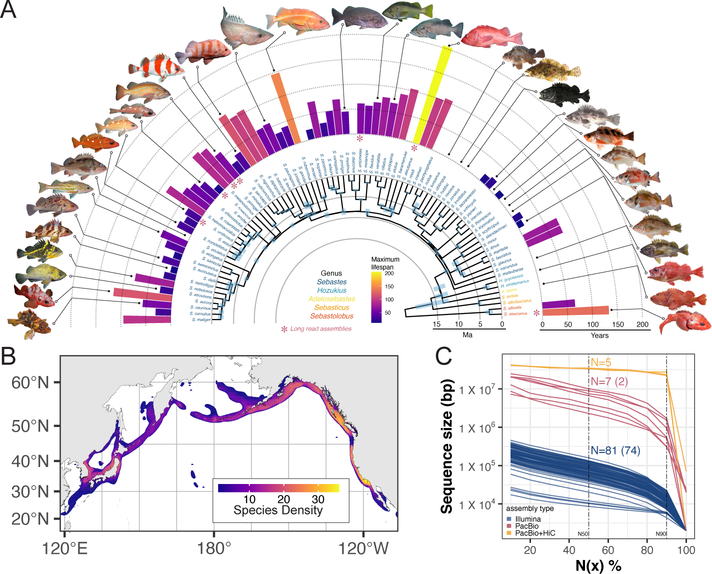
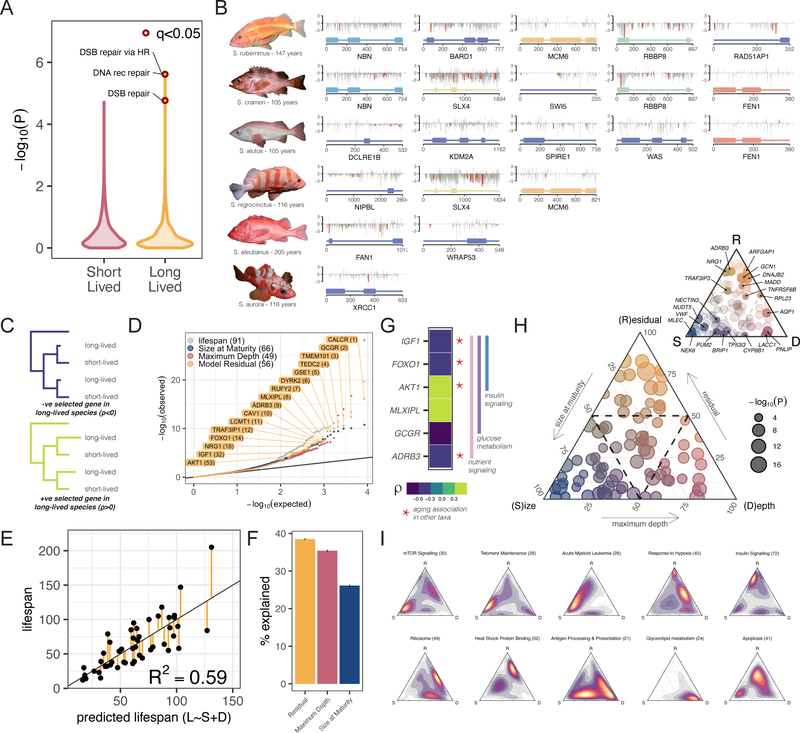
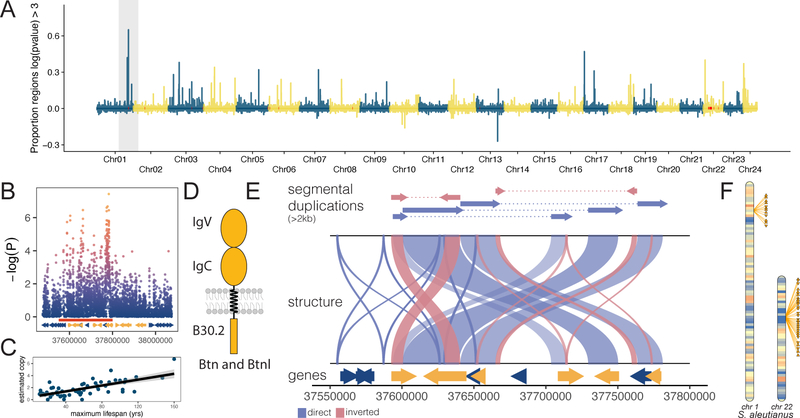
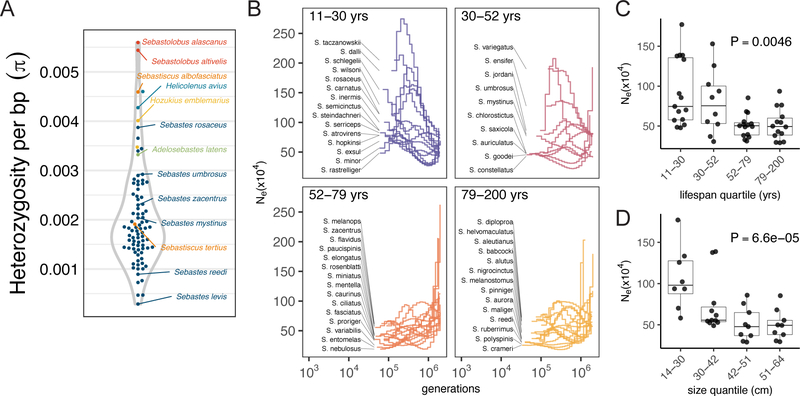
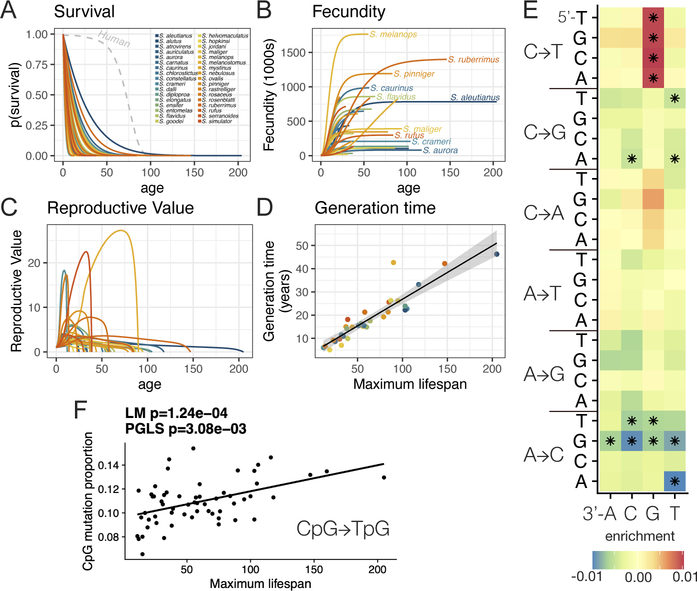
Pacific Ocean rockfishes (genus Sebastes) exhibit extreme variation in life span, with some species being among the most long-lived extant vertebrates. We de novo assembled the genomes of 88 rockfish species and from these identified repeated signatures of positive selection in DNA repair pathways in long-lived taxa and 137 longevity-associated genes with direct effects on life span through insulin signaling and with pleiotropic effects through size and environmental adaptations. A genome-wide screen of structural variation reveals copy number expansions in the immune modulatory butyrophilin gene family in long-lived species. The evolution of different rockfish life histories is coupled to genetic diversity and reshapes the mutational spectrum driving segregating CpG→TpG variants in long-lived species. These analyses highlight the genetic innovations that underlie life history trait adaptations and, in turn, how they shape genomic diversity.
Conflict of interest statement
Figures
Comment in
-
Long-lived fish in a big pond.Science. 2021 Nov 12;374(6569):824-825. doi: 10.1126/science.abm3392. Epub 2021 Nov 11. Science. 2021. PMID: 34762450
Similar articles
-
Convergent genomics of longevity in rockfishes highlights the genetics of human life span variation.Sci Adv. 2023 Jan 13;9(2):eadd2743. doi: 10.1126/sciadv.add2743. Epub 2023 Jan 11. Sci Adv. 2023. PMID: 36630509 Free PMC article.
-
Regions of genetic divergence in depth-separated Sebastes rockfish species pairs: Depth as a potential driver of speciation.Mol Ecol. 2021 Sep;30(17):4259-4275. doi: 10.1111/mec.16046. Epub 2021 Jul 10. Mol Ecol. 2021. PMID: 34181798
-
Gonadal transcriptomics elucidate patterns of adaptive evolution within marine rockfishes (Sebastes).BMC Genomics. 2015 Sep 2;16(1):656. doi: 10.1186/s12864-015-1870-0. BMC Genomics. 2015. PMID: 26329285 Free PMC article.
-
Selection for maximum longevity in mice.Exp Gerontol. 1997 Jan-Apr;32(1-2):65-78. doi: 10.1016/s0531-5565(96)00034-4. Exp Gerontol. 1997. PMID: 9088903 Review.
-
Pleiotropy, constraint, and modularity in the evolution of life histories: insights from genomic analyses.Ann N Y Acad Sci. 2017 Feb;1389(1):76-91. doi: 10.1111/nyas.13256. Epub 2016 Dec 9. Ann N Y Acad Sci. 2017. PMID: 27936291 Free PMC article. Review.
Cited by
-
Understanding the evolution of immune genes in jawed vertebrates.J Evol Biol. 2023 Jun;36(6):847-873. doi: 10.1111/jeb.14181. Epub 2023 May 31. J Evol Biol. 2023. PMID: 37255207 Free PMC article. Review.
-
The Palaeozoic assembly of the holocephalan body plan far preceded post-Cretaceous radiations into the ocean depths.Proc Biol Sci. 2024 Oct;291(2033):20241824. doi: 10.1098/rspb.2024.1824. Epub 2024 Oct 30. Proc Biol Sci. 2024. PMID: 39471859
-
A latitudinal gradient of deep-sea invasions for marine fishes.Nat Commun. 2023 Feb 11;14(1):773. doi: 10.1038/s41467-023-36501-4. Nat Commun. 2023. PMID: 36774385 Free PMC article.
-
Whole-genome comparisons identify repeated regulatory changes underlying convergent appendage evolution in diverse fish lineages.bioRxiv [Preprint]. 2023 Jan 31:2023.01.30.526059. doi: 10.1101/2023.01.30.526059. bioRxiv. 2023. Update in: Mol Biol Evol. 2023 Sep 1;40(9):msad188. doi: 10.1093/molbev/msad188. PMID: 36778215 Free PMC article. Updated. Preprint.
-
Reservoir host immunology and life history shape virulence evolution in zoonotic viruses.PLoS Biol. 2023 Sep 7;21(9):e3002268. doi: 10.1371/journal.pbio.3002268. eCollection 2023 Sep. PLoS Biol. 2023. PMID: 37676899 Free PMC article.
References
-
- Depczynski M, Bellwood DR, Shortest recorded vertebrate lifespan found in a coral reef fish. Current Biology. 15, R288–R289 (2005). - PubMed
-
- Nielsen J, Hedeholm RB, Heinemeier J, Bushnell PG, Christiansen JS, Olsen J, Ramsey CB, Brill RW, Simon M, Steffensen KF, Steffensen JF, Eye lens radiocarbon reveals centuries of longevity in the Greenland shark (Somniosus microcephalus). Science. 353, 702–704 (2016). - PubMed
Publication types
MeSH terms
Substances
Grants and funding
LinkOut - more resources
Full Text Sources
