. 2021 Nov 12;374(6569):eabi7489.
doi: 10.1126/science.abi7489. Epub 2021 Nov 12.

The genetic and epigenetic landscape of the Arabidopsis centromeres

Affiliations

The genetic and epigenetic landscape of the Arabidopsis centromeres

Matthew Naish et al. Science. .

Abstract

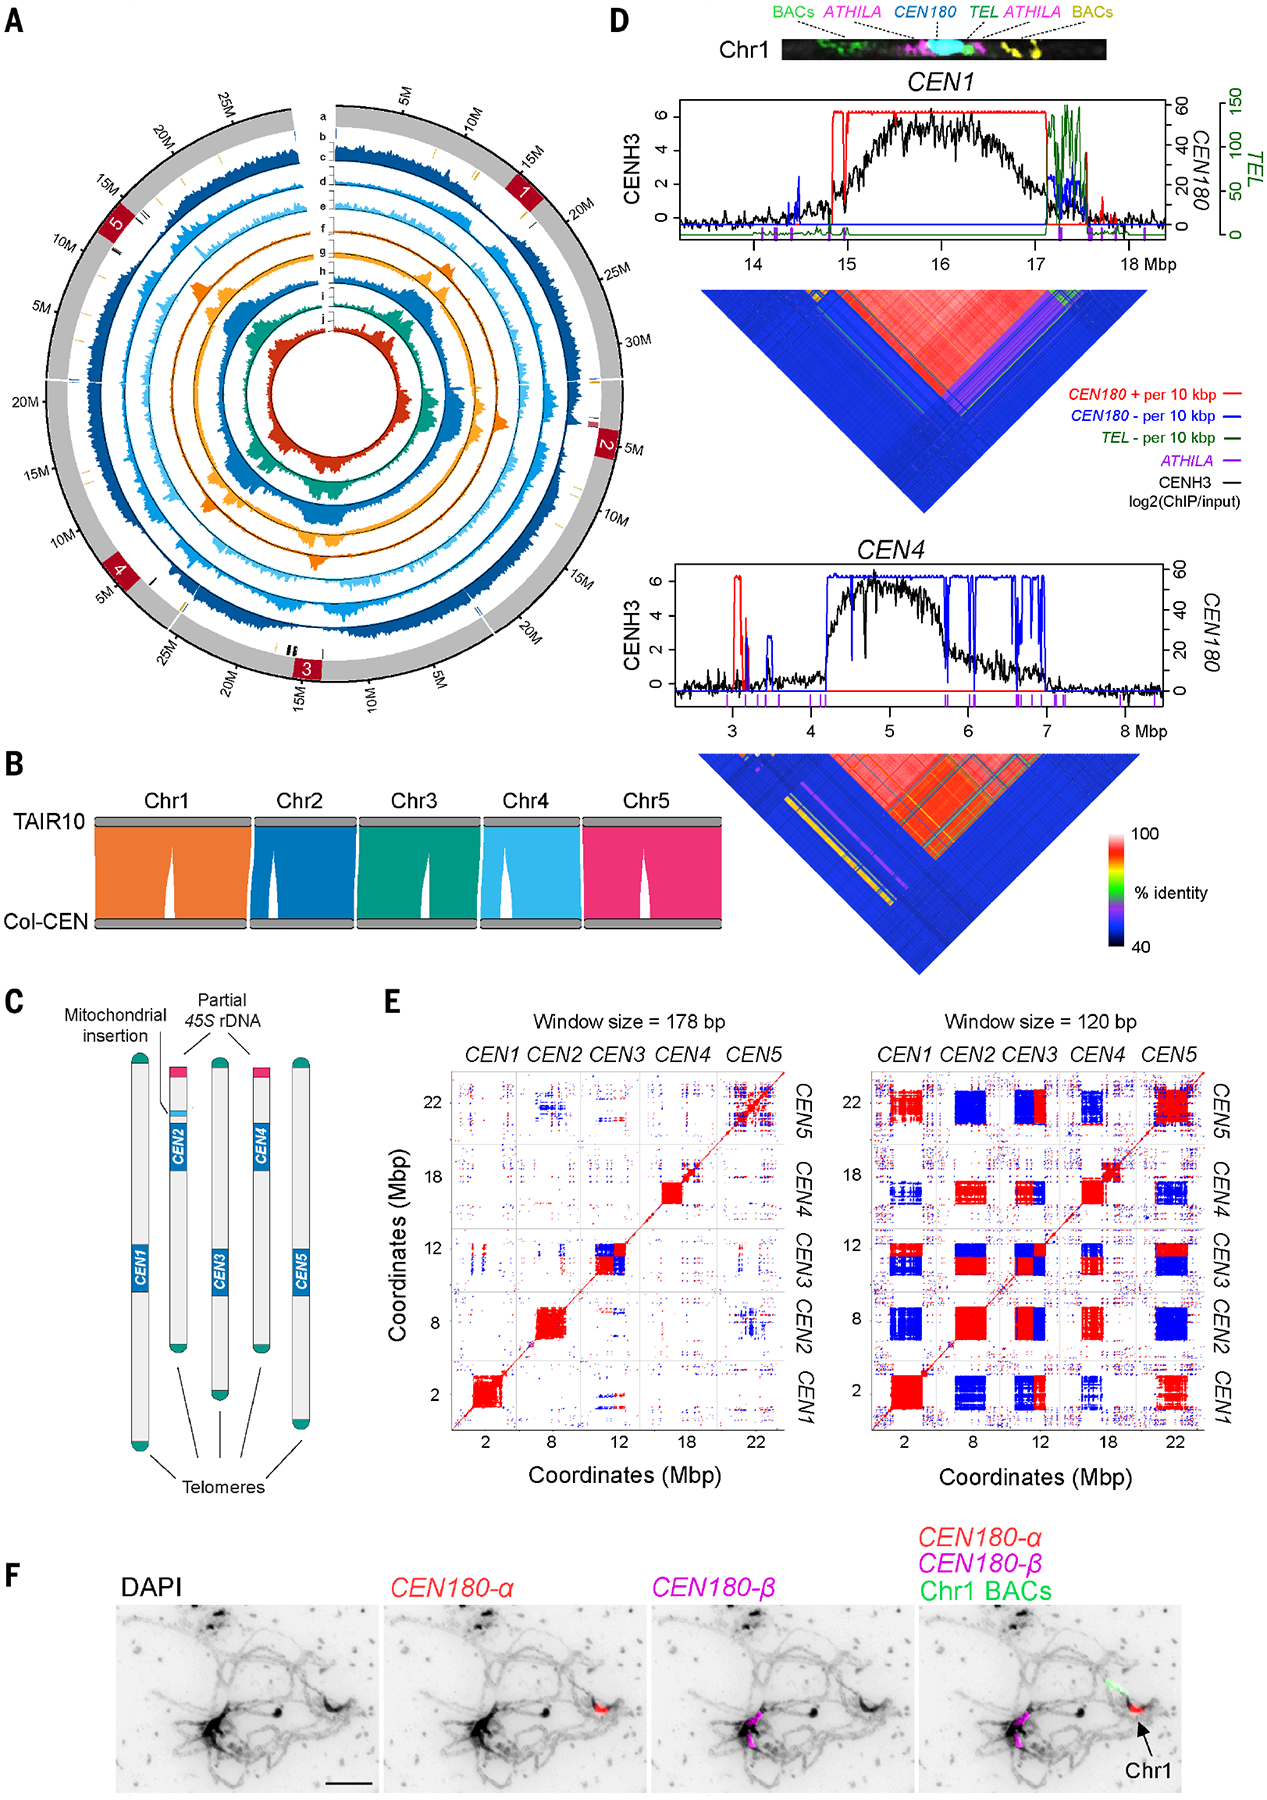
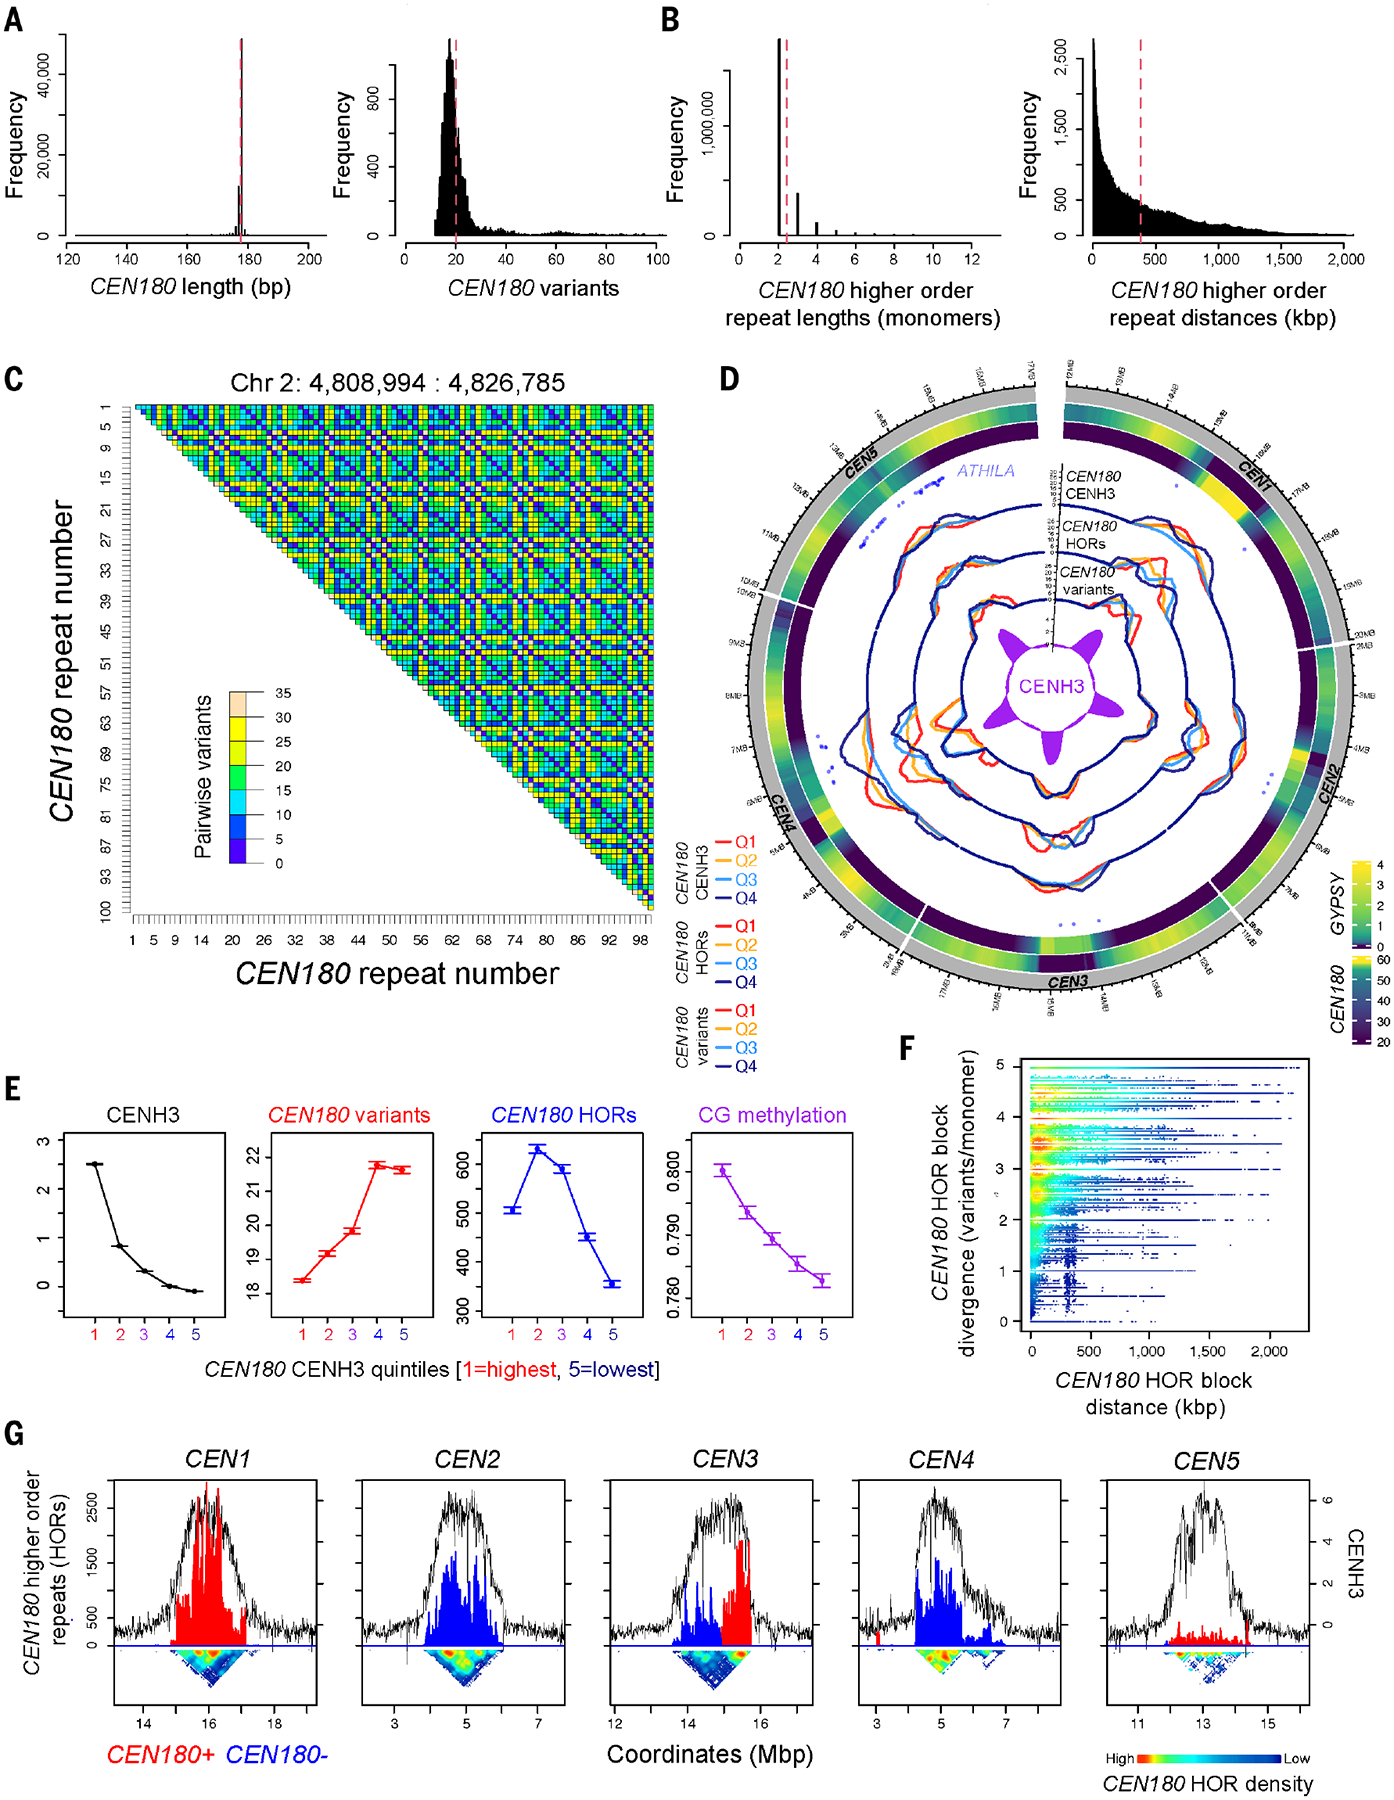
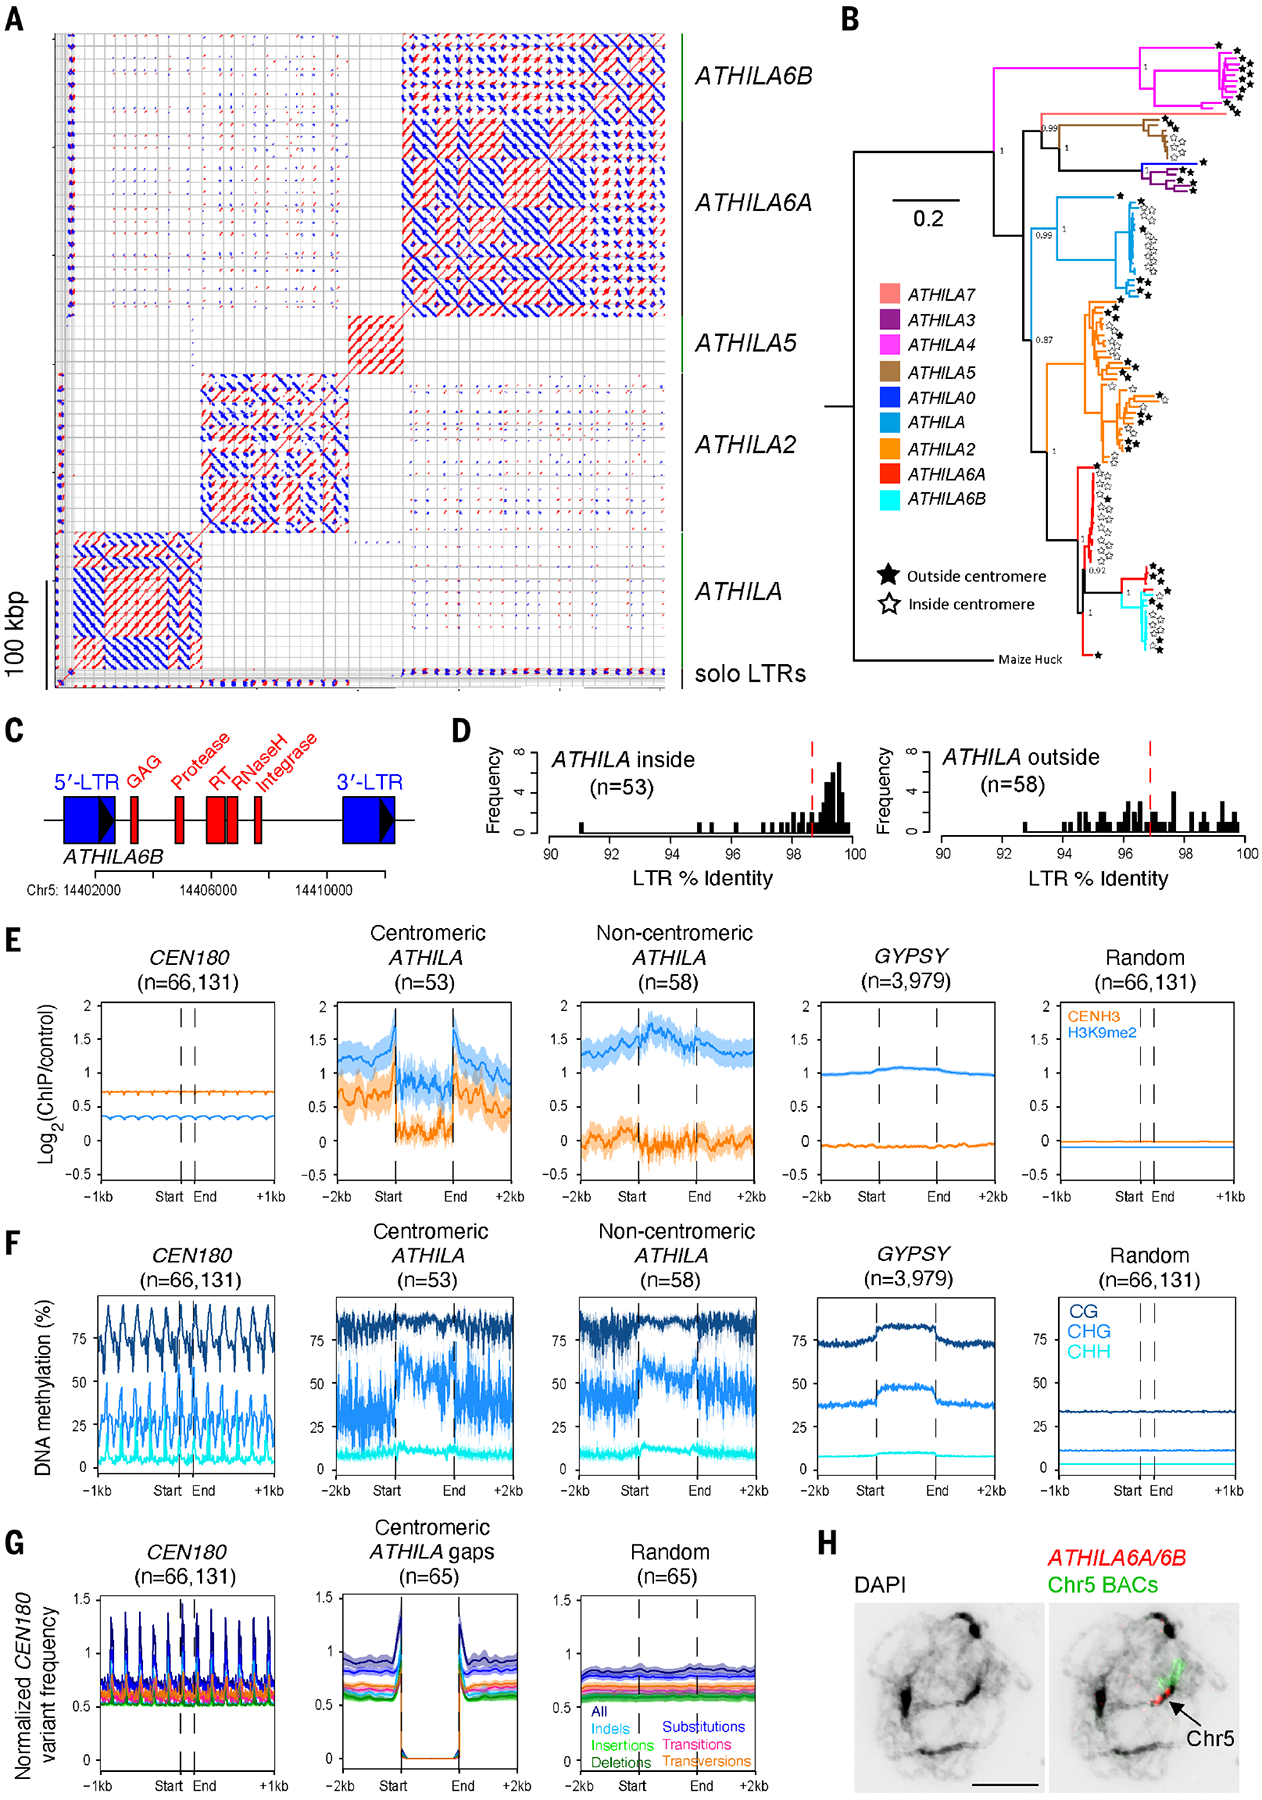
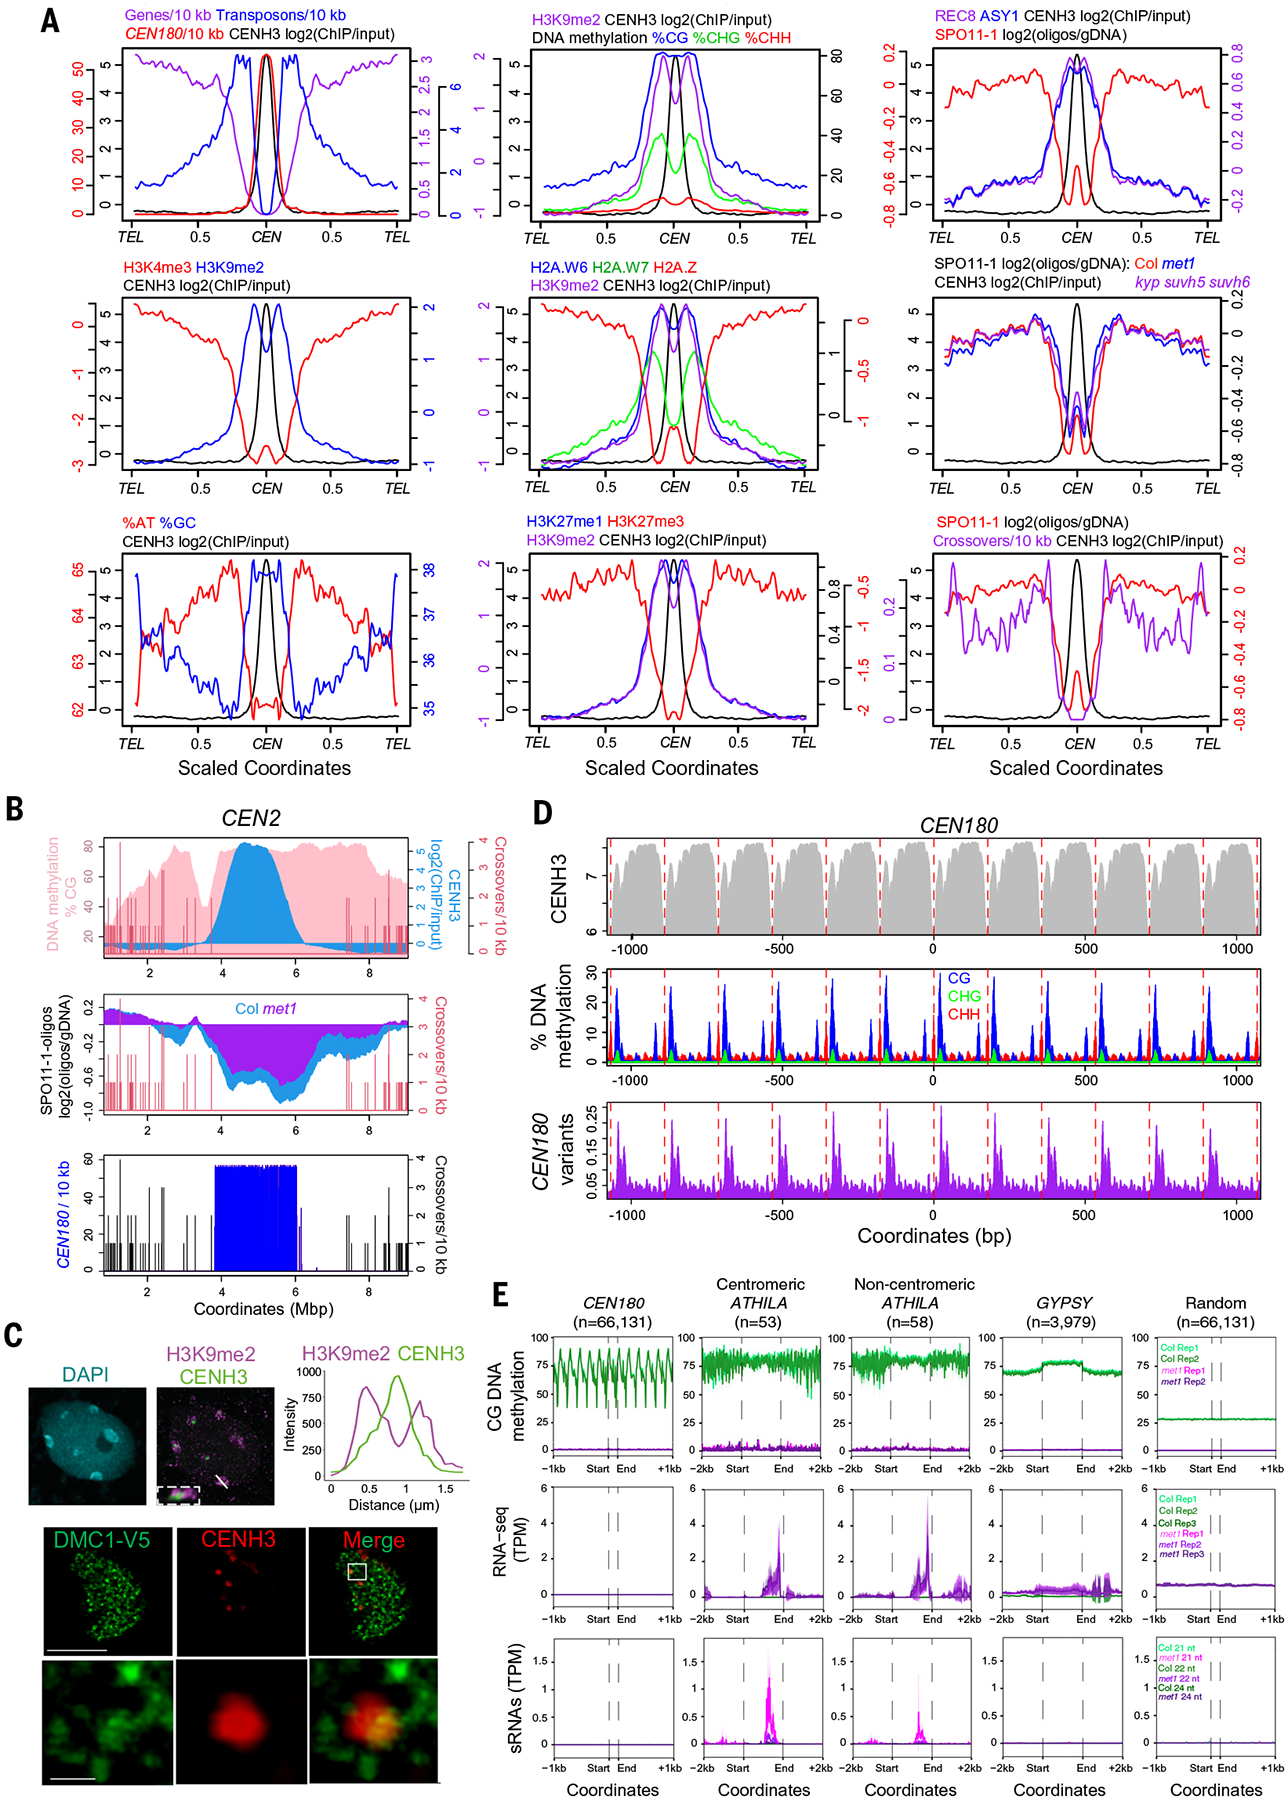
Centromeres attach chromosomes to spindle microtubules during cell division and, despite this conserved role, show paradoxically rapid evolution and are typified by complex repeats. We used long-read sequencing to generate the Col-CEN Arabidopsis thaliana genome assembly that resolves all five centromeres. The centromeres consist of megabase-scale tandemly repeated satellite arrays, which support CENTROMERE SPECIFIC HISTONE H3 (CENH3) occupancy and are densely DNA methylated, with satellite variants private to each chromosome. CENH3 preferentially occupies satellites that show the least amount of divergence and occur in higher-order repeats. The centromeres are invaded by ATHILA retrotransposons, which disrupt genetic and epigenetic organization. Centromeric crossover recombination is suppressed, yet low levels of meiotic DNA double-strand breaks occur that are regulated by DNA methylation. We propose that Arabidopsis centromeres are evolving through cycles of satellite homogenization and retrotransposon-driven diversification.


Conflict of interest statement

Competing interests: The authors have no competing interests.

Figures

Fig. 1.
Fig. 1.. Complete assembly of the Arabidopsis centromeres.
(A) Circos plot of the Col-CEN assembly. Quantitative tracks (labeled c to j) are aggregated in 100-kbp bins, and independent y-axis labels are given as (low value, mid value, high value, measurement unit) as follows: (a) chromosome with centromeres shown in red; (b) telomeres (blue), 45S rDNA (yellow), 5S rDNA (black), and the mitochondrial insertion (pink); (c) genes (0, 25, 51, gene number); (d) transposable elements (0, 84, 167, transposable element number); (e) Col×Ler F2 crossovers (0, 7, 14, crossover number); (f) CENH3 [−0.5, 0, 3, log2(ChIP/input)]; (g) H3K9me2 [−0.6, 0, 2, log2(ChIP/input)]; (h) CG methylation (0, 47, 95, %); (i) CHG methylation (0, 28, 56, %); and (j) CHH methylation (0, 7, 13, %). (B) Syntenic alignments between the TAIR10 and Col-CEN assemblies. (C) Col-CEN ideogram with annotated chromosome landmarks (not drawn to scale). (D) CENH3 log2(ChIP/input) (black) plotted over centromeres 1 and 4 (10). CEN180 per 10-kbp plotted for forward (red) or reverse (blue) strand orientations. ATHILA are indicated by purple x-axis ticks. Heatmaps show pairwise sequence identity between all nonoverlapping 5-kbp regions. A FISH-stained chromosome 1 at pachytene is shown at the top, probed with upper-arm BACs (green), ATHILA (purple), CEN180 (blue), the telomeric repeat (green), and bottom-arm BACs (yellow). (E) Dot plots comparing the five centromeres using a search window of 120 or 178 bp. Red and blue indicate forward- and reverse-strand similarity, respectively. (F) Pachytene-stage chromosomes stained with 4′,6-diamidino-2-phenylindole (DAPI) (black) and CEN180-α (red), CEN180-β (purple), and chromosome 1 BAC (green) FISH probes. The scale bar represents 10 μM.
Fig. 2.
Fig. 2.. The Arabidopsis CEN180 satellite repeat library.
(A) Histograms of CEN180 monomer lengths (bp), and variant distances relative to the genome-wide consensus. Red dashed lines indicate mean values. (B) Same as for (A) but showing widths of CEN180 higher-order repeat blocks (monomers) and the distance between higher-order repeats (kbp). (C) Heatmap of a representative region within centromere 2, shaded according to pairwise variants between CEN180. (D) Circos plot showing (i) GYPSY density; (ii) CEN180 density; (iii) centromeric ATHILA “rainfall”; (iv) CEN180 density grouped by decreasing CENH3 log2(ChIP/input) (red, high; navy, low); (v) CEN180 density grouped by decreasing higher-order repetition (red, high; navy, low); (vi) CEN180 grouped by decreasing variant distance (red, high; navy, low); and (vii) CENH3 log2(ChIP/input) (purple) across the centromeres. (E) CEN180 were divided into quintiles according to CENH3 log2(ChIP/input) and mean values with 95% confidence intervals plotted. The same groups were analyzed for CEN180 variant distance (red), higher-order repetition (blue), and CG-context DNA methylation (purple). (F) Plot of the distance between pairs of higher-order repeats (kbp) and divergence (variants per monomer) between the higher-order repeats. (G) Plots of CENH3 log2(ChIP/input) (black) across the centromeres compared with CEN180 higher-order repetition on forward (red) or reverse (blue) strands. The heatmap beneath is shaded according to higher-order repeat density.
Fig. 3.
Fig. 3.. Invasion of the Arabidopsis centromeres by ATHILA retrotransposons.
(A) Dot plot of centromeric ATHILA using a 50-bp search window. Red and blue indicate forward- and reverse-strand similarity, respectively. ATHILA subfamilies and solo LTRs are indicated. (B) Maximum likelihood phylogenetic tree of 111 intact ATHILA elements, color coded according to subfamily. Stars at the branch tips indicate ATHILA inside (white) or outside (black) the centromeres. (C) An annotated map of an ATHILA6B with LTRs (blue) and core protein domains (red) highlighted. (D) Histograms of LTR sequence identity for centromeric ATHILA elements (n = 53) compared with ATHILA outside of the centromeres (n = 58). Red dashed lines indicate mean values. (E) Metaprofiles of CENH3 (orange) and H3K9me2 (blue) ChIP-seq signals around CEN180 (n = 66,131), centromeric intact ATHILA (n = 53), ATHILA located outside the centromeres (n = 58), GYPSY retrotransposons (n = 3979), and random positions (n = 66,131). Shaded ribbons represent 95% confidence intervals for windowed mean values. (F) Same as for (E) but analyzing ONT-derived percentage of DNA methylation in CG (dark blue), CHG (blue), and CHH (light blue) contexts. (G) Meta-profiles of CEN180 sequence edits (insertions, deletions, and substitutions relative to the CEN180 consensus), normalized by CEN180 presence, in positions surrounding CEN180 gaps containing ATHILA (n = 65) or random positions (n = 65). All edits (dark blue), substitutions (blue), indels (light blue), insertions (light green), deletions (dark green), transitions (pink), and transversions (orange) are shown. Shaded ribbons represent 95% confidence intervals for windowed mean values. (H) Pachytene-stage chromosome spread stained with DAPI (black), an ATHILA6A/6B GAG FISH probe (red), and chromosome 5–specific BACs (green). The scale bar represents 10 μM.
Fig. 4.
Fig. 4.. Epigenetic organization and meiotic recombination within the centromeres.
(A) Quantification of genomic features plotted along chromosome arms that were proportionally scaled between telomeres (TEL) and centromere midpoints (CEN) [defined by maximum CENH3 ChIP-seq log2(ChIP/input) enrichment]. Data analyzed were gene, transposon, and CEN180 density; CENH3, H3K4me3, H3K9me2, H2A.W6, H2A.W7, H2A.Z, H3K27me1, H3K27me3, REC8, and ASY1 log2 (ChIP/input); and percentage of AT/GC base composition, DNA methylation, SPO11-1-oligonucleotides (in wild type and met1), and crossovers (table S7). (B) Plot quantifying crossovers (red), percentage of CG DNA methylation (pink), CENH3 (blue), SPO11-1-oligonucleotides in wild type and met1, and CEN180 density along centromere 2. (C) An interphase nucleus immunostained for H3K9me2 (magenta) and CENH3-GFP (green) is shown at the top. The white line indicates the confocal section used for the intensity plot shown on the right; the region outlined by the white dashed line shows a magnified image of a centromere. The scale bar represents 5 μM. At the bottom is a male meiocyte (early prophase I) immunostained for CENH3 (red) and V5-DMC1 (green). The region outlined by the white line indicates the magnified region shown in the lower row of images. Scale bars are 10 μM (upper) and 1 μM (lower). (D) Plots of CENH3 ChIP enrichment (gray), DNA methylation in CG (blue), CHG (green) and CHH (red) contexts, and CEN180 variants (purple), averaged over windows centered on CEN180 starts. The red dashed lines show 178-bp increments. (E) Metaprofiles of CG-context DNA methylation, RNA-seq, and siRNA-seq in wild type (green) or met1 (pink and purple) (29) around CEN180 (n = 66,131), centromeric intact ATHILA (n = 53), ATHILA located outside the centromeres (n = 58), GYPSY (n = 3979), and random positions (n = 66,131). Shaded ribbons represent 95% confidence intervals for windowed mean values.

Comment in

References

    1. Malik HS, Henikoff S, Major evolutionary transitions in centromere complexity. Cell 138, 1067–1082 (2009). doi: 10.1016/j.cell.2009.08.036; - DOI - PubMed
    1. Melters DP et al., Comparative analysis of tandem repeats from hundreds of species reveals unique insights into centromere evolution. Genome Biol. 14, R10 (2013).doi: 10.1186/gb-2013-14-1-r10; - DOI - PMC - PubMed
    1. McKinley KL, Cheeseman IM, The molecular basis for centromere identity and function. Nat. Rev. Mol. Cell Biol 17, 16–29 (2016). doi: 10.1038/nrm.2015.5; - DOI - PMC - PubMed
    1. Rudd MK, Wray GA, Willard HF, The evolutionary dynamics of α-satellite. Genome Res. 16, 88–96 (2006). doi: 10.1101/gr.3810906; - DOI - PMC - PubMed
    1. Jain M et al., Nanopore sequencing and assembly of a human genome with ultra-long reads. Nat. Biotechnol 36, 338–345 (2018). doi: 10.1038/nbt.4060; - DOI - PMC - PubMed

Publication types