Clinical Trial
. 2022 Jan 4;132(1):e150937.
doi: 10.1172/JCI150937.

Anti-HIV antibody development up to 1 year after antiretroviral therapy initiation in acute HIV infection

Affiliations
Clinical Trial

Anti-HIV antibody development up to 1 year after antiretroviral therapy initiation in acute HIV infection

Julie L Mitchell et al. J Clin Invest. .

Abstract

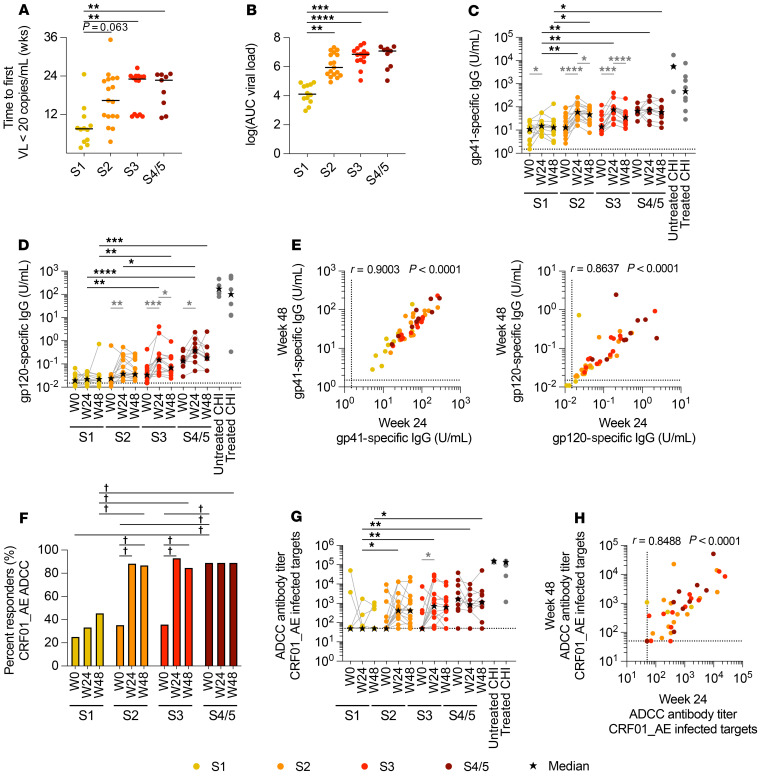
Early initiation of antiretroviral therapy (ART) in acute HIV infection (AHI) is effective at limiting seeding of the HIV viral reservoir, but little is known about how the resultant decreased antigen load affects long-term Ab development after ART. We report here that Env-specific plasma antibody (Ab) levels and Ab-dependent cellular cytotoxicity (ADCC) increased during the first 24 weeks of ART and correlated with Ab levels persisting after 48 weeks of ART. Participants treated in AHI stage 1 had lower Env-specific Ab levels and ADCC activity on ART than did those treated later. Importantly, participants who initiated ART after peak viremia in AHI developed elevated cross-clade ADCC responses that were detectable 1 year after ART initiation, even though clinically undetectable viremia was reached by 24 weeks. These data suggest that there is more germinal center (GC) activity in the later stages of AHI and that Ab development continues in the absence of detectable viremia during the first year of suppressive ART. The development of therapeutic interventions that can enhance earlier development of GCs in AHI and Abs after ART initiation could provide important protection against the viral reservoir that is seeded in individuals treated early in the disease.

Keywords: AIDS/HIV; Immunoglobulins; Immunology.


Figures

Figure 1
Figure 1. HIV-specific antibodies with ADCC function do not develop until S4/5 of AHI.
(A) Plasma VL at the time of diagnosis and ART initiation for participants in different stages of AHI or for those with untreated CHI. (B) CXCL13 levels in the plasma of participants prior to ART initiation at different stages of AHI or CHI were measured by Luminex assay. (C) Levels of plasma gp41-specific and gp120-specific Ab levels were measured by ELISA prior to ART initiation during AHI or CHI. (D) ADCP responses of plasma Abs prior to ART initiation during AHI or CHI were measured against the CRF01_AE envelope. The cutoff for positive phagocytosis scores is designated by a dotted line. (E) ADCC responses of plasma Abs prior to ART initiation during AHI or CHI were measured using target cells infected with CRF01_AE virus. (F) Plasma neutralization was measured in TZM.bl cells using PSVs containing HIV 40646v01 (CRF01_AE), MN.3 (clade B), or MuLV (negative control). The plasma dilution necessary to achieve 50% neutralization (ID50) is shown for plasma collected prior to ART initiation in AHI or CHI. Differences were measured by a Kruskal-Wallis test with Dunn’s multiple-comparison test of AHI stages. n = 12 for S1; n = 17 for S2; n = 14 for S3; and n = 9 for S4/5. *P < 0.05, **P < 0.01, ***P < 0.001, and ****P < 0.0001.
Figure 2
Figure 2. Continued Ab development after ART initiation in participants treated in S2 or later of AHI.
(A) Time required for the VL to first reach undetectable levels (VL 20 copies/mL) after ART initiation for participants who initiated ART at different stages of AHI. (B) The log VL AUC was calculated for each participant. Plasma levels of gp41-specific (C) and gp120-specific (D) Abs were measured by ELISA after 24 (W24) and 48 (W48) weeks of ART. (E) Correlations between Ab levels at week 24 and week 48 are shown for gp41-specific and gp120-specific Abs. (F) Proportion of participants who had measurable ADCC responses (responders) at each visit using target cells infected with CRF01_AE virus. (G) ADCC function of plasma Abs after 24 and 48 weeks of ART in participants who initiated treatment during AHI or CHI. (H) Correlation between ADCC Ab titers at week 24 and week 48. Differences in the proportion of participants responding at each visit were calculated using a χ2 test and the Marascuilo procedure (dagger symbol indicates significant differences in proportions). Differences in VLs, AUC, or Ab levels between AHI stages were measured by a Kruskal-Wallis test with Dunn’s multiple-comparison test (black asterisks). Differences in Ab levels between visits were measured by a Wilcoxon matched-pairs, signed-rank test (light gray asterisks). For week 0 and week 24: n = 12 for S1; n = 17 for S2; n = 14 for S3; and n = 9 for S4/5. For week 48: n = 11 for S1; n = 15 for S2; n = 13 for S3; and n = 9 for S4/5. *P < 0.05, **P < 0.01, ***P < 0.001, and ****P < 0.0001
Figure 3
Figure 3. Env-specific Ab levels correlate with the VL AUC only in participants treated in S4/5 of AHI.
Correlations between the VL AUC and levels of gp41-specific Abs, gp120-specific Abs, ADCP, and CRF01_AE-specific ADCC titers at week 48 after ART initiation in all participants (A) and only those who initiated ART in S4/5 of AHI (B). Correlations were measured by Spearman’s correlation. n = 11 for S1; n = 15 for S2; n = 13 for S3; and n = 9 for S4/5.
Figure 4
Figure 4. Increased cross-clade ADCC Ab responses between 24 and 48 weeks of ART in participants treated in S4/5 of AHI.
Cross-clade ADCC responses were measured in the plasma at week 0, week 24, and week 48 after ART initiation in participants who initiated treatment in AHI or CHI using target cells infected with clade C virus. (A) The frequency of participants who had measurable clade C–specific ADCC responses (responders) within each group is shown for each visit. (B) Changes in clade C–specific ADCC Ab titers at each visit are shown, with stars representing median titers. (C) Correlation between clade C–specific ADCC Ab titers at week 24 and week 48. (D and E) Correlations between gp120-specific Ab levels at week 24 and CRF01_AE- (D) or clade C–specific (E) ADCC Ab titers at week 24 and week 48. (F) Correlation between CRF01_AE- and clade C–specific Ab titers at week 48. Differences in the proportion of participants who showed a response at each visit were calculated using a χ2 test and the Marascuilo procedure (dagger symbol in A indicates significant difference in proportions). Differences between AHI stages were measured by a Kruskal-Wallis test with Dunn’s multiple-comparison test (black asterisks in B). Differences in ADCC Ab titers between visits were measured by a Wilcoxon matched-pairs, signed-rank test (light gray asterisks in B). Correlations were measured by Spearman’s correlation. For week 0 and week 24: n = 12 for S1; n = 17 for S2; n = 14 for S3; and n = 9 for S4/5. For week 48: n = 11 for S1; n = 15 for S2; n = 13 for S3; and n = 9 for S4/5. *P < 0.05 and **P < 0.01.

References

    1. Leyre L, et al. Abundant HIV-infected cells in blood and tissues are rapidly cleared upon ART initiation during acute HIV infection. Sci Transl Med. 2020;12(533):eaav3491. doi: 10.1126/scitranslmed.aav3491. - DOI - PMC - PubMed
    1. Buzon MJ, et al. Long-term antiretroviral treatment initiated at primary HIV-1 infection affects the size, composition, and decay kinetics of the reservoir of HIV-1-infected CD4 T cells. J Virol. 2014;88(17):10056–10065. doi: 10.1128/JVI.01046-14. - DOI - PMC - PubMed
    1. Strain MC, et al. Effect of treatment, during primary infection, on establishment and clearance of cellular reservoirs of HIV-1. J Infect Dis. 2005;191(9):1410–1418. doi: 10.1086/428777. - DOI - PubMed
    1. Ananworanich J, et al. Impact of multi-targeted antiretroviral treatment on gut T cell depletion and HIV reservoir seeding during acute HIV infection. PLoS One. 2012;7(3):e33948. doi: 10.1371/journal.pone.0033948. - DOI - PMC - PubMed
    1. Deleage C, et al. Impact of early cART in the gut during acute HIV infection. JCI Insight. 2016;1(10):e87065. - PMC - PubMed

Publication types