. 2022 Feb 3;29(2):281-297.e12.
doi: 10.1016/j.stem.2021.10.009. Epub 2021 Nov 10.

Hif-1a suppresses ROS-induced proliferation of cardiac fibroblasts following myocardial infarction

Affiliations

Hif-1a suppresses ROS-induced proliferation of cardiac fibroblasts following myocardial infarction

Vaibhao Janbandhu et al. Cell Stem Cell. .

Abstract

We report that cardiac fibroblasts (CFs) and mesenchymal progenitors are more hypoxic than other cardiac interstitial populations, express more hypoxia-inducible factor 1α (HIF-1α), and exhibit increased glycolytic metabolism. CF-specific deletion of Hif-1a resulted in decreased HIF-1 target gene expression and increased mesenchymal progenitors in uninjured hearts and increased CF activation without proliferation following sham injury, as demonstrated using single-cell RNA sequencing (scRNA-seq). After myocardial infarction (MI), however, there was ∼50% increased CF proliferation and excessive scarring and contractile dysfunction, a scenario replicated in 3D engineered cardiac microtissues. CF proliferation was associated with higher reactive oxygen species (ROS) as occurred also in wild-type mice treated with the mitochondrial ROS generator MitoParaquat (MitoPQ). The mitochondrial-targeted antioxidant MitoTEMPO rescued Hif-1a mutant phenotypes. Thus, HIF-1α in CFs provides a critical braking mechanism against excessive post-ischemic CF activation and proliferation through regulation of mitochondrial ROS. CFs are potential cellular targets for designer antioxidant therapies in cardiovascular disease.

Keywords: 3D cardiac microtissues; Hif-1a; ROS; antioxidant therapies; cardiac fibroblasts; cardiac fibrosis; hypoxia; mesenchymal progenitors; mitochondrial reactive oxygen species; myocardial infarction; single-cell RNA-seq.


Conflict of interest statement

Declaration of interests The authors declare no competing interests.

Figures
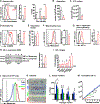
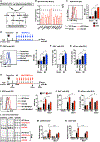
Figure 1.
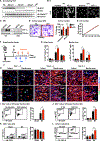
Figure 1.. Metabolic profile of adult cardiac S+P+ cells
(A) Flow cytometry analysis of Pim staining (left) and the relative percentage of cells in different Pim fractions (right). MFI, median fluorescence intensity (middle) (n = 4). (B) Oxygen consumption rate (n = 3). (C) Intracellular ATP levels (n = 3). (D) Flow cytometry analysis of 2-NBDG (2-(N-(7-nitrobenz-2-oxa-1,3-diazol-4-yl)amino)-2-deoxyglucose) fluorescence (n = 5). (E) Intracellular lactate levels (n = 3). (F) Flow cytometry analysis of MitoTracker fluorescence (n = 3). (G) Flow cytometry analysis of HIF-1α staining (n = 3). (H) WB analysis of freshly sorted S+P+ and TIP cells (n = 3). (I) qRT-PCR of HIF-1 target genes. Values are normalized to TIP cells (n = 3). (J) FACS sorting strategy of MitoTracker fractions (Mitolow, Mitomedium, and Mitohigh). (K) Crystal violet (CV)-stained colonies in each Mito fraction at the first passage (passage 0, P0). Scale bar, 1 cm. (L and M) Colony and cumulative cell numbers, respectively, in different Mito fractions (n = 3). See also Figure S1 and Table S1.
Figure 2.
Figure 2.. Proliferation defects in Hif-1a-deficient CFs after MI
(A) PCR products showing Hif-1a and PdgfraMCM alleles in tdTomato+ cells (n = 5). (B) IF staining of tdTomato+ cells at P0. Scale bar, 50 mm. (C) WB analysis of tdTomato+ cells at P0, cultured in indicated conditions. (D) Stained colonies and colony numbers in S+tdTomato+ cells at P0 (n = 5). Scale bar, 1 cm. (E) Cumulative cell number of S+tdTomato+ cells (n = 3). (F) Schematic of the experimental design. (G) Quantification of EdU+ cells in IF images shown in (H) (n = 4–8). (H) F staining of heart sections post-MI and EdU injection. Arrows and arrowheads indicate tdTomato+EdU+ and tdTomatoEdU+ cells, respectively. Scale bar, 50 mm. (I–L) Flow cytometry analysis of EdU+ staining (n = 3–5), Ki67+ staining (n = 4–5), CD31+ cells (n = 4–8), and total tdTomato+ cells (n = 4–8), respectively, in sham or MI WT and cKO hearts. See also Figures S2 and S3 and Table S1.
Figure 3.
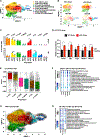
Figure 3.. Hif-1a null CFs are primed for cell cycle entry after MI
(A) UMAP (uniform manifold approximation and projection) plot of aggregate tdTomato+CD31CD45 single-cell data with identified subpopulations. (B) UMAP plots according to condition. (C) Percentages of cells in each population according to experimental condition. *p < 0.01. (D) qRT-PCR of indicated genes in tdTomato+CD31CD45 cells from WT-sham mice. Values are normalized to the WT-healthy (uninjured) sample (n = 3). (E) CytoTRACE analysis of scRNA-seq data. (F) Top GO BP terms for genes downregulated in tdTomato+CD31CD45 cells from cKO-sham mice. (G) Analysis of RNA velocity projected onto the HET UMAP plot. (H) Top GO BP terms for genes downregulated in tdTomato+CD31CD45 cells from cKO-MI mice. Also see Figure S4 and Table S2.
Figure 4.
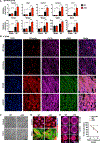
Figure 4.. Hif-1a deficiency aggravates post-MI fibrosis
(A) qRT-PCR of indicated genes in the left ventricles after sham/MI surgeries. Values are normalized to the WT-sham sample (n = 3). (B) IF staining of heart sections at day 28 after surgeries. Scale bar, 50 µm. (C) Phase contrast images of tdTomato+ cells with or without TGFb1 treatment. Scale bar, 50 µm. (D) IF staining of tdTomato+ cells with or without TGFb1 treatment. Scale bar, 100 µm. (E) Images of collagen matrices and quantification of area (n = 3). Scale bar, 1 cm. Also see Figure S5.
Figure 5.
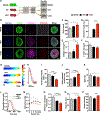
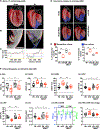
Figure 5.. Hif-1a null CFs significantly deteriorate electrical and mechanical functions of engineered cardiac bundles in vitro
(A) Schematic showing fabrication of 3D engineered cardiac tissue bundles. (B) IF staining of bundle cross sections. Scale bar, 50 µm. (C and D) Total nuclei and tdTomato+ nuclei counts per bundle cross-section (n = 3, 4–7 bundles per group). (E and F) Collagen I area and F-actin+ area per bundle cross-section (n = 3, 4–7 bundles per group). (G) Isochrone maps of action potential propagation in response to 2-Hz point stimulation in bundles. (H) Optical action potential traces from bundles stained with di-4 ANEPPS and electrically stimulated at 2Hz. (I–K) Conduction velocity (CV), action potential duration (APD), and maximum capture rate (MCR) in bundles (n = 3, 10–11 bundles per group). (L) Contractile force traces recorded from bundles electrically stimulated at 1 Hz by field electrodes at optimal tissue length. (M) Active force curves as a function of tissue stretch in 4% increments (n = 3, 18–23 bundles per group). (N) Maximum contractile forces recorded during 1-Hz pacing at optimal tissue length (n = 3, 18–23 bundles per group). (O) Twitch rise time measured between 10% and 90% of peak amplitude at the resting length (n = 3, 18–23 bundles per group). (P) Twitch decay time measured between 90% and 10% of peak amplitude at the resting length (n = 3, 18–23 bundles per group). Also see Video S1.
Figure 6.
Figure 6.. HIF-1α-mediated redox regulation controls proliferation of CFs after MI
(A) Schematic showing regulation of mitochondrial metabolism by HIF-1α. (B) qRT-PCR of indicated genes in tdTomato+ cells from cKO-MI hearts. Values are normalized to the WT-MI sample (n = 3). (C) Flow cytometry analysis of DHE fluorescence in PDGFRα+ cells post-surgery. Values are normalized to vehicle-treated WT-sham mice (n = 3–5). Also see (I). (D) Schematic of experimental design for MitoPQ treatment. (E) Flow cytometry analysis of DHE fluorescence in PDGFRα+ cells from WT hearts after surgery and treatment with vehicle or MitoPQ. Values are normalized to vehicle-treated WT-sham mice (n = 3–5). (F) Flow cytometry analysis of EdU+ staining in tdTomato+ fraction from WT hearts after surgery and vehicle or MitoPQ treatment (n = 4–6). (G) Flow cytometry analysis of tdTomato+ cells from WT hearts after surgery and vehicle or MitoPQ treatment (n = 4–6). (H) Schematic of experimental design for MitoT treatment. (I) Flow cytometry analysis of DHE fluorescence in PDGFRα+ cells after surgery and treatment with vehicle or MitoT. Values are normalized to WT-sham mice (n = 3–4). (J) Flow cytometry analysis of EdU+ staining in tdTomato+ fraction after surgery and vehicle or MitoT treatment (n = 3–6). (K) Flow cytometry analysis of tdTomato+ cells after surgery and vehicle or MitoT treatment (n = 3–6). (L) Dot immunoblot analysis of tdTomato+ cells after surgery and vehicle or MitoT treatment (n = 2, 3 technical replicates per group). (M) Signal intensity quantification for pERK1/2 dot blot shown in (L). Values are normalized to WT-sham mice. (N) Signal intensity quantification for pAKT dot blot shown in (L). Values are normalized to WT-sham mice Also see Figure S6.
Figure 7.
Figure 7.. MitoT treatment rescues cardiac anatomical and functional defects in cKO post-MI
(A) Micro-CT analysis of hearts after surgery. Myocardium and scar are shown in red and blue, respectively. Scale bar, 1 mm. (B) The area enclosed by the white box in (A) is shown at higher magnification depicting semi-automated segmentation of myocardium (red line) and scar (blue line). Scale bar, 0.5 mm. (C) Pixel intensity profile along the yellow lines shown in (B). Red and blue lines represent the average intensity value of the whole myocardium and the whole scar, respectively. Corresponding position of green dot in (B) is shown on the graph. (D) Micro-CT analysis of hearts of WT and cKO mice after surgery and vehicle or MitoT treatment. Scale bar, 1 mm. (E) Volumetric quantification of myocardial or scar tissue shown in (D) (n = 5–6). (F) Quantification of (i) fractional area change (FAC), (ii) left ventricular end-diastolic volume (LVEDV), (iii) left ventricular end-systolic volume (LVESV), (iv) left ventricular stroke volume (LVSV), (v) left ventricular ejection fraction (LVEF), (vi) cardiac output (CO)/body weight (BW), (vii) heart weight (HW) and BW, and (viii) HW/BW ratio of WT and cKO mice after surgery and vehicle or MitoT treatment. Values are normalized to untreated WT-sham mice (n = 10–13). Also see Figure S7 and Video S2.

References

    1. Alexanian M, Przytycki PF, Micheletti R, Padmanabhan A, Ye L, Travers JG, Gonzalez-Teran B, Silva AC, Duan Q, Ranade SS, et al. (2021). A transcriptional switch governs fibroblast activation in heart disease. Nature 595, 438–443. - PMC - PubMed
    1. Badie N, and Bursac N (2009). Novel micropatterned cardiac cell cultures with realistic ventricular microstructure. Biophys. J 96, 3873–3885. - PMC - PubMed
    1. Badie N, Satterwhite L, and Bursac N (2009). A method to replicate the microstructure of heart tissue in vitro using DTMRI-based cell micropatterning. Ann. Biomed. Eng 37, 2510–2521. - PubMed
    1. Bergmann O, Zdunek S, Felker A, Salehpour M, Alkass K, Bernard S, Sjostrom SL, Szewczykowska M, Jackowska T, Dos Remedios C, et al. (2015). Dynamics of Cell Generation and Turnover in the Human Heart. Cell 161, 1566–1575. - PubMed
    1. Bolger AM, Lohse M, and Usadel B (2014). Trimmomatic: a flexible trimmer for Illumina sequence data. Bioinformatics 30, 2114–2120. - PMC - PubMed

Publication types

Substances