

Spatially varying effects of measured confounding variables on disease risk
- PMID: 34763707
- PMCID: PMC8582111
- DOI: 10.1186/s12942-021-00298-6
Spatially varying effects of measured confounding variables on disease risk
Abstract
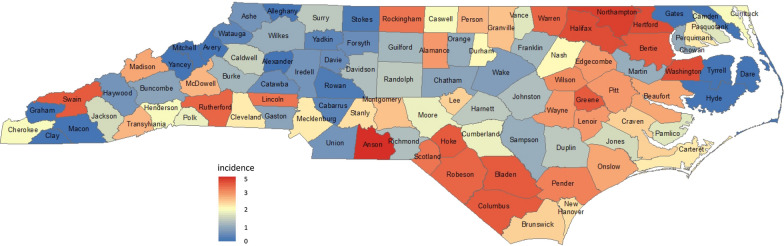
Background: The presence of considerable spatial variability in incidence intensity suggests that risk factors are unevenly distributed in space and influence the geographical disease incidence distribution and pattern. As most human common diseases that challenge investigators are complex traits and as more factors associated with increased risk are discovered, statistical spatial models are needed that investigate geographical variability in the association between disease incidence and confounding variables and evaluate spatially varying effects on disease risk related to known or suspected risk factors. Information on geography that we focus on is geographical disease clusters of peak incidence and paucity of incidence.
Methods: We proposed and illustrated a statistical spatial model that incorporates information on known or hypothesized risk factors, previously detected geographical disease clusters of peak incidence and paucity of incidence, and their interactions as covariates into the framework of interaction regression models. The spatial scan statistic and the generalized map-based pattern recognition procedure that we recently developed were both considered for geographical disease cluster detection. The Freeman-Tukey transformation was applied to improve normality of distribution and approximately stabilize the variance in the model. We exemplified the proposed method by analyzing data on the spatial occurrence of sudden infant death syndrome (SIDS) with confounding variables of race and gender in North Carolina.
Results: The analysis revealed the presence of spatial variability in the association between SIDS incidence and race. We differentiated spatial effects of race on SIDS incidence among previously detected geographical disease clusters of peak incidence and incidence paucity and areas outside the geographical disease clusters, determined by the spatial scan statistic and the generalized map-based pattern recognition procedure. Our analysis showed the absence of spatial association between SIDS incidence and gender.
Conclusion: The application to the SIDS incidence data demonstrates the ability of our proposed model to estimate spatially varying associations between disease incidence and confounding variables and distinguish spatially related risk factors from spatially constant ones, providing valuable inference for targeted environmental and epidemiological surveillance and management, risk stratification, and thorough etiologic studies of disease.
Keywords: Disease cluster; Hierarchical disease cluster; Spatial association; Spatial scan statistic; Spatially varying; Sudden infant death syndrome.
© 2021. The Author(s).
Conflict of interest statement
The authors declare that they have no competing interests.
Figures

 and Blue Symbol
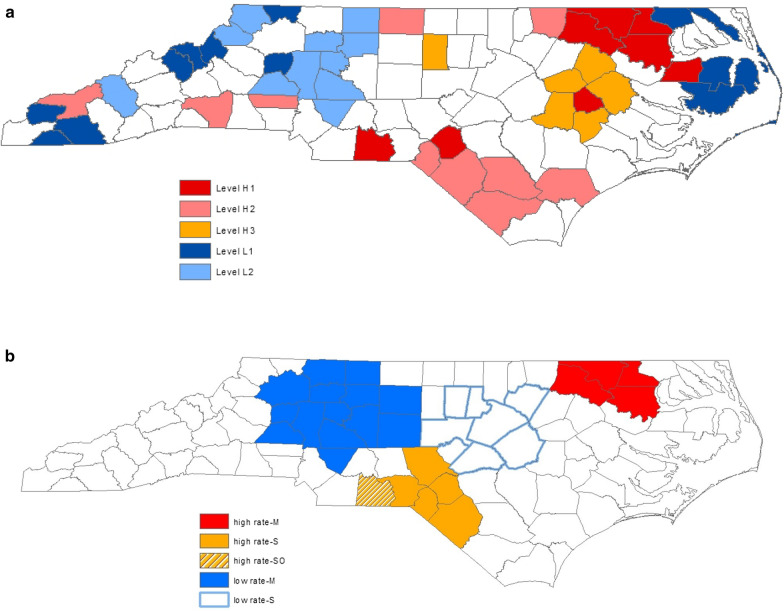
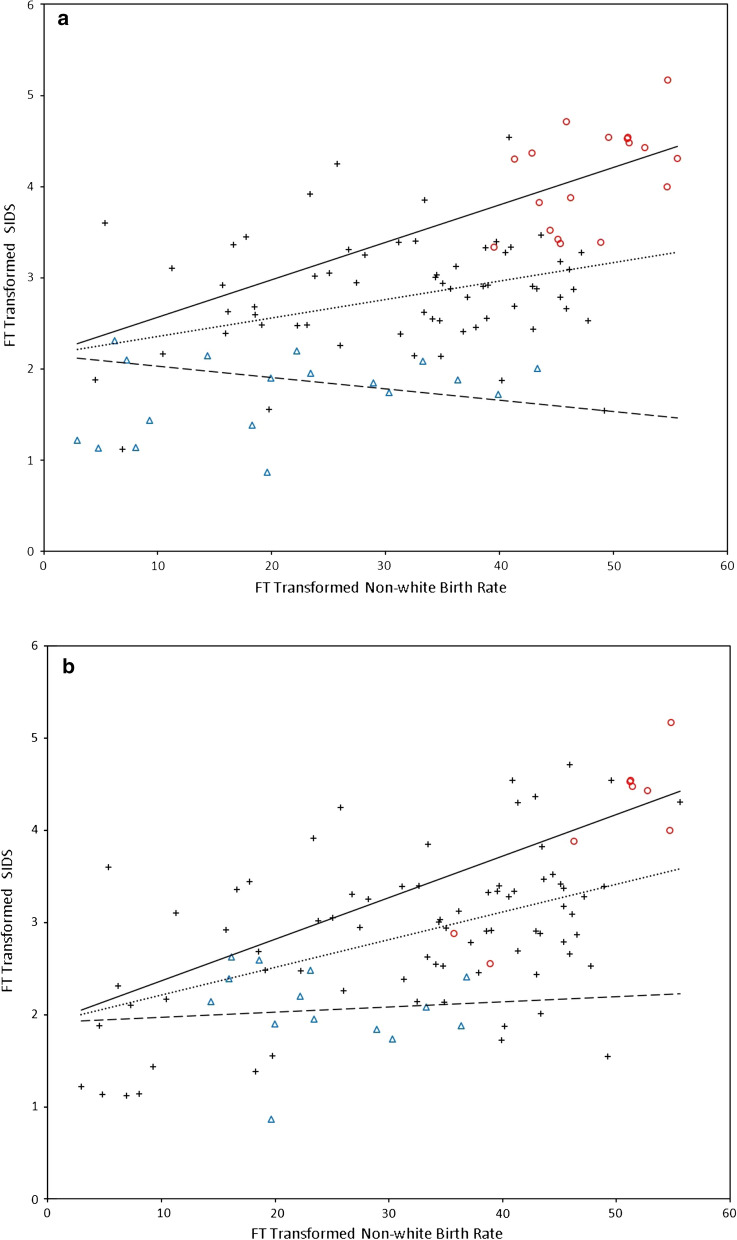
  Indicate Counties in Hierarchical Intensity Clusters of Peak Incidence and Incidence Paucity, Respectively. B Plot of Freeman-Tukey Transformed Non-White Live-Birth Proportion XFT1 versus Freeman-Tukey Transformed SIDS Incidence YFT for 99 North Carolina Counties and Fitted Regression Lines based on Spatial Scan Statistic. Red Symbol
  and Blue Symbol
  Indicate Counties in Likely SIDS Clusters of Peak Incidence and Incidence Paucity, Respectively
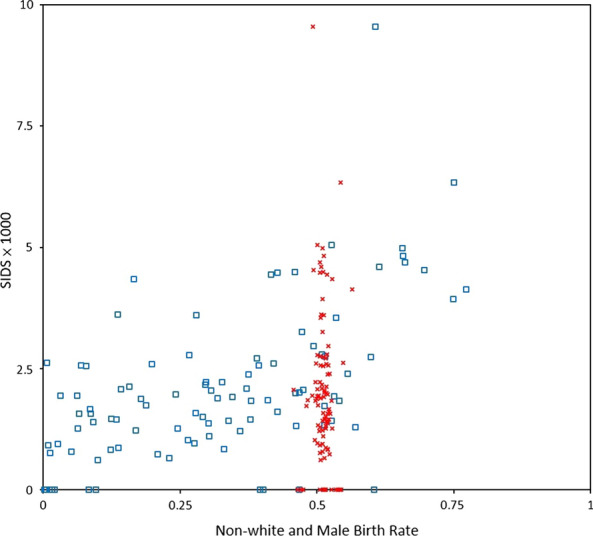
 ) and Male (Red Symbol
  ) Live-Birth Proportion
Similar articles
-
Differentiating anomalous disease intensity with confounding variables in space.Int J Health Geogr. 2020 Sep 14;19(1):37. doi: 10.1186/s12942-020-00231-3. Int J Health Geogr. 2020. PMID: 32928225 Free PMC article.
-
Population mixing and sudden infant death syndrome in England and Wales.Int J Epidemiol. 1994 Jun;23(3):540-4. doi: 10.1093/ije/23.3.540. Int J Epidemiol. 1994. PMID: 7960379
-
A functional-model-adjusted spatial scan statistic.Stat Med. 2020 Apr 15;39(8):1025-1040. doi: 10.1002/sim.8459. Epub 2020 Jan 22. Stat Med. 2020. PMID: 31965600
-
Spatial epidemiological approaches to inform leptospirosis surveillance and control: A systematic review and critical appraisal of methods.Zoonoses Public Health. 2019 Mar;66(2):185-206. doi: 10.1111/zph.12549. Epub 2018 Dec 28. Zoonoses Public Health. 2019. PMID: 30593736
-
[Statistical models for spatial analysis in parasitology].Parassitologia. 2004 Jun;46(1-2):75-8. Parassitologia. 2004. PMID: 15305691 Review. Italian.
Cited by
-
Risk factors for persistent fatal opioid-involved overdose clusters in Massachusetts 2011-2021: a spatial statistical analysis with socio-economic, accessibility, and prescription factors.BMC Public Health. 2024 Jul 15;24(1):1893. doi: 10.1186/s12889-024-19399-5. BMC Public Health. 2024. PMID: 39010038 Free PMC article.
-
An Approach to Identifying Spatial Variability in Observed Infectious Disease Spread in a Prospective Time-Space Series with Applications to COVID-19 and Dengue Incidence.Res Sq [Preprint]. 2024 Jan 24:rs.3.rs-3859620. doi: 10.21203/rs.3.rs-3859620/v1. Res Sq. 2024. PMID: 38343818 Free PMC article. Preprint.
References
-
- Cressie NAC. Statistics for Spatial Data. New York: Wiley; 1993.
-
- Sonesson C, Bock D. A review and discussion of prospective statistical surveillance in public health. J R Stat Soc A Stat Soc. 2003;166(1):5–21. doi: 10.1111/1467-985X.00256. - DOI
Publication types
MeSH terms
LinkOut - more resources
Full Text Sources
Research Materials
