. 2021 Nov 11;22(1):311.
doi: 10.1186/s13059-021-02535-4.

ATRX regulates glial identity and the tumor microenvironment in IDH-mutant glioma

Affiliations

ATRX regulates glial identity and the tumor microenvironment in IDH-mutant glioma

Husam Babikir et al. Genome Biol. .

Abstract

Background: Recent single-cell transcriptomic studies report that IDH-mutant gliomas share a common hierarchy of cellular phenotypes, independent of genetic subtype. However, the genetic differences between IDH-mutant glioma subtypes are prognostic, predictive of response to chemotherapy, and correlate with distinct tumor microenvironments.

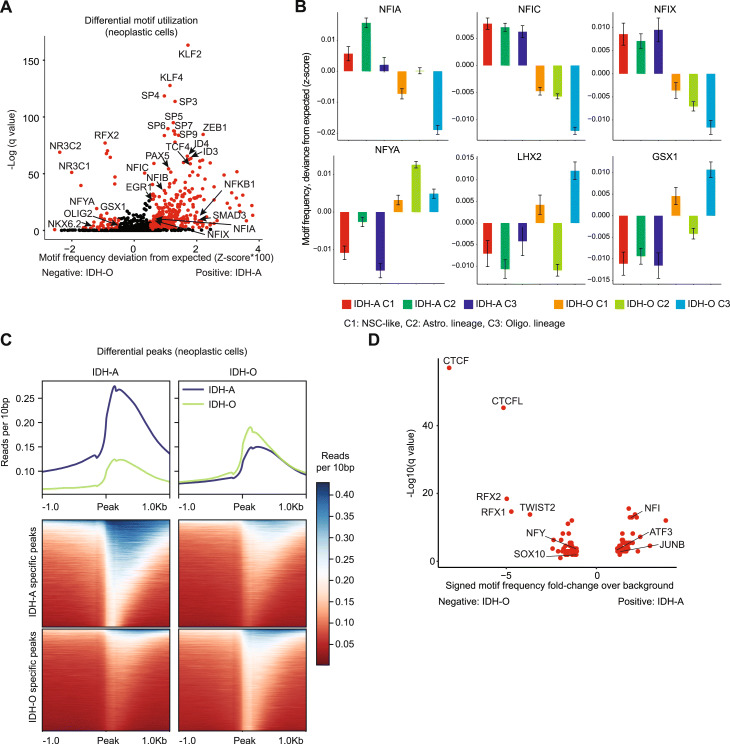
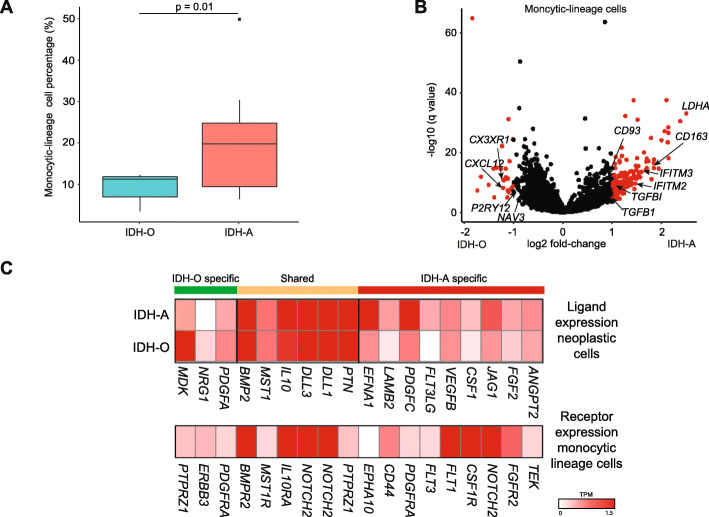
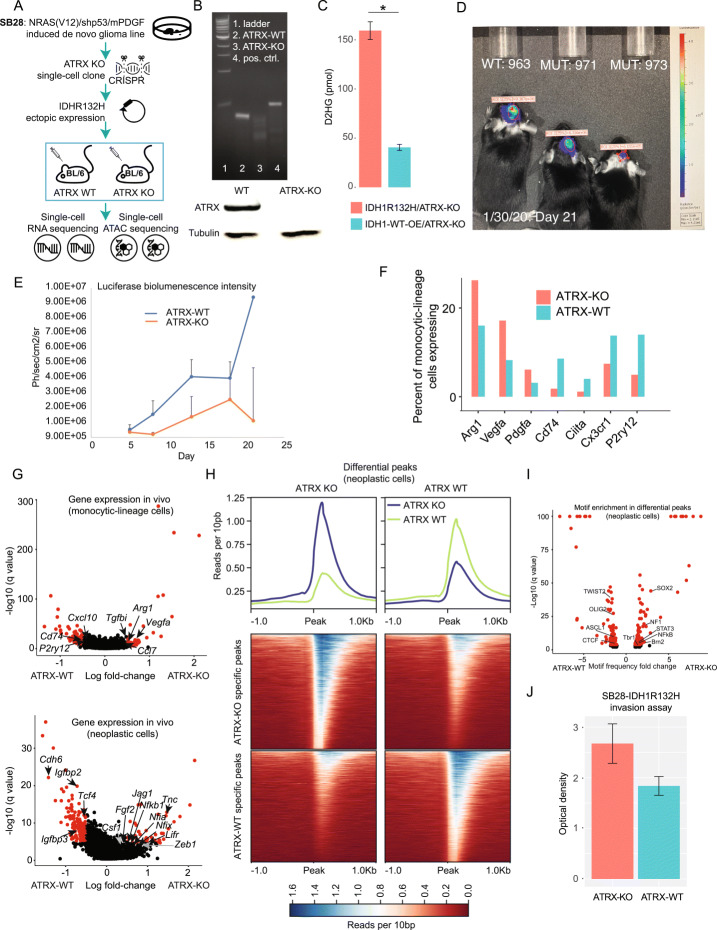
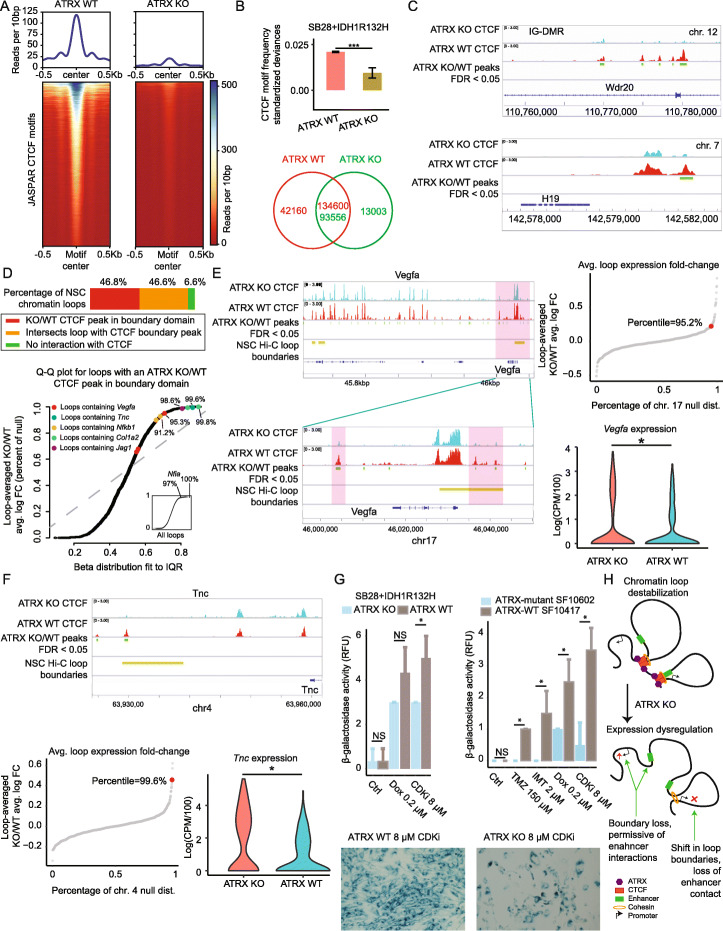
Results: To reconcile these findings, we profile 22 human IDH-mutant gliomas using scATAC-seq and scRNA-seq. We determine the cell-type-specific differences in transcription factor expression and associated regulatory grammars between IDH-mutant glioma subtypes. We find that while IDH-mutant gliomas do share a common distribution of cell types, there are significant differences in the expression and targeting of transcription factors that regulate glial identity and cytokine elaboration. We knock out the chromatin remodeler ATRX, which suffers loss-of-function alterations in most IDH-mutant astrocytomas, in an IDH-mutant immunocompetent intracranial murine model. We find that both human ATRX-mutant gliomas and murine ATRX-knockout gliomas are more heavily infiltrated by immunosuppressive monocytic-lineage cells derived from circulation than ATRX-intact gliomas, in an IDH-mutant background. ATRX knockout in murine glioma recapitulates gene expression and open chromatin signatures that are specific to human ATRX-mutant astrocytomas, including drivers of astrocytic lineage and immune-cell chemotaxis. Through single-cell cleavage under targets and tagmentation assays and meta-analysis of public data, we show that ATRX loss leads to a global depletion in CCCTC-binding factor association with DNA, gene dysregulation along associated chromatin loops, and protection from therapy-induced senescence.

Conclusions: These studies explain how IDH-mutant gliomas from different subtypes maintain distinct phenotypes and tumor microenvironments despite a common lineage hierarchy.


Conflict of interest statement

None declared.

Figures

Fig. 1
Fig. 1
A single-cell chromatin atlas of IDH-mutant glioma. A Overview of the analysis of human clinical specimens. B Summary of the scATAC-seq data and separation of neoplastic cells. C PCA and clustering of neoplastic cells from the scATAC-seq data, based on genome-wide open-chromatin signatures. The first two PCA components are hierarchically clustered via Pearson correlation as a metric and Ward’s linkage. D Transcription-factor motif frequencies in scATAC-seq data for select motifs that are differentially enriched between IDH-A and IDH-O neoplastic cells at q<0.05 (Table 3), assessed via ChromVAR, represented as standardized deviances from expected (Methods), and separated by cluster. Error bars represent standard error. E Average expression (top) and log2 fold-change between IDH-A and IDH-O (bottom) for stem-like neoplastic cells, restricted to gene sets previously implicated during neuronal and glial genesis, assessed via limma (Additional file 3: Table S2 and Additional file 4: Table S3). The percentages of each cell-type’s gene set that are differentially expressed in IDH-A vs. IDH-O stem-like cells are represented as word clouds below. The higher the percentage, the larger the word
Fig. 2
Fig. 2
Differences in open chromatin and transcription-factor targeting between IDH-A and IDH-O. A Differential test for motif frequency in the scATAC-seq data between IDH-A and IDH-O neoplastic cells via ChromVAR. B Transcription-factor motif frequencies in scATAC-seq data for selected motifs that are differentially enriched between IDH-A and IDH-O neoplastic cells at q<0.05 (Table 3), assessed via ChromVAR, represented as standardized deviances from expected (Methods), and separated by cluster. Error bars represent standard error. C Differential peaks from scATAC-seq data called between IDH-A and IDH-O neoplastic cells via MACS at p<0.05. Peaks are represented as a heatmap (bottom) and a moving average (top) of reads per 10 bp, in a 2 Kbp window around the transposase cut site. D Over-represented transcription-factor motifs in differential peaks from scATAC-seq data, comparing IDH-A and IDH-O neoplastic cells. Over-representation compared to a background distribution was performed via HOMER, only motifs with q<0.05 are shown
Fig. 3
Fig. 3
Differences in immune-cell phenotypes, paracrine signals, and upstream transcription factors between IDH-A and IDH-O. A Percentages of monocytic-lineage cells found in IDH-A vs. IDH-O scRNA-seq data, and t-test. B Differential expression test via MAST for monocytic-lineage cells from scRNA-seq of IDH-A and IDH-O specimens. C Ligand/agonist expression in neoplastic-cell scRNA-seq from IDH-A and IDH-O specimens (top) paired to expression of the corresponding receptors in monocytic-lineage cells (bottom)
Fig. 4
Fig. 4
Phenotypic differences between ATRX knockout and wildtype gliomas in an IDH-mutant background. A A schematic overview of the murine studies. B An enzymatic cleavage assay, indicating homozygous knockout in ATRX exon 9 (Top), a Western blot showing complete loss of ATRX protein (bottom). C Fluorometric 2-HG detection assay, comparing wildtype IDH1 and IDH1R132H overexpression in ATRX-KO SB28 cells, *t test p<0.05. D Representative BLI images of ATRX-KO and wildtype intercranial tumors. E BLI timeseries. F Percentages of tumor-infiltrating monocytic-lineage cells expressing the given markers in ATRX-KO vs. wildtype, in an IDH1R132H background. G (Top) Differential expression test of snRNA-seq data via MAST, comparing tumor-infiltrating monocytic-lineage cells between ATRX-KO and wildtype tumors in an IDH1R132H background. (Bottom) Differential expression test of snRNA-seq data via MAST, comparing neoplastic cells between ATRX-KO and ATRX-wildtype tumors in an IDH1R132H background. H Differential peaks from scATAC-seq data called between neoplastic cells from ATRX-KO and ATRX-wildtype tumors with an IDH1R132H background. Peaks are called via MACS at p<0.05 and represented as a heatmap (bottom) and moving average (top) of reads per 10 bp, in a 2 Kbp window around the transposase cut site. I ScATAC-seq motif enrichment in differential peaks between ATRX-KO and ATRX-wildtype neoplastic cells. Motif frequency relative to a genome-wide background was scored via HOMER. J) Extracellular-matrix invasion assay, comparing ATRX-KO and wildtype cells with an IDH1R132H background
Fig. 5
Fig. 5
ATRX loss induces a global loss of CTCF, correlated gene dysregulation, and protects glioma cells from therapy-induced senescence. A Anti-CTCF single-cell CUT&Tag in SB28+IDH1R132H cells with ATRX KO or ATRX-wildtype scrambled control. Reads per 10 bp are shown as heatmaps (bottom) and summarized as averages (top) in a neighborhood of JASPAR CTCF motif sites. B CTCF motif frequencies in scCUT&Tag peaks, represented as standardized deviances from a data-driven null distribution via ChromVAR, for ATRX KO vs. wildtype cells (top), ***t test p < 1e−16. Numbers of, and overlap between, peaks in ATRX KO and wildtype datasets. C Browser shots of CTCF scCUT&Tag read pile-ups with significant peaks and genes annotated. D The percentages of NSC chromatin-loops affected, directly or indirectly, by CTCF loss upon ATRX KO (top). A Q-Q plot of the average ATRX-KO/WT cell-averaged log fold-changes in gene expression for each chromatin loop determined from NSC Hi-C data. Values on the y-axis are represented as percentages of a corresponding null distribution (Methods). The x-axis quantiles are provided by a Beta distribution fit to the inter-quartile range of y-axis percentiles. Loops containing specific genes are annotated. E Browser shots of a chromatin loop containing VEGFA and closeup of one boundary domain (left). A null distribution of average ATRX-KO/WT cell-averaged log fold-changes in gene expression measured via snRNA-seq in vivo in neoplastic cells, taken across all consecutive windows of four adjacent genes in chromosome 17. The loop containing VEGFA and the percentile of its average log fold-change are annotated (right-top). Violin plots of Vegfa expression in ATRX KO and WT neoplastic cells, in vivo, *MAST q < 0.05 (right-bottom). F As in E, except for a loop containing TNC. G Fluorometric assay for β-galactosidase activity in ATRX-KO and scrambled-control SB28 cells, both expressing IDH1R132H, post-treatment with one of Doxorubicin or CDKi. Error bars indicate standard error. *t test p < 0.05. B As in A, but for patient-derived ATRX/IDH1 double-mutant cells (SF10602) compared with an ATRX-wildtype, IDH1-mutant control (SF10417). Cells were treated with one of Temozolomide, Imatinib, Doxorubicin, or CDKi. C Visualization of β-galactosidase expression in ATRX-KO and scrambled-control SB28 cells, both expressing IDH1R132H, before and after treatment with CDKi. H Model of gene dysregulation due to CTCF disruption in chromatin-loop boundaries

Similar articles

Cited by

References

    1. Brat DJ, Verhaak RGW, Aldape KD, Yung WKA, Salama SR, Cooper LAD, et al. Comprehensive, integrative genomic analysis of diffuse lower-grade gliomas. N Engl J Med. 2015;372:2481–2498. - PMC - PubMed
    1. Venteicher AS, Tirosh I, Hebert C, Yizhak K, Neftel C, Filbin MG, et al. Decoupling genetics, lineages, and microenvironment in IDH-mutant gliomas by single-cell RNA-seq. Science. 2017;355:1391–1402. - PMC - PubMed
    1. Wang L, Babikir H, Müller S, Yagnik G, Shamardani K, Catalan F, et al. The phenotypes of proliferating glioblastoma cells reside on a single axis of variation. Cancer Discov. 2019;9:1709–1719. - PMC - PubMed
    1. Cairncross G, Wang M, Shaw E, Jenkins R, Brachman D, Buckner J, et al. Phase III trial of chemoradiotherapy for anaplastic oligodendroglioma: long-term results of RTOG 9402. J Clin Oncol. 2013;31:337–343. - PMC - PubMed
    1. Baumert BG, Hegi ME, van den Bent MJ, von Deimling A, Gorlia T, Hoang-Xuan K, et al. Temozolomide chemotherapy versus radiotherapy in high-risk low-grade glioma (EORTC 22033-26033): a randomised, open-label, phase 3 intergroup study. Lancet Oncol. 2016;17:1521–1532. - PMC - PubMed

Publication types