Global, regional, and national burden of Guillain-Barré syndrome and its underlying causes from 1990 to 2019
- PMID: 34763713
- PMCID: PMC8581128
- DOI: 10.1186/s12974-021-02319-4
Global, regional, and national burden of Guillain-Barré syndrome and its underlying causes from 1990 to 2019
Abstract
Background: This article presents the first detailed analysis of the prevalence and disability burden of Guillain-Barré syndrome (GBS) from 1990 to 2019 by cause, age, sex, and Socio-demographic Index (SDI) in 204 countries and territories.
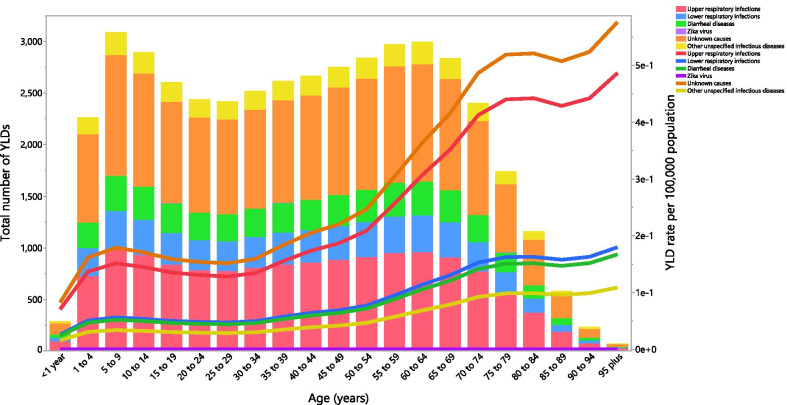
Methods: Data from the Global Burden of Diseases Study (GBD) 2019 were used. GBD 2019 modelled the prevalence of GBS using hospital and claims data. Years lived with disability (YLDs) were estimated as the product of the GBS prevalence and the disability weight. This article also reported proportions in the age-standardised prevalence rate that were due to six underlying causes of GBS.
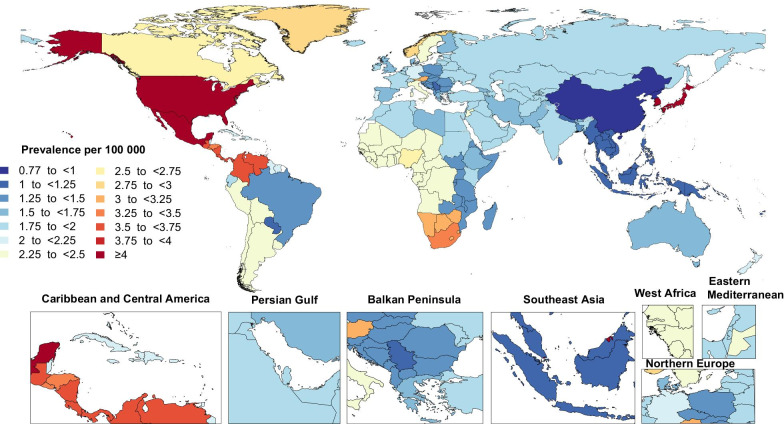
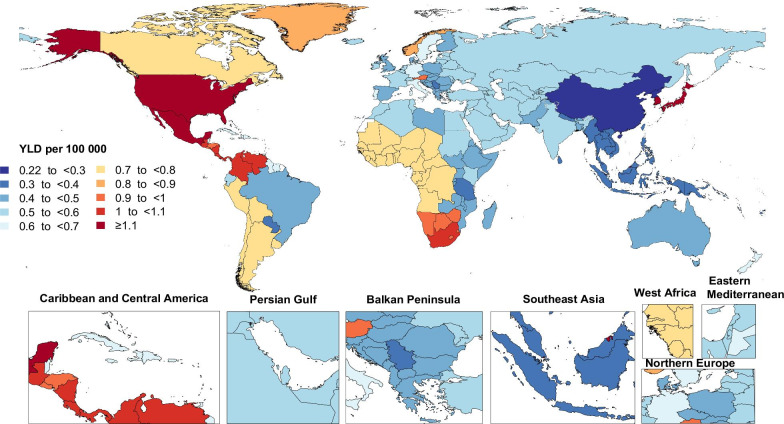
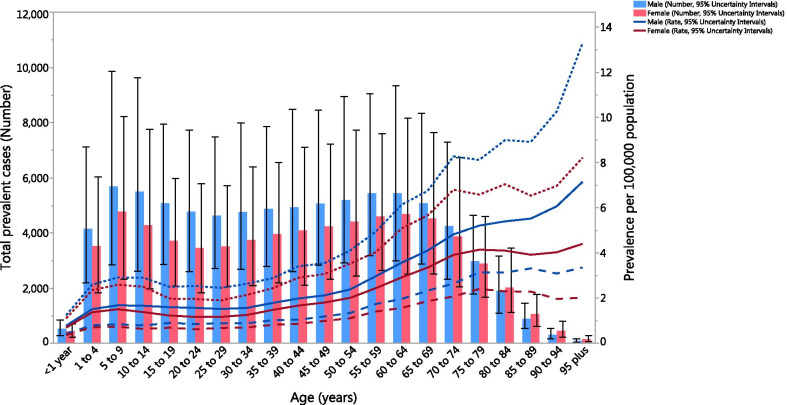
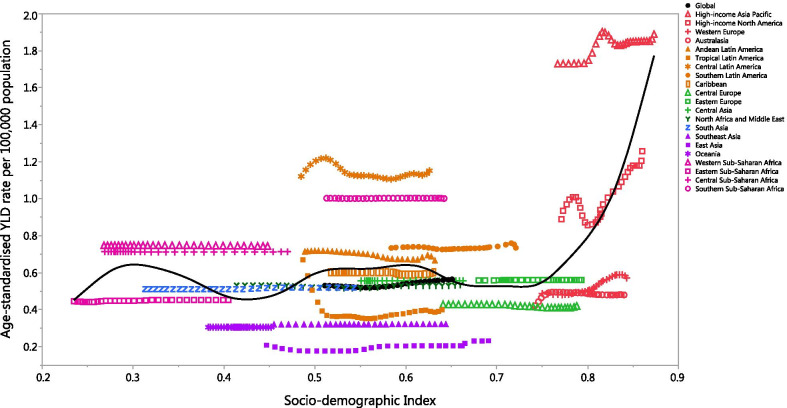
Results: In 2019, there were 150,095 [95% uncertainty intervals (UI) 119,924 to 188,309] total cases of GBS worldwide, which resulted in 44,407 (95% UI 28,016 to 64,777) YLDs. Globally, there was a 6.4% (95% UI 3.6 to 9.5) increase in the age-standardised prevalence of GBS per 100,000 population between 1990 and 2019. High-income Asia Pacific [1.9 (95% UI: 1.5 to 2.4)] and East Asia [0.8 (95% UI: 0.6 to 1.0)] had the highest and lowest age-standardised prevalence rates (per 100,000), respectively, in 2019. Nationally, Japan [6.4 (95% UI: 5.3 to 7.7)] and China [0.8 (95% UI: 0.6 to 1.0)] had the highest and lowest age-standardised prevalence rates (per 100,000). The age-standardised burden of GBS increased with increasing age and was higher in males in all age groups. Furthermore, the age-standardised prevalence of GBS (per 100,000) had a positive association with the level of development, as measured by SDI, although this association was not strong. Upper respiratory infections and unknown causes accounted for the highest proportions of underlying causes.
Conclusions: Globally, the prevalence of GBS continues to increase. Geographical differences and strategies aimed at preventing infectious diseases should be considered in future health policy planning and decision-making processes. This study had several limitations, such as using the same disability weight for all causes and a reliance on hospital- and self-reported data, which should be addressed in future research.
Keywords: Cause; Global burden of disease; Guillain–Barré syndrome; Prevalence; Years lived with disability.
© 2021. The Author(s).
Conflict of interest statement
The authors declare that they have no competing interests.
Figures