. 2021 Nov 11;22(1):310.
doi: 10.1186/s13059-021-02525-6.

Comprehensive characterization of single-cell full-length isoforms in human and mouse with long-read sequencing

Affiliations

Comprehensive characterization of single-cell full-length isoforms in human and mouse with long-read sequencing

Luyi Tian et al. Genome Biol. .

Abstract

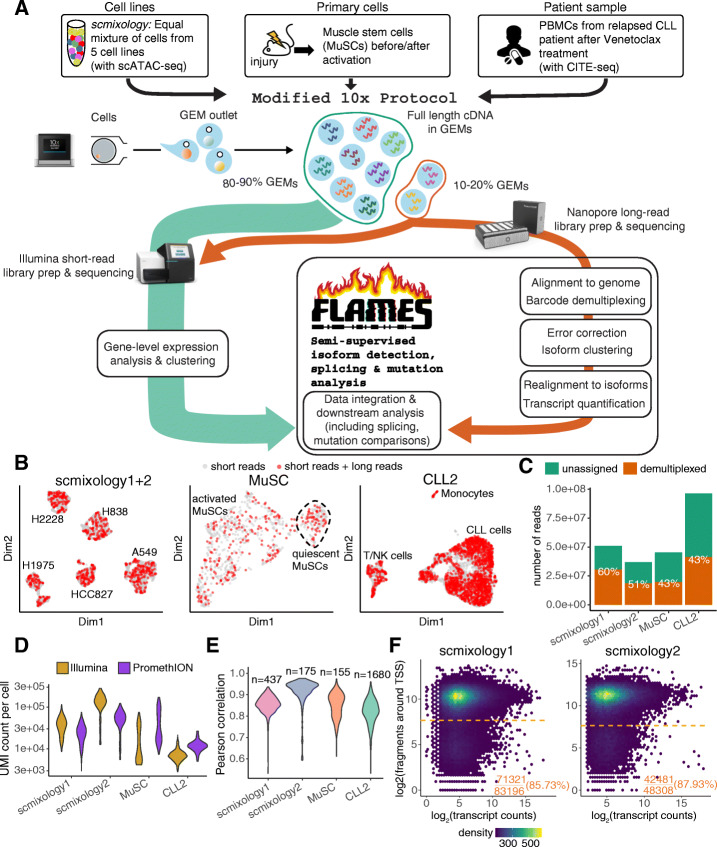
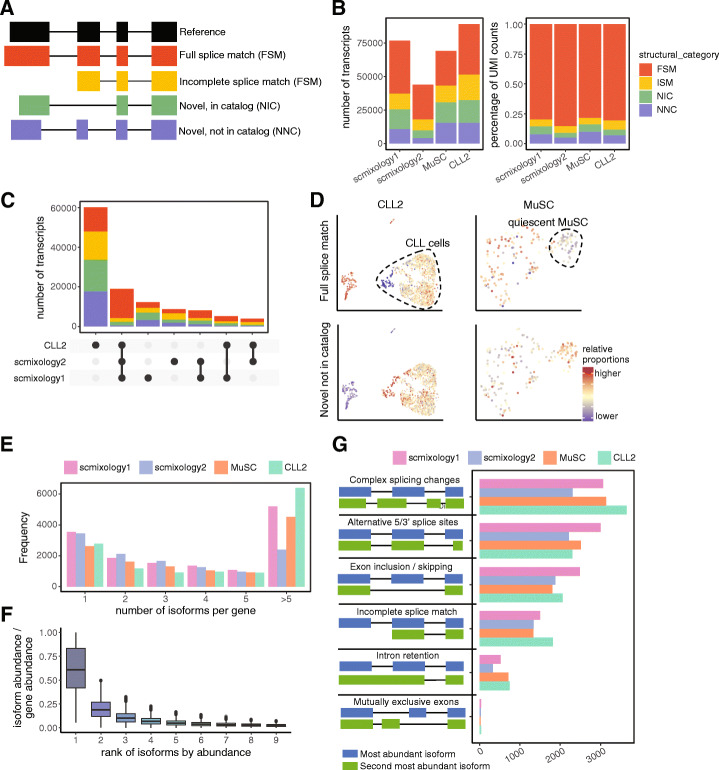
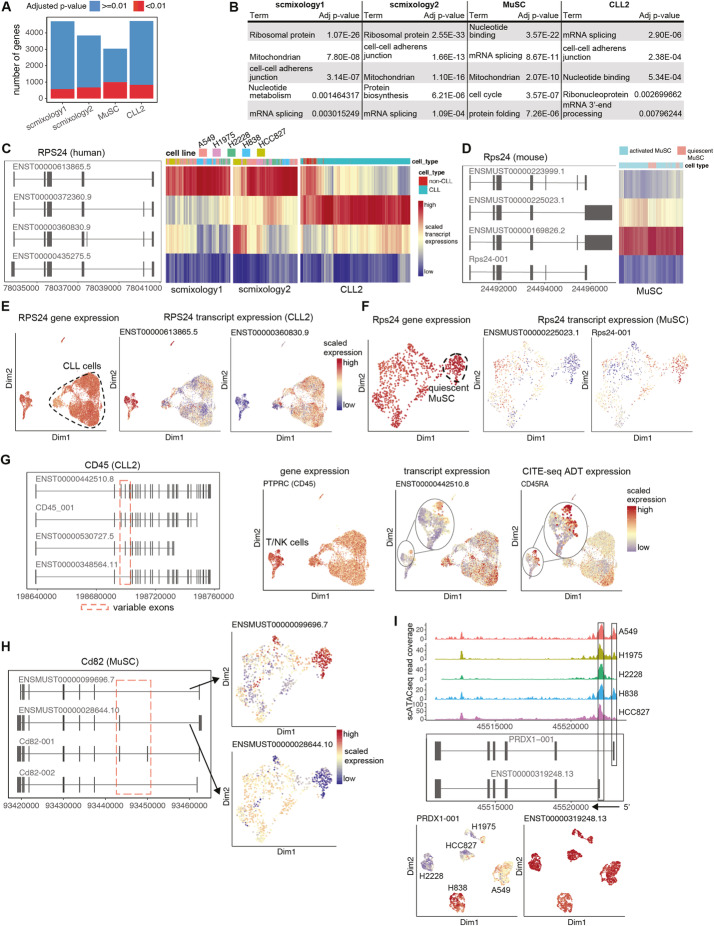
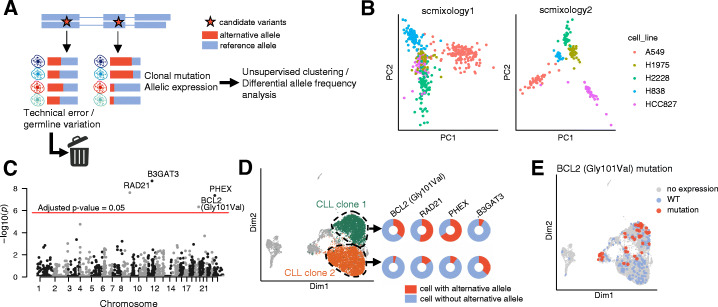
A modified Chromium 10x droplet-based protocol that subsamples cells for both short-read and long-read (nanopore) sequencing together with a new computational pipeline (FLAMES) is developed to enable isoform discovery, splicing analysis, and mutation detection in single cells. We identify thousands of unannotated isoforms and find conserved functional modules that are enriched for alternative transcript usage in different cell types and species, including ribosome biogenesis and mRNA splicing. Analysis at the transcript level allows data integration with scATAC-seq on individual promoters, improved correlation with protein expression data, and linked mutations known to confer drug resistance to transcriptome heterogeneity.

Keywords: Long-read sequencing; Single-cell gene expression; Single-cell multi-omics; Splicing.


Conflict of interest statement

The authors declare that they have no competing interests.

Figures

Fig. 1
Fig. 1
Overview of experimental design, modified 10x protocol, FLAMES method, and basic summary statistics. A Summary of the study design, with an overview of the modified 10x protocol and FLAMES data processing pipeline. B UMAP visualization of cells in each sample, cells colored in red are sampled for long-read sequencing. scmixology1 and scmixology2 were integrated and shown together in one plot. All UMAP visualizations are based on short-read data. C The number of nanopore reads generated from each sample, and the percentage of reads that were assigned a cell barcode. D Distribution of UMI counts per cell for Illumina and nanopore data in each sample. E Correlations between gene UMI counts generated from nanopore long-read and Illumina short-read data. F Density scatter plot shows the relationship between transcript-level counts and scATAC-seq read counts around the TSS regions. The horizontal orange line shows the threshold calculated that separates open chromatin from the background. The percentage shows the transcripts that have their TSSs in open chromatin regions
Fig. 2
Fig. 2
Overview of the single-cell isoform-level analysis from FLAMES. A Classification of transcripts according to their splice sites when compared to reference annotations. B Summary of transcripts in different categories in A both in numbers (left) and in the percentage of UMI counts (right). C UpSet plot showing overlap of transcripts in human datasets, where the number of transcripts shared by different sets of samples is indicated in the top bar chart, colored by categories specified in A. D UMAP visualization of CLL2 and MuSC dataset on the cells sampled for long-read sequencing. Colored by percentage of UMI counts of transcripts in FSM (top) and NNC (bottom) categories. CLL cells and quiescent MuSCs are annotated on the plot. E Bar plot of the number of distinct transcripts expressed per gene. Genes with more than five distinct transcripts are merged. F Box plot showing the percentage of transcript abundance relative to gene abundance for genes express multiple transcripts. Transcripts are ranked by abundance, shown on the x-axis. G Summary of the type of alternative splicing between the two most abundant transcripts of each gene. The “Complex splicing changes” category represents transcripts with more than one type of constitutive alternatively spliced event
Fig. 3
Fig. 3
Summary of differential transcript usage results from FLAMES. A Summary of results from the statistical testing of DTU detected many significant genes per sample (adjusted P-value < 0.01). B Table of common functional categories among different samples from the functional enrichment analysis of gDTU. C Top 4 most abundant isoforms of RPS24 in human and heatmap of their expression at the single-cell level in the scmixology1, scmixology2, and CLL2 samples. D Top 4 most abundant isoforms of RPS24 in mouse and heatmap of their expression at the single-cell level in MuSCs. E UMAP of cells in CLL2, colored by RPS24 gene expression and transcript expression. Two transcripts with differential expression on different populations were selected. Transcript expression in each cell is colored by scaled relative expression to highlight the difference between different populations. F Similar to E, UMAP of cells in MuSC sample, colored by RPS24 gene expression and transcript expression. G Top 4 most abundant isoforms of CD45 in CLL2 and UMAP visualizations of the cells colored by (from left to right) gene expression, transcript expression, and corresponding protein expression. H Top 4 most abundant isoforms of CD82 in MuSC, with UMAP visualization of cells colored by expression of two isoforms that have differential expression between quiescent and activated MuSC. I scATAC-seq read coverage for PRDX1 with cells from each cell line aggregated and plotted together. UMAP plots showing isoform expression, with each cell colored by scaled transcript expression
Fig. 4
Fig. 4
Summary of differential allele frequency analysis to detect coding mutations. A Summary of variation filtering and analysis pipeline implemented in FLAMES. Candidate variants are filtered based on allele frequency first, then based on per cell allele frequency to remove technical artifacts. The remaining variants are used for differential allele frequency analysis. B PCA on alternative allele matrix using the variants after filtering, colored by unsupervised clustering results using top PCs and annotated with cell lines. C Manhattan plot of P-values from a differential allele frequency analysis with Benjamini–Hochberg adjustment. Genes with significant variants are labeled. D UMAP visualization highlighting two CLL populations that have differential allele frequency for the significant variants. E UMAP visualization of cells colored by Gly101Val mutation status

References

    1. Han X, Zhou Z, Fei L, Sun H, Wang R, Chen Y, et al. Construction of a human cell landscape at single-cell level. Nature. 2020;581(7808):303–9. Available from: 10.1038/s41586-020-2157-4. - PubMed
    1. Shalek AK, Satija R, Adiconis X, Gertner RS, Gaublomme JT, Raychowdhury R, et al. Single-cell transcriptomics reveals bimodality in expression and splicing in immune cells. Nature. 2013;498:236–40. Available from: http://www.pubmedcentral.nih.gov/articlerender.fcgi?artid=3683364&tool=p.... - PMC - PubMed
    1. Song Y, Botvinnik OB, Lovci MT, Kakaradov B, Liu P, Xu JL, et al. Single-cell alternative splicing analysis with expedition reveals splicing dynamics during neuron differentiation. Mol Cell. 2017;67:148–61.e5. Available from: 10.1016/j.molcel.2017.06.003. - PMC - PubMed
    1. Hagemann-Jensen M, Ziegenhain C, Chen P, Ramsköld D, Hendriks G-J, Larsson AJM, Faridani OR, Sandberg R. Single-cell RNA counting at allele and isoform resolution using Smart-seq3. Nat Biotechnol. 2020;38(6):708–714. doi: 10.1038/s41587-020-0497-0. - DOI - PubMed
    1. Zheng GXY, Terry JM, Belgrader P, Ryvkin P, Bent ZW, Wilson R, et al. Massively parallel digital transcriptional profiling of single cells. Nat Commun. 2017;8:14049. Available from: http://www.nature.com/articles/ncomms14049. - PMC - PubMed

Publication types