Echocardiographic Ischemic Memory Molecular Imaging for Point-of-Care Detection of Myocardial Ischemia
- PMID: 34763776
- PMCID: PMC8597917
- DOI: 10.1016/j.jacc.2021.08.068
Echocardiographic Ischemic Memory Molecular Imaging for Point-of-Care Detection of Myocardial Ischemia
Abstract
Background: Noninvasive molecular imaging of recent ischemia can potentially be used to diagnose acute coronary syndrome (ACS) with high accuracy.
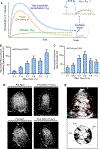
Objectives: The authors hypothesized that bedside myocardial contrast echocardiography (MCE) ischemic memory imaging could be achieved with phosphatidylserine microbubbles (MBPS) that are retained in the microcirculation via ischemia-associated endothelial activation.
Methods: A dose-finding study was performed in healthy volunteers (n = 17) to establish optimal MBPS dosing. Stable patients with ACS (n = 30) and confirmed antecedent but resolved myocardial ischemia were studied within 2 hours of coronary angiography and percutaneous coronary intervention (PCI) when indicated. MCE molecular imaging was performed 8 minutes after intravenous administration of MBPS. MCE perfusion imaging was used to assess the status of the postischemic microcirculation.
Results: Based on dose-finding studies, 0.10 or 0.15 mL of MBPS based on body mass was selected. In patients with ACS, all but 2 underwent primary PCI. MCE molecular imaging signal intensity was greater in the postischemic risk area vs remote territory (median [95% CI]: 56 [33-66] vs 8 [2-17] IU; P < 0.001) with a receiver-operating characteristic curve C-statistic of 0.94 to differentiate post-ischemic from remote territory. Molecular imaging signal in the risk area was not related to type of ACS (unstable angina: 3; non-ST-segment elevation myocardial infarction: 14; ST-segment elevation myocardial infarction: 13), peak troponin, time to PCI, post-PCI myocardial perfusion, GRACE (Global Registry of Acute Coronary Events) score, or HEART score.
Conclusions: Molecular imaging with point-of-care echocardiography and MBPS can detect recent but resolved myocardial ischemia. This bedside technique requires only minutes to perform and appears independent of the degree of ischemia. (Ischemic Memory Imaging With Myocardial Contrast Echocardiography; NCT03009266).
Keywords: echocardiography; ischemia; molecular imaging.
Copyright © 2021 American College of Cardiology Foundation. Published by Elsevier Inc. All rights reserved.
Conflict of interest statement
Funding Support and Author Disclosures This work was supported by a grant and material support from GE Healthcare. Dr Lindner is supported by grants R01-HL078610, R01-HL130046, and P51-OD011092 from the National Institutes of Health, Bethesda, Maryland, and by grant 18-18HCFBP_2-0009 from NASA, Washington, DC. All other authors have reported that they have no relationships relevant to the contents of this paper to disclose.
Figures


Comment in
-
The Potential for Retained Microbubbles: To Imaging . . . and Beyond.J Am Coll Cardiol. 2021 Nov 16;78(20):2001-2003. doi: 10.1016/j.jacc.2021.08.069. J Am Coll Cardiol. 2021. PMID: 34763777 No abstract available.
References
-
- Sandoval Y, Apple FS, Smith SW. High-sensitivity cardiac troponin assays and unstable angina. Eur Heart J Acute Cardiovasc Care 2018;7:120–128. - PubMed
-
- Taegtmeyer H, Dilsizian V. Imaging myocardial metabolism and ischemic memory. Nat Clin Pract Cardiovasc Med 2008;5 Suppl 2:S42–8. - PubMed
-
- Kontos MC, Dilsizian V, Weiland F et al. Iodofiltic acid I 123 (BMIPP) fatty acid imaging improves initial diagnosis in emergency department patients with suspected acute coronary syndromes: a multicenter trial. J Am Coll Cardiol 2010;56:290–9. - PubMed
Publication types
MeSH terms
Substances
Associated data
Grants and funding
LinkOut - more resources
Full Text Sources
Medical
Miscellaneous

